Heavy Quark Free Energies and Screening in SU(2) Gauge Theory 111This work is supported by the DFG Grant No. FOR 339/1-2.
Abstract
We investigate the singlet, triplet and colour average heavy quark free energies in pure gauge theory at various temperatures . We focus on the long distance behaviour of the free energies, studying in particular the temperature dependence of the string tension and the screening masses. The results are qualitatively similar to the scenario, except near the critical temperature of the deconfining transition. Finally we test a recently proposed method to renormalize the Polyakov loop.
1 Introduction
The interaction between quarks in a medium at some temperature has been subject of intensive investigations in the last years [1]-[3]. In general, one expects that the medium strongly affects the interaction, especially at large separations . Below the deconfinement temperature the confining part of the interaction gets modified, so that the string tension is a function of . Above the most important effect is the screening of the colour charges, which leads to an exponentially decreasing potential for .
We investigate here the modification of interquark forces in terms of the free energy of a static quark-antiquark pair in pure gauge theory. We analyze the singlet, triplet and average colour channels.
Below we compare our data with the behaviour at and study the variation of the string tension with the temperature; above we study the temperature dependence of the screening mass both for the average and for the singlet free energies.
2 Free energies in SU(2) gauge theory
On the lattice the free energy of the static quark-antiquark pair in the gluonic medium is determined by measuring Wilson line correlation functions
| (1) |
| (2) |
| (3) |
where , and refer to the colour singlet state, the colour triplet one and to the colour average of the free energy in the singlet and adjoint channels, respectively. The normalization constant can be fixed in various ways, e.g. by comparison with the free energies. In order to determine the singlet and triplet free energies we fixed the Coulomb gauge, where both free energies coincide with a gauge independent definition which was recently proposed [2].
The variation with of the free energy (especially the colour singlet one) is also important because the corresponding potential could be used to calculate the binding energies of heavy mesons when . These binding energies can be used to determine the sequential suppression pattern of heavy quarkonia as a function of the temperature [4].
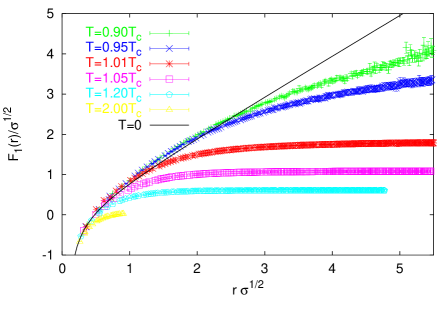
In Fig. 1 we show the behaviour of the colour singlet free energy. The pattern looks the same as in gauge theory [3]. The solid black line is the fit to the potential done by the UKQCD collaboration [5]. In the region we notice an enhancement compared to the curve (also found in [2]).
In the deconfinement phase the curves reach a plateau at some distance which decreases with the temperature, as expected; near screening sets in at distances , that is of the order of 0.5 fm (assuming MeV).
3 Results Below : String Tension
In the confinement phase the study of heavy-quark free energies allows to verify string models’ predictions concerning the form of the potential [6]. According to such predictions, at distances , the potential becomes
| (4) |
where the logarithmic term is due to transverse fluctuations of the string [7].
We find that the singlet, triplet and average free energies relative to the same temperature converge to the same line at large distances, so that is identical no matter which colour channel one considers.
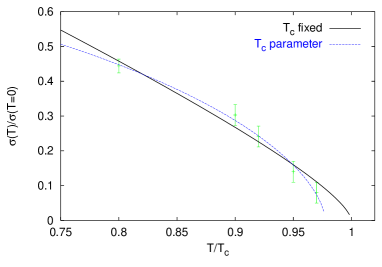
By fitting the ansatz (4) on the tail of the colour average curves, we derived the string tension , which we plot in Fig. 2 as a function of . For temperatures very close to , the fit ansatz is no longer good because of finite size effects: this issue is still under investigation. Near one expects that , where is the 3D Ising exponent. We adopted the scaling ansatz used in [8], , with and as free parameters. The solid line in the plot is the best fit curve, and we see that it is compatible with the data. If we also take as a parameter of the fit, we get a much better agreement for a curve centered at the ”pseudocritical” temperature (dashed line in the plot).
4 Results Above : Screening
At deconfinement, the determination of the free energies is important both to find the domain of validity of perturbation theory and to study the screening effects on the heavy quark free energy due to the medium of unbound coloured gluons.
To extract the screening masses we applied the correlated fit introduced in [9] to the singlet and average correlators. Our fit ansatz was
| (5) |
where we considered . Here we set . The resulting values of the screening mass are shown in Fig. 3 as a function of .
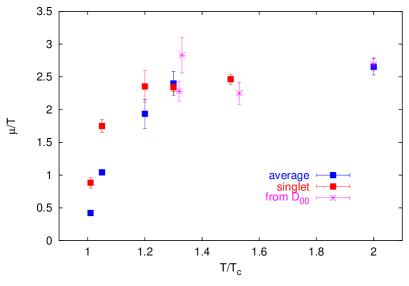
In the plot the masses relative to the singlet are the ones obtained from the fits with : our values are compatible with those obtained from the electric propagator in Landau gauge [10]. Moreover we see that the mass decreases while approaching , in contrast to the case [11]. For the average free energy and we obtain good fits only for , whereas for both and yield reasonable s. This gives a systematic error of about in the screening mass.
5 Conclusions
We found that the free energies exhibit some peculiar features as compared with their counterparts, especially near , where the order of the deconfining transition plays an important role. Apart from the temperature dependence of the string tension, which was already known, we mention in particular the decrease of the electric screening mass of the singlet free energy by approaching .
Acknowledgments
We would like to thank A. Cucchieri for giving us the gauge fixing program, R. D. Pisarski, J. Engels and O. Kaczmarek for stimulating discussions.
References
- [1] O. Kaczmarek et al., Phys. Rev. D62, 034021 (2000).
- [2] O. Philipsen, Phys. Lett. B535, 138 (2002).
- [3] O. Kaczmarek et al., Phys. Lett. B543, 41 (2002).
- [4] S. Digal et al., Phys. Lett. B514, 57 (2001) and Phys. Rev. D64, 094015 (2001).
- [5] S. P. Booth et al., Nucl. Phys. B394, 509 (1993).
- [6] M. Gao, Phys. Rev. D40, 2708 (1989).
- [7] M. Lüscher et al., Nucl. Phys. B 173, 365 (1980).
- [8] J. Engels et al., Nucl. Phys. B280 [FS18], 577 (1987).
- [9] C. Michael, A. McKerrell, Phys. Rev. D51, 3745 (1995).
- [10] U. M. Heller et al., Phys. Lett. B355, 511 (1995).
- [11] O. Kaczmarek et al., contribution to SEWM 2002.