GUTPA/00/11/01
WUB 01-01
Quark mass effects on the topological
susceptibility in QCD
Abstract
We investigate topology in lattice simulations of QCD with two flavours of dynamical Wilson fermions. At various sea quark masses we find reasonable agreement between results for the topological charge from fermionic and gluonic definitions, the latter with cooling. We study correlations of the topological charge with light hadronic observables and find effects in the flavour singlet pseudoscalar channel. The quark mass dependence of the topological susceptibility, , is consistent with the leading order small expectation, .
pacs:
PACS numbers: 11.15.Ha, 12.38.Gc, 11.30.Rd, 12.38.AwI Introduction
One of the most intriguing features of QCD is its topological vacuum structure which results in phenomenological consequences with an important bearing on particle physics such as the breaking of the axial and chiral symmetries.
In the context of pure gauge theories, lattice methods have by now matured to provide a valuable tool kit for accessing the continuum topological susceptibility, . Various gluonic definitions of the topological charge lead to consistent estimates of [1], and remnants of the Atiyah-Singer index theorem are witnessed to hold on the lattice: the topological charge, , as obtained after cooling from the gluonic degrees of freedom is consistent with the fermionic index, as determined from counting the zero-level crossings of the eigenvalues of the Wilson-Dirac operator, , under variations of the bare quark mass, [2, 3]. Moreover, one might perceive the very value of as delivered by quenched lattice simulations [4, 5, 6, 7], MeV, to confirm the lattice approach to topological properties: it turns out to be in fairly good agreement with the large anticipation made by Witten and Veneziano [8], . In conclusion, the lattice machinery appears to work for the study of topological aspects in gluodynamics.
Unfortunately, however, the situation regarding the QCD vacuum proper is by far less settled: for sheer cost reasons so far only the regime of intermediate sea quark masses, not much lighter than the strange quark, has been explored. In fact it is still under debate whether the data from full QCD simulations support the expected vanishing susceptibility at chiral sea quark masses, :
| (1) |
Attempts to verify this prediction via lattice simulations have a long history. While the first lattice studies in this direction with Kogut-Susskind (KS) sea quarks [9, 10, 11, 12] could not reach conclusive results, later investigations did yield some qualitative evidence in favour of the expected decrease of [13].
Quite recently, this problem has been revisited from three different sides — but the debate is still open: the CP-PACS [14] and UKQCD [15] collaborations employed improved Wilson fermionic and different gluonic actions while the Pisa group [16] operated with two and four flavours of KS fermions. A further data point for KS flavours has been obtained by Hasenfratz [17] (for a recent review see e.g. Ref. [18]). While both the Pisa group (working at an inverse lattice spacing GeV and bare quark masses ) and the CP-PACS collaboration (at GeV, ) saw no evidence whatsoever in favour of the expected chiral behaviour, the UKQCD collaboration did verify (at GeV and ) a decrease of , consistent with theoretical expectations.
In this paper we shall present an analysis focused on this issue, based on the final statistics of our SESAM and TL samples of QCD vacuum configurations. The article is organised as follows. In Sect. II we describe the details of our simulation and methodology, including a comparison between fermionic and gluonic definitions of the topological charge. Preliminary results on this comparison, based on smaller statistical samples, have been reported by us previously [19]. In Sect. III we investigate correlations between the topological charge and the hadron spectrum. Finally, in Sect. IV, we present the lattice data on the topological susceptibility.
II Determination of the topological charge
A Measurements
We analyse ensembles of gauge configurations that have been generated by means of the hybrid Monte Carlo (HMC) algorithm using the Wilson fermionic and gluonic actions with mass degenerate quark flavours at the inverse lattice coupling, , corresponding to an inverse lattice spacing GeV at physical sea quark masses. This was done on as well as on lattices at five different values of the sea quark mass parameter. The corresponding chiralities can be quantified in terms of -ratios, ranging between and [20]. The relevant simulation settings are displayed in Table I [21]. At each -value 4,000–5,000 thermalized HMC trajectories have been generated. In addition to the dynamical quark simulations, quenched reference measurements on lattices at were performed. The configurations that enter the analysis are separated by 25 (24 at and 10 in the quenched simulation) HMC trajectories.
| GeV | |||||||
| 0.1560 | 206 | 5.11(3) | 2.01(1) | 7.14(4) | 0.834(3) | ||
| 0.1565 | 209 | 5.28(5) | 2.08(2) | 6.39(6) | 0.813(9) | ||
| 0.1570 | 200 | 5.48(7) | 2.16(3) | 5.51(4) | 0.763(6) | ||
| 0.1575 | 215 | 5.96(8) | 2.35(3) | 4.50(5) | 0.692(10) | ||
| ” | ” | 2200 | ” | ” | ” | ” | 54(4) |
| 0.1575 | 150 | 5.89(3) | 2.32(1) | 6.65(6) | 0.704(5) | ||
| 0.1580 | 140 | 6.23(6) | 2.45(2) | 4.77(7) | 0.574(13) | ||
| — | — | — | 0.179(1) | — | |||
| 320 | 5.33(3) | 2.10(1) | — | — |
Lower limits on the integrated autocorrelation times, , are estimated by binning the data for the topological charge , , into blocks that contain successive measurements each. On each such block of length an average , is calculated: . We determine fluctuations between these bins,
| (2) |
where the average is calculated on the first configurations. We then estimate the autocorrelation times,
| (3) |
that are included in the table. denotes the measurement frequency. On the volume at , in addition to the time series, we also determined the topological charge with increased frequency , with a reduced number of 10 (as opposed to 60) cooling sweeps. The larger frequency enabled us to compute the autocorrelation time from the autocorrelation function itself, with full control over statistical errors [19, 22]. The resulting value, , is consistent with our estimate obtained in the way described above, . We take this as an indication that our estimates are reasonable. Interestingly, the autocorrelation times grow both with decreasing quark mass and increasing volume as already observed in Ref. [19].
We employ a gluonic as well as a fermionic definition of the topological charge. In the gluonic case we define a topological charge density,
| (4) |
where we use the symmetric (clover leaf) definition [23],
| (5) |
and , which is correct up to order lattice artefacts. The topological charge,
| (6) |
should then approach integer values as in the infinite volume limit, on sufficiently smooth gauge configurations.
B Renormalization
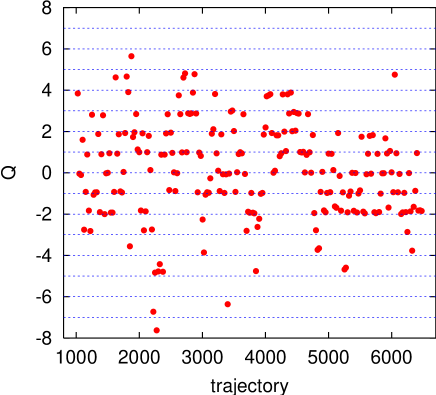
In a quantum field theory, both and undergo multiplicative renormalization. Moreover, requires additive renormalization. Cooling [24, 25] is meant to filter for (semi)-classical features; indeed, after cooling, both renormalization constants have been shown to be close to their trivial values [1, 5]. In the context of this article we will not investigate properties of the density distribution itself but rather stick to the net topological charge only. For this purpose the iterative application of cooling by simple minimisation of the Wilson plaquette action is appropriate. To keep the cooling update local we visit the lattice sites in an even-odd pattern, rather than in the sequential ordering that is usually employed in the Monte Carlo updating of pure gauge configurations. The inner-most loop within a cooling sweep runs across the directions , and we carry out 60 such sweeps. In Fig. 1 we illustrate the resulting numerical pattern of topological charges which cluster nicely around integer values as anticipated.
| 0.1560 | 16 | 0.0498 | 0.060 | 1.20 |
|---|---|---|---|---|
| 0.1565 | 16 | 0.0395 | 0.056 | 1.43 |
| 0.1570 | 16 | 0.0293 | 0.045 | 1.55 |
| 0.1575 | 16 | 0.0192 | 0.029 | 1.49 |
| 0.1575 | 24 | 0.0192 | 0.031 | 1.64 |
| 0.1580 | 24 | 0.0092 | 0.017 | 1.79 |
The fermionic method consists of determining the topological charge à la Smit and Vink [26],
| (7) |
that is inspired by the continuum axial divergence relation, . The above trace is to be taken over Dirac, colour and space-time indices only (not over the flavours), i.e. for mass degenerate quark flavours. is a renormalization constant, denotes the bare quark mass and is the lattice discretised version of ,
| (8) | |||||
| (9) |
We determine using noisy sources with diagonal improvement as detailed in Ref. [27]. On the configurations 100 such estimates were performed while at all other values we averaged over 400 estimates*** Approximating by a finite number of noise vectors can result in an underestimated integrated autocorrelation time. Nonetheless, we find the -estimates from the fermionic definition [22] to be consistent with the gluonic ones of Table I..

The renormalization constant in Eq. (7) is unknown. We attempt to estimate the combination from the ratio of the gluonic [Eq. (6)] and of the fermionic [Eq. (7))] definitions. We determine using the critical value, [20]. The results are displayed in Table II, assuming the multiplicative renormalization of the gluonic definition after cooling to be unity. The estimates of the fermionic traces are subject to statistical uncertainties, on the lattices and – 3 on the volumes. In addition, both definitions are expected to suffer from different lattice artefacts. We do not attempt to estimate the resulting statistical and systematic uncertainties on . We find to be of order one and to depend monotonously on the quark mass, with the deviation from unity increasing when approaching the chiral limit.
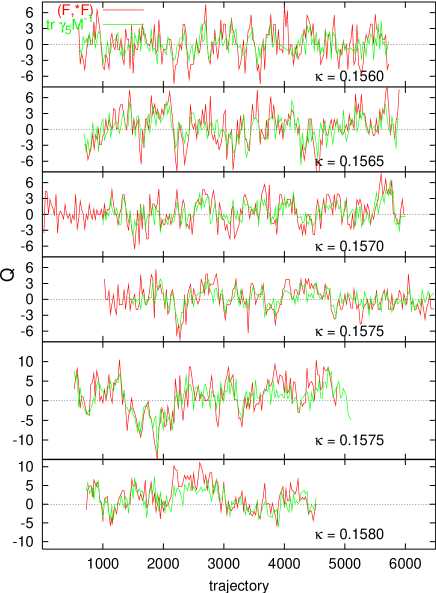
The correlation between the two definitions is visualised in the scatter plot, Fig. 2, for the lattices at . While the gluonic data points cluster around integer values, this is not the case for the (stochastically estimated) fermionic values. The data of the figure are normalised such that the points should collapse onto the line with slope one. Indeed, 137 out of 199 values (62 %) lie within the one error band. The correlation between the two definitions is also visible from the Monte Carlo histories depicted in Fig. 3.
C Ergodicity
In Fig. 3 we survey the Monte Carlo histories of for all our runs. These charts provide a gross evidence for the quality of our data in view of the decorrelation with respect to the topological sectors. The topological susceptibility,
| (10) |
should be independent of the volume to a first approximation. Therefore, the modulus of the topological charge should scale in proportion to . Indeed, the topological charge distribution on the large lattice at is by a factor of about two wider than that on the small lattice. We also observe reduced fluctuations as we increase at fixed . While the time histories appear to tunnel ergodically through all topological sectors the total number of tunnellings observed for is not yet sufficient to achieve a symmetric distribution.
III Topology and the hadron spectrum
We address the question whether the statistics presented in Fig. 3 suffices to expose a significant dependency of hadronic states. To minimise statistical errors we subdivided each sample into two subsamples only, one containing configurations with and one with . For the smaller volume at this division results in two subsamples of approximately 100 configurations each.
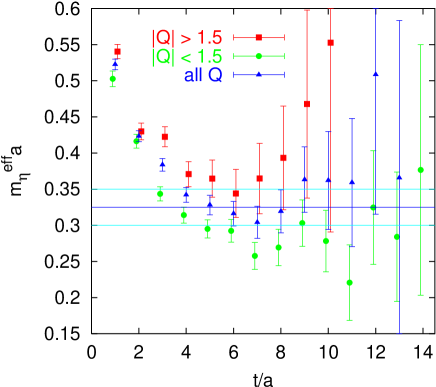
The most interesting test case is given by the effective masses in the flavour singlet pseudoscalar channel, , that should be particularly sensitive to the vacuum topology. This is confirmed by the data displayed in Fig. 4. We find the mass on vacuum configurations with to systematically lie below the corresponding mass obtained with the cut . Note that in the infinite volume limit one would expect such a sensitivity of correlation functions on to disappear. For further details we refer to Ref. [28].
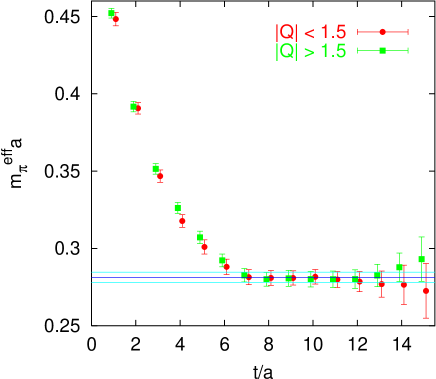
In Fig. 5 we show the corresponding flavour octet channel quantities, i.e. effective masses, where we anticipate no such correlation with topology. This is indeed borne out by the data: not only at but time slice by time slice no sensitivity to the value of the modulus of the topological charge is detected, with rather high statistical accuracy. The horizontal line with error band indicates the asymptotic large results obtained from a fit to the entire data sample [20].
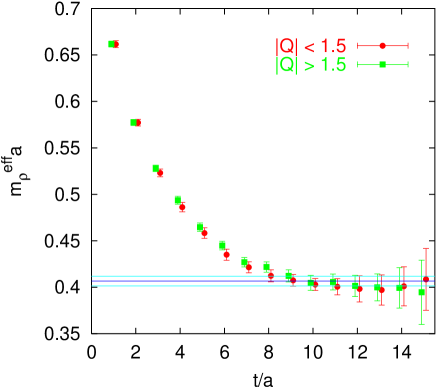
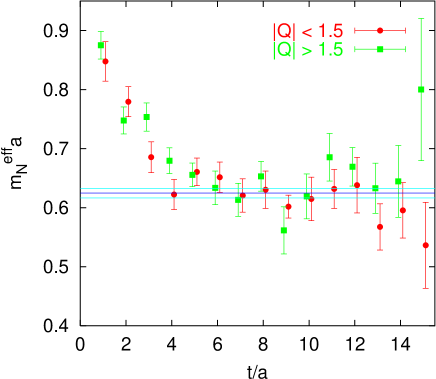
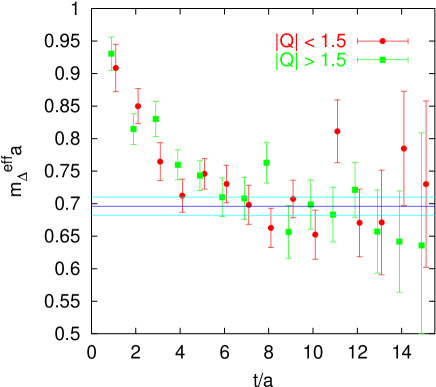
Apart from the none of the standard mesonic, baryonic and glueball-like states exhibit correlations between and the respective effective masses. In Figs. 6 – 8 we illustrate this for the , the nucleon and the . In no case have we found any systematic effects on the static potential. Of course this does not exclude the possibility of correlations between hadronic properties and the distribution of instantons and anti-instantons and their relative orientations in colour and position space [29].
IV The topological susceptibility
In Figs. 9 – 11 we display three histograms of topological charge distributions. Each bin with width , centred around , contains all measurements resulting in charges within the interval , where on the lattice depicted in Fig. 9 and for the lattices of Fig. 10 and Fig. 11. In addition to the data we display Gaussian distributions,
| (11) |
In Fig. 9 we include the statistical uncertainties of the individual bins, , while in Fig. 10 and Fig. 11 the error on the width of the distribution is reflected by the error band around the central curve.
| MeV | |||||
|---|---|---|---|---|---|
| 0.1560 | 16 | 0.04(32) | 69(6) | 0.466(11) | 183(4)(9) |
| 0.1565 | 16 | 0.48(48) | 83(13) | 0.505(22) | 199(8)(10) |
| 0.1570 | 16 | 0.60(34) | 57(10) | 0.476(22) | 187(8)(9) |
| 0.1575 | 16 | 0.05(33) | 41(7) | 0.472(21) | 186(8)(9) |
| 0.1575 | 24 | 0.84(1.33) | 44(7) | 0.479(20) | 189(8)(10) |
| 0.1580 | 24 | 1.92(1.01) | 31(12) | 0.465(44) | 183(17)(9) |
| quenched | 16 | -0.68(33) | 80(14) | 0.505(22) | 199(9)(10) |
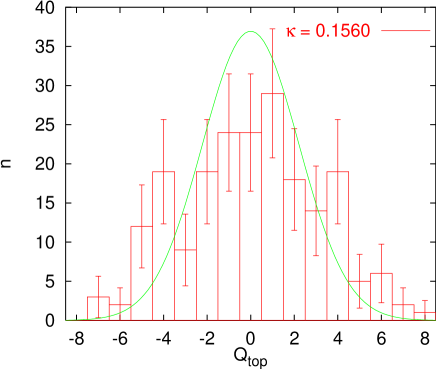
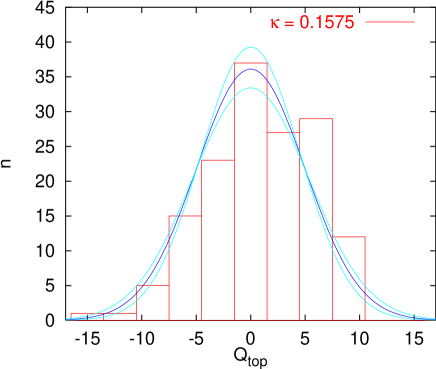
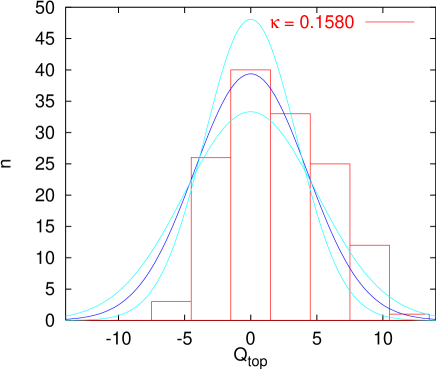
The fitted topological susceptibilities as well as are displayed in Table III. For orientation, we convert into physical units in the last column of the table, using MeV. The distribution at is not symmetric around zero anymore, as reflected by the value and by Fig. 11. Therefore, in this case, the resulting value of should pass with a grain of doubt, notwithstanding the comfortable error bars. A comparison between the and results at reveals that the level of finite size effects on is below the statistical errors.
The Gell-Mann-Oakes-Renner (GMOR) relation connects the pion mass to the chiral quark mass, , via the pion decay constant†††Our normalisation conventions are such that MeV. in the chiral limit and the chiral condensate, :
| (12) |
A direct lattice determination of from the appropriate current matrix element yields , in the limit [30]. Allowing for an additional systematic error of 10 % on to account for the fact that we have only determined the axial vector renormalization constants perturbatively, we arrive at the lattice estimate
| (13) |
at , using the value [21]. In combining Eq. (12) with Eq. (1) one expects‡‡‡This formula as well as the GMOR relation Eq. (12) only apply to since for no light pion exists (for a finite number of colours, ).
| (14) |
for small pseudoscalar masses and large Leutwyler-Smilga parameters, [31, 32].
| 0.1560 | 7.14(4) | |||
| 0.1565 | 6.39(6) | |||
| 0.1570 | 5.51(4) | |||
| 0.1575 | 4.50(5) | |||
| 0.1575 | 6.65(6) | |||
| 0.1580 | 4.77(7) |
In Table IV we display the spatial lattice extents, as well as and . We estimate the (scheme independent) combination that appears within from Eqs. (12) – (13). The topological charge fluctuations correspond to the average number of non-interacting instantons that can be accomodated within the simulated lattice volume [33, 34]. It has been argued [34] that is already a large volume in the Leutwyler-Smilga [31] sense, such that Eq. (14) should safely apply to all but the lattices at and . Even at the latter, more critical, -value, where we have two lattice volumes that correspond to and at our disposal, we do not find any volume dependence of .
In the regime of large one would expect in units of some reference scale like to approach the quenched value as a smooth function of . Prior to the comparison with Eq. (14) one should in principle extrapolate the lattice results on to the continuum limit, for instance along a trajectory of constant . Having only data at our disposal we cannot yet perform this extrapolation but conjecture that our results are already sufficiently close to the continuum limit for Eq. (14) to hold. This assumption is plausible in view of the fact that the topological charges obtained from the gluonic and fermionic definitions agree with each other reasonably well (with a renormalization constant of order one) and of our previous studies of light hadronic quantities [21, 30].
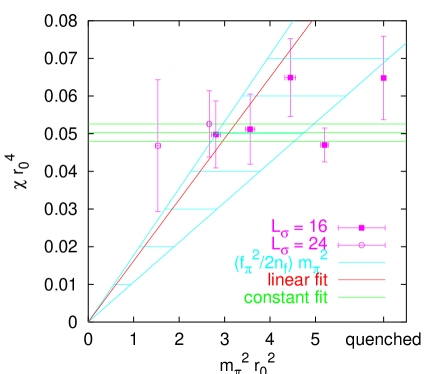
For the purpose of the present investigation we shall consider the dimensionless topological susceptibility, , as a function of the dimensionless combination in order to carry out the chiral extrapolation. The results are plotted in Fig. 12, together with the region that is allowed for by the leading order expectation, Eq. (14), for the value of Eq. (13). All unquenched data except for the point at the heaviest quark mass () are consistent with this expectation. Note that the most chiral data point stems from the run with which, as can be seen from Figs. 3 and 11, is not of sufficient statistical quality for the purpose of topological studies. The right-most entry in Fig. 12 is the result of our quenched reference study.
A linear fit, excluding the largest mass point, to the parametrisation (14) renders with . This value compares reasonably well with the expectation, Eq. (13). On the other hand our data are consistent with a mass independence of too: fitting them to a constant yields with , in agreement with the quenched reference point, .
Our present study is based on data obtained at a fixed value of and the quark mass is varied by just tuning . It is worthwhile to relate our findings to those recently presented by the UKQCD collaboration§§§Unfortunately, none of the other collaborations have converted their results into units of . [15] who simultaneously vary and to change the quark mass while keeping the lattice spacing fixed in units of . Apart from this they dispose of ensembles of gauge field configuration of comparable statistical sizes, using slightly coarser lattice spacings with an improved fermionic action.
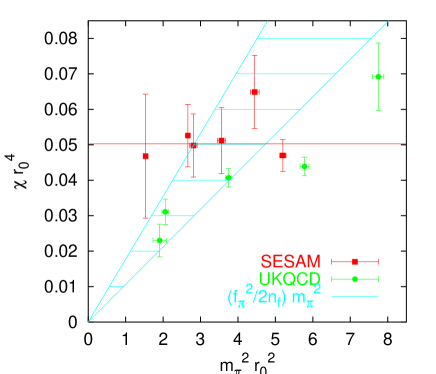
In order to facilitate this comparison we have superimposed both data sets¶¶¶The statistical errors quoted by the UKQCD collaboration are somewhat smaller than ours since no signs of autocorrelation effects have been found in their study [35]. in Fig. 13. The data do not clearly contradict each other, however, we are unable to confirm the decrease of the topological susceptibility that has been reported in Ref. [15], at pion masses within the range of present-day lattice simulations.
V Conclusions
We have demonstrated that Wilson fermions are suitable for lattice studies of topology related effects in the QCD vacuum. We have found agreement between the topological charge computed after cooling from the field strength tensor, , and the fermionic definition given by Smit and Vink with a renormalization constant of order one. The trace has been estimated from diagonal improved noisy sources. As the next step we plan to investigate correlations between the topological charge density distribution and eigenvectors of .
The topological susceptibility at has been found to be consistent with that of quenched studies at large sea quark masses. Our data at smaller mass values is consistent with the asymptotic slope in that is expected from our independently determined pion decay constant. However, we are unable to unambiguously confirm the decrease that has recently been reported by the UKQCD collaboration [15] with a different fermionic action. Results obtained by the CP-PACS collaboration [14] who cover a similar range of quark masses on somewhat coarser lattices do not clearly show this tendency either. We plan to clarify this issue in simulations at different values which will enable us to perform a continuum limit extrapolation, and at smaller sea quark masses.
Acknowledgements.
We thank S. Güsken and P. Überholz for their contributions at an earlier stage of this project. We gratefully acknowledge R. Burkhalter for detecting an important mistake in this article. Our European collaboration was funded by the EU network “Hadron Phenomenology from Lattice QCD” (HPRN-CT-2000-00145). G.B. received support from EU grant HPMF-CT-1999-00353 and PPARC grant PPA/G/O/1998/00559, N.E. from DFG grant Li 701/3-1. B.O. appreciates support from the DFG Graduiertenkolleg “Feldtheoretische und Numerische Methoden in der Statistischen und Elementarteilchenphysik”. The HMC productions were run on the APE100 systems at INFN Roma and NIC Zeuthen. We are grateful to our colleagues G. Martinelli and F. Rapuano for the fruitful TL-collaboration. Part of the physics evaluation has been carried out on the ALiCE cluster computer at Wuppertal University.REFERENCES
- [1] B. Allés, M. D’Elia, A. Di Giacomo and R. Kirchner, Phys. Rev. D58, 114506 (1998) [hep-lat/9711026].
- [2] S. Itoh, Y. Iwasaki and T. Yoshié, Phys. Rev. D36, 527 (1987).
- [3] R. Narayanan and P. Vranas, Nucl. Phys. B506, 373 (1997) [hep-lat/9702005].
- [4] M. Teper, Nucl. Phys. Proc. Suppl. 83, 146 (2000) [hep-lat/9909124].
- [5] B. Allés, M. D’Elia and A. Di Giacomo, Nucl. Phys. B494, 281 (1997) [hep-lat/9605013].
- [6] A. Hasenfratz and C. Nieter, Phys. Lett. B439, 366 (1998) [hep-lat/9806026].
- [7] M. Garcia Perez, O. Philipsen and I. Stamatescu, Nucl. Phys. B551, 293 (1999) [hep-lat/9812006].
- [8] E. Witten, Nucl. Phys. B156, 269 (1979); G. Veneziano, Nucl. Phys. B159, 213 (1979).
- [9] J. Smit and J. C. Vink, Phys. Lett. B194, 433 (1987).
- [10] H. Gausterer, J. Potvin, S. Sanielevici and P. Woit, Phys. Lett. B233, 439 (1989).
- [11] K. M. Bitar et al. [HEMCGC Collaboration], Phys. Rev. D44, 2090 (1991).
- [12] M. Müller-Preußker, in Proc. of the XXVI Int. Conf. on High Energy Physics, Dallas 1992, Ed. J.R. Sanford, AIP Conference Proceedings No. 272, 1545 (1993).
- [13] Y. Kuramashi, M. Fukugita, H. Mino, M. Okawa and A. Ukawa, Phys. Lett. B313, 425 (1993).
- [14] A. Ali Khan et al. [CP-PACS Collaboration], Nucl. Phys. Proc. Suppl. 83, 162 (2000) [hep-lat/9909045].
- [15] A. Hart and M. Teper, Nucl. Phys. Proc. Suppl. 83, 476 (2000) [hep-lat/9909072]; A. Hart [UKQCD Collaboration], hep-ph/0004180; A. Hart and M. Teper [UKQCD Collaboration], [hep-lat/0009008].
- [16] B. Allés, M. D’Elia and A. Di Giacomo, Phys. Lett. B483, 139 (2000) [hep-lat/0004020]; B. Allés, M. D’Elia and A. Di Giacomo, Nucl. Phys. Proc. Suppl. 83, 431 (2000) [hep-lat/9912012].
- [17] A. Hasenfratz, Phys. Lett. B 476, 188 (2000) [hep-lat/9912053].
- [18] M. Garcia Perez, Nucl. Phys. Proc. Suppl. 94, 27 (2001) [hep-lat/0011026].
- [19] B. Allés et al. [TL Collaboration], Phys. Rev. D58, 071503 (1998) [hep-lat/9803008]; T. Lippert et al. [SESAM and TL Collaborations], Nucl. Phys. Proc. Suppl. 73, 521 (1999) [hep-lat/9809034]; T. Lippert et al. [SESAM Collaboration], Nucl. Phys. Proc. Suppl. 63, 946 (1998) [hep-lat/9712020].
- [20] B. Orth et al. [SESAM and TL Collaborations], in preparation.
- [21] G. S. Bali et al. [SESAM and TL Collaborations], Phys. Rev. D62, 054503 (2000) [hep-lat/0003012].
- [22] T. Lippert et al. [SESAM and TL Collaborations], in preparation.
- [23] P. Di Vecchia, K. Fabricius, G. C. Rossi and G. Veneziano, Nucl. Phys. B192, 392 (1981); P. Di Vecchia, K. Fabricius, G. C. Rossi and G. Veneziano, Phys. Lett. B108, 323 (1982).
- [24] B. Berg, Phys. Lett. B104, 475 (1981).
- [25] M. Teper, Phys. Lett. B162, 357 (1985).
- [26] J. Smit and J. C. Vink, Nucl. Phys. B286, 485 (1987).
- [27] J. Viehoff [SESAM Collaboration], Nucl. Phys. Proc. Suppl. 73, 856 (1999) [hep-lat/9809073].; J. Viehoff et al. [SESAM Collaboration], Nucl. Phys. Proc. Suppl. 63, 269 (1998) [hep-lat/9710050].
- [28] T. Struckmann et al. [SESAM and TL Collaborations], Phys. Rev. D 63, 074503 (2001) [hep-lat/0010005].
- [29] E. M. Ilgenfritz, B. V. Martemyanov, S. V. Molodtsov, M. Müller-Preußker and Y. A. Simonov, Phys. Rev. D58, 114508 (1998) [hep-ph/9712523].
- [30] N. Eicker et al. [SESAM collaboration], Phys. Rev. D59, 014509 (1999) [hep-lat/9806027].
- [31] H. Leutwyler and A. Smilga, Phys. Rev. D 46, 5607 (1992).
- [32] S. Dürr, Nucl. Phys. B 594, 420 (2001) [hep-lat/0008022].
- [33] T. Schäfer and E. V. Shuryak, Rev. Mod. Phys. 70, 323 (1998) [hep-ph/9610451].
- [34] S. Dürr, hep-lat/0103011.
- [35] A. Hart, private communication.