GLAS-PPE/1999–13September 1999
Results on the analysis of the hadronic final state in neutral current deep inelastic scattering at HERA are presented; recent results on inclusive single particle distributions, particle correlations and event shapes are highlighted.
Invited talk at the Ringberg workshop:“New Trends in HERA Physics”
Tegernsee, Germany, 1999
1 DIS kinematics
The event kinematics of deep inelastic scattering, DIS, are determined by the negative square of the four-momentum transfer at the lepton vertex, , and the Bjorken scaling variable, , where is the four-momentum of the proton. In the quark parton model (QPM), the interacting quark from the proton carries the four-momentum . The variable , the fractional energy transfer to the proton in the proton rest frame, is related to and by , where is the positron-proton centre of mass energy.
Neutral current (NC) DIS occurs when an uncharged boson () is exchanged between the lepton and proton. In QPM there is a 1+1 parton configuration which consists of a single struck quark and the proton remnant, denoted by “+1”. At HERA energies there are significant higher-order quantum chromodynamic (QCD) corrections: to leading order in the strong coupling constant, these are QCD-Compton scattering (QCDC), where a gluon is radiated by the scattered quark and boson-gluon-fusion (BGF), where the virtual boson and a gluon fuse to form a quark-antiquark pair. Both processes have 2+1 partons in the final state. There also exists calculations for the higher, next-to-leading (NLO) processes.
A natural frame in which to study the dynamics of the hadronic final state in DIS is the Breit frame [1]. In this frame, the exchanged virtual boson () is completely space-like and has a four-momentum , where is the momentum of the proton in the Breit frame. The particles produced in the interaction can be assigned to one of two regions: the current region if their -momentum in the Breit frame is negative, and the target region if their -momentum is positive. The main advantage of this frame is that it gives a maximal separation of the incoming and outgoing partons in the QPM. In this model the maximum momentum a particle can have in the current region is while in the target region the maximum is In the Breit frame, unlike the hadronic centre of mass () frame, the two regions are asymmetric, particularly at low where the target region occupies most of the available phase space.
2 Current Fragmentation Region
The current region in the Breit frame is analogous to a single hemisphere of annihilation. In annihilation the two quarks are produced with equal and opposite momenta, The fragmentation of these quarks can be compared to that of the quark struck from the proton; this quark has an outgoing momentum in the Breit frame. In the direction of this struck quark the scaled momentum spectra of the particles, expressed in terms of are expected to have a dependence on similar to that observed in annihilation [2, 3, 4] at energy
2.1 Evolution of Distributions
Within the framework of the modified leading log approximation (MLLA) there are predictions of how the higher order moments of the parton momentum spectra should evolve with the energy scale [5, 6]. These parton level predictions in practice depend on two free parameters, a running strong coupling, governed by a QCD scale and an energy cut-off, below which the parton evolution is truncated. In this case is an effective scale parameter and is not to be identified with the standard QCD scale, e.g. . In particular, predictions can be made at yielding the so-called limiting spectrum. The hypothesis of local parton hadron duality (LPHD) [7], which relates the observed hadron distributions to the calculated parton distributions via a constant of proportionality, is used in conjunction with the parton predictions of the MLLA to allow the calculation to be directly compared to data.

The moments of the distributions have been investigated up to the 4th order [8]; the mean width skewness and kurtosis were extracted from each distribution by fitting a distorted Gaussian of the following form:
| (1) |
where over a range of units (for ) or units (for ) in around the mean. The equation is motivated by the expression used for the MLLA predictions of the spectra [5].
Figure 1 shows the moments of the spectra as a function of It is evident that the mean and width increase with increasing whereas the skewness and kurtosis decrease. Similar fits performed on data [9] show a reasonable agreement with our results, consistent with the universality of fragmentation for this distribution at large .
The data are compared to the MLLA predictions of Ref. [6], using a value of for different values of A comparison is also made with the predictions of Ref. [5] for the limiting spectrum (). The MLLA predictions of the limiting spectrum in Ref. [6] describe the mean well. However both of the MLLA calculations predict a negative skewness which tends towards zero with increasing in the case of the limiting spectra. This is contrary to the measurements. The qualitative description of the behaviour of the skewness with can be achieved for a truncated cascade (), but a consistent description of the mean, width, skewness and kurtosis cannot be achieved.
It can be concluded that the MLLA predictions, assuming LPHD, do not describe the data. It should be noted however that a moments analysis has been performed [10], taking into account the limitations of the massless assumptions of the MLLA predictions; this yields good agreement between the limiting case of the MLLA [6] and data over a large energy range,
2.2 Evolution of the Distributions
Scaling violations are predicted in the fragmentation functions, which represent the probability for a parton to fragment into a particular hadron carrying a given fraction of the parton’s energy. Fragmentation functions, like parton densities, cannot be calculated in perturbative QCD but can be evolved with the hard-process scale, using the DGLAP evolution [11] equations, from a starting distribution at a defined energy scale; this starting distribution can be derived from a fit to data. If the fragmentation functions are combined with the cross sections for the inclusive production of each parton type in the given physical process, predictions can be made for scaling violations, expressed as the evolution of the spectra of final state hadrons [12]. The NLO calculations (CYCLOPS) [13] of the scaled momentum distribution exist for DIS.
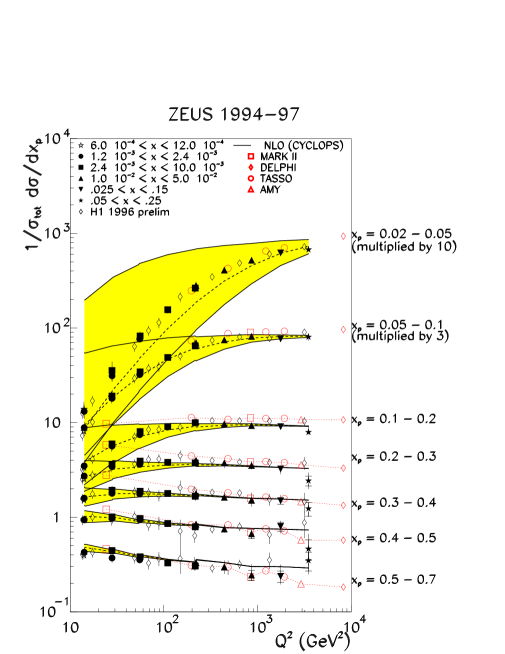
The inclusive charged particle distribution, , in the current fragmentation region of the Breit frame is shown in bins of and in Fig. 2. The ZEUS [8] and H1 [14] data are in good agreement. The fall-off as increases for (corresponding to the production of more particles with a smaller fractional momentum) is indicative of scaling violations in the fragmentation function. The distributions rise with for and are discussed in more detail below. The data are compared to data [15] (divided by two to account for the production of a pair) at For the higher values shown there is a good agreement between the measurements in the current region of the Breit frame in DIS and the results; this again supports the universality of fragmentation. The fall-off observed in the HERA data at low and low is greater than that observed in data at SPEAR [16]; this can be attributed to processes not present in (e.g. scattering off a sea quark and/or boson gluon fusion (BGF)) which depopulate the current region [17, 18].
A kinematic correction has recently been suggested [19] to the NLO calculation [13] of the inclusive charged particle distribution which has the form, where is an effective mass to account for the massless assumption used in the fragmentation functions. It is expected to lie in the range The data are compared to the CYCLOPS NLO QCD calculation incorporating this correction in Fig. 2. This calculation combines a full next-to-leading order matrix element with the parton densities (with and NLO fragmentation functions derived from fits to data [20]. The kinematic correction allows a more legitimate theoretical comparison to lower and than was possible in earlier publications [21]. The bands represent the uncertainty in the predictions by taking the extreme cases of and These uncertainties are large at low and low becoming smaller as and increase. Within these theoretical uncertainties there is good agreement throughout the selected kinematic range. ZEUS found the kinematic correction describes the general trend of the data but it was not possible to achieve a good fit for over the whole and range. In contrast H1 reported at DIS’99 [14] that a good description of the data could be achieved with a value of The dashed line shows the ZEUS NLO calculation from CYCLOPS multiplied by the kinematic correction using There is not a good description of the data, therefore it is concluded the distribution also depends strongly on the parameters used to generate the NLO predictions. The uncertainties introduced by this kinematic correction restrict to high and high the kinematic range that may be used to extract from the observed scaling violations.
3 Target Fragmentation
DIS at low allows a study of fragmentation in the target region following the initial scattering off a sea quark (or antiquark). The description based on MLLA [22] is shown schematically in Fig. 3, where the quark box at the top of the gluon ladder represents the scattered sea quark plus its antiquark partner. The MLLA predictions are made up of a number of contributions. Contribution C, the top leg of the quark box, corresponds to fragmentation of the outgoing quark in the current region. Three further contributions (T1, T2 and T3), which are sources of soft gluons, are considered in these analytical calculations to be associated with the target region. It is predicted [22] that the contribution T1( the bottom leg of the quark box) behaves in the same way as the current quark C and so should have no dependence. The contribution T2 is due to the colour field between the remnant and the struck quark, and the contribution T3 corresponds to the fragmentation of the rungs in the gluon ladder. Both T2 and T3 are predicted to have and dependences which differ from T1. Both the T1 and T2 contributions have been calculated and give particles of momenta The collinear gluons T3, on the other hand, generally fragment to particles with momentum For values of the scaled momentum the region of phase space is analogous to the current region and has contributions mainly from T1 and T2. The parton momentum spectra predicted by MLLA, over a range of and are shown in more detail in Ref. [3]. In the target region these spectra are approximately Gaussian for ; they peak at a value of in the range of and measured by ZEUS [8], falling to a plateau region for (the maximum value of in the target region).


The distributions in are shown for both the target and current regions in Fig. 4. The fitted curves shown are two-piece normal distributions [23] to guide the eye. In contrast to the current region, the target region distribution does not fall to zero as tends to zero. Although the magnitude of the single particle density at the peak position of the current region distribution grows by a factor of about three over the range shown, the single particle density of the target distribution, at the value corresponding to the peak of the current distribution (contribution C is equivalent to contribution T1), depends less strongly on and increases by only about . In addition the distribution shows no significant dependence on when is kept constant. In the target region the peak position of the distribution increases more rapidly with than in the current region; this is consistent with the behaviour expected from cylindrical phase space. The approximate Gaussian distribution of the MLLA predictions peaking at [3] is not observed. The results strongly suggest that the target distributions are inconsistent with the MLLA predictions when used in conjunction with LPHD.
4 Rapidity Distributions
There are predictions, based on LPHD, for the rapidity distribution of charged particles in the Breit frame [24]. (Rapidity is defined as where is the energy of the particle and is the longitudinal component of its momentum.) It is predicted that there is a sharp rise in the charged particle density followed by a plateau with a width proportional to as one moves from the current to the target fragmentation region. It is also predicted that there will be another increase in the particle density and an appearance of a second plateau, with the ratio of the two plateaux being This ratio reflects the change in colour charge from a dominant quark one, in the current region, to the dominant gluonic one in the target fragmentation region.


The rapidity distributions for charged particles are shown in Fig. 5 [14]. A flat plateau is observed at low transverse momentum, As increases , QCD effects gradually evolve the flat plateau into an approximate Gaussian, peaking near zero. This illustrates the nature of the Breit frame in separating the current and target fragmentation region. The expected step between the current and target region of the rapidity spectra is not observed. Also shown in Fig. 5 is a comparsion of the data with predictions from LO Monte Carlo models. In general the data is well described. ARIADNE [25] agrees well with the data but LEPTO [26] has problems in describing the high data and the introduction of soft colour interactions [27] destroys the agreement with the data.
5 Current-Target Correlations
The correlation coefficient :
| (2) |
is used to measure the dependence between charged particle production in the current region, and production in the target region, where and are the standard deviations of the multiplicity distributions in the current and target regions respectively. For positive correlations, is positive whilst for anti-correlations it is negative. At low these correlations are sensitive to the BGF process which depends on the gluon density of the proton [28].
Figure 6 shows the behaviour of the correlation coefficient as a function of the average values of and . Anti-correlations are observed for all values of and [29]. The magnitude of decreases with increasing from to . According to the analytic results of [28] these observed anti-correlations can be due to the effects (QCDC and BGF). The kinematics in the Breit frame can reduce the particle multiplicity in the current region and increase it in the target region. The magnitude of the anti-correlations increases with decreasing . According to [28] this can be due to an increase of the fraction of events with one or two jets produced in the target region. This behaviour is driven by an increase of the BGF rate, due to an increase in the gluon density inside the proton. These observations are, qualitatively, consistent with the depopulation effects discussed in section 2.2.
6 Event Shapes
The event shape dependence on can be due to the logarithmic change of the strong coupling constant , and/or power corrections (hadronisation effects) which are expected to behave like . Recent theoretical developments suggest that corrections are not necessarily related to hadronisation, but may instead be a universal soft gluon phenomenon associated with the behaviour of the running coupling at small momentum scales [31]. These non-perturbative corrections are governed by a parameter The scale dependence of any event shape mean can written as the sum of two terms: one associated with the perturbative contribution, and the other related to the power corrections, The perturbative contribution to an event shape can be calculated from NLO programs, such as DISENT [32].
At HERA a number of infrared-safe event-shape variables have been investigated [33]. Their definitions are given below, where the sums extend over all hadrons (being a calorimetric cluster in the detector or a parton in the QCD calculations) with four-momentum in the current hemisphere of the Breit frame. The current hemisphere axis coincides with the virtual boson direction.
-
•
Thrust
-
•
Thrust
-
•
Jet Broadening
-
•
Scaled Jet Mass
-
•
Parameter
with being the eigenvalues of the momentum tensor
Also investigated was the variable (over the whole of phase space). This variable represents the transition value for jets of the factorizable JADE jet algorithm for a particular event.
A common feature of all the mean event shape values is the fact that they exhibit a decrease with rising , Fig. 7. This is due to fact that the energy flow becomes more collimated along the event shape axis as increases, a phenomenon also observed in annihilation experiments.
A simple ansatz for the power correction would be However the fits using alone are poor and support the more detailed approach outlined in [31]. In this approach is parameterised as follows:
| (3) | |||||
where are constants dependent on the number of flavours, is a calculable coefficient dependent on the observable , is an ‘infra-red’ matching scale is a 2-loop correction (known as the Milano factor) and is an universal, non-perturbative effective strong coupling below
The results of the fit are shown in Fig. 8. The parameter is observed to be for all event shapes (except the jet rate parameter ) , consistent with theoretical expectation. However there is a large spread in the values of The theoretically calculated parameter for the power corrections for was . This is contrary to the observed need for small negative hadronisation corrections [33]. A reasonable fit for was achieved by using a value of The extended analysis of the mean event shapes in DIS are consistent with the application of power corrections according to [31] though there is still need for further understanding.
7 Summary
To understand the underlying QCD processes in DIS it is necessary to study the hadronic final state. At the current level of understanding, QCD works well and describes the HERA data. As the precision of the HERA data improves and the NLO QCD calculations become available the framework of QCD is being tested more thoroughly.
References
- [1] R. P. Feynman: Photon-Hadron Interactions. (Benjamin, New York 1972).
- [2] Yu. Dokshitzer et al.: Rev. Mod. Phys. 60, 373 (1988).
- [3] A. V. Anisovich et al.: Il Nuovo Cimento A 106, 547 (1993).
- [4] K. Charchuła: J. Phys. G19, 1587 (1993).
- [5] C. P. Fong and B. R. Webber: Phys. Lett. B 229 289 (1989); C. P. Fong and B. R. Webber: Nucl. Phys. B 355 54 (1991).
- [6] Yu. Dokshitzer, V. Khoze and S. Troyan: Int. J. Mod. Phys. A 7 1875 (1992).
- [7] Ya. Azimov et al.: Z. Phys. C 27 65 (1985) .
- [8] ZEUS Collab., J. Breitweg et al.: DESY–99–041, to appear in Eur. Phys. J. C.
- [9] OPAL Collab., M.Akrway et al.: Phys. Lett. B 247 617 (1990); TASSO Collab., W. Braunschweig et al.: Z. Phys. C 47 187 (1990); TASSO Collab., W. Braunschweig et al.: Z. Phys. C 22 307 (1984); TOPAZ Collab., R. Itoh et al.: Phys. Lett. B 345 335 (1995).
- [10] S. Lupia and W. Ochs: Eur. Phys. J. C 2 307 (1998).
- [11] V.N. Gribov and L.N. Lipatov: Sov. J. Nucl. Phys. 15 438 and 675 (1972); Yu.L. Dokshitzer: Sov. Phys. JETP 46 641 (1977); G. Altarelli and G. Parisi: Nucl. Phys. B 126 298 (1977).
-
[12]
G. Altarelli et al.: Nucl. Phys. B 160 301
(1979);
P. Nason and B. R. Webber: Nucl. Phys. B 421 473 (1994). - [13] D. Graudenz, CERN–TH/96–52; D. Graudenz, CYCLOPS program and private communication.
- [14] D. Kant: ‘Fragmentation functions and rapidity spectra in the Breit frame at H1’, to appear in the proceedings of DIS’99, Nucl. Phys. B(Proc. Suppl.) 79 (1999).
- [15] TASSO Collab., W. Braunschweig et al.: Z. Phys. C 47 187 (1990); MARK II Collab., A. Petersen et al.: Phys. Rev. D 37 1 (1988); AMY Collab., Y. K. Li et al.: Phys. Rev. D 41 (1990) 2675 (1990); DELPHI Collab., P. Abreu et al.: Phys. Lett. B 311, 408 (1993).
- [16] MARK II Collab., J. F. Patrick et al.: Phys. Rev. Lett. 49 1232 (1982).
- [17] K.H. Streng, T.F. Walsh and P.M. Zerwas: Z. Phys. C 2 237 (1979).
- [18] ZEUS Collab., M. Derrick et al.: Phys. Lett. B 338 (1994) (1994).
- [19] Yu. Dokshitzer and B. R. Webber, discussion at Third UK Phenomenology Workshop on HERA Physics, Durham, UK, 20-25 Sept 1998.
- [20] J. Binnewies et al.: Z. Phys. C 65 471 (1995).
- [21] ZEUS Collab., M. Derrick et al.: Phys. Lett. B 414 428 (1997); H1 Collab., C. Adloff et al., Nucl. Phys. B 504 3 (1997).
- [22] Yu. Dokshitzer et al.: Sov. Phys. JETP 68 1303 (1988).
- [23] Bank of England Quarterly Bulletin , February 1998, and references therein.
- [24] W. Ochs: ‘Recent Tests of Parton Hadron Duality in Multiparticle Final States.’. In:New Trends in HERA Physics, Tegernsee, Germany, May 25–30, 1997 ed. by B. Kniehl, G. Kramer and A. Wagner (World Scientific, 1998).
- [25] L.Lönnblad: Comp. Phys. Comm. 71 15 (1992).
- [26] G. Ingelman, A. Edin and J. Rathsman: Comp. Phys. Comm. 101 108 (1997).
- [27] A. Edin, G. Ingelman and J. Rathsman: Phys. Lett. B 366 371 (1996).
- [28] S. V. Chekanov: J. Phys. G 25 59 (1999).
- [29] ZEUS Collab., J. Breitweg et al.: DESY–99–063, submitted to Eur. Phys. J. C.
- [30] G. Marchesini et al.: Comp. Phys. Comm. 67 465 (1992).
- [31] Yu. Dokshitzser and B. R. Webber: Phys. Lett. B 352 451 (1995); B. R. Webber: ’Hadronic Final States’. In:DIS’95, 5th International workshop on Deep Inelastic Scattering, Paris, France, April 24–28, 1995, ed. by J.F. Laporte, Y. Sirois (Ecole Polytechnique, 1995).
- [32] S. Catani and M. H. Seymour: Nucl. Phys. B 485 291 (1997), erratum-ibid B 510 503 (1997).
- [33] K. Rabbertz: ‘Event shapes and power corrections in DIS ’, to appear in the proceedings of DIS’99, Nucl. Phys. B(Proc. Suppl.) 79 (1999).