Proceedings of the 1999 Lepton-Photon Symposium, Stanford, U.S.A.
Results on direct CP-violation from NA48
Giles Barr
NA48 Collaboration111Cagliari: V. Fanti, A. Lai, D. Marras, L. Musa;
Cambridge: A. Bevan, T. Gershon, B. Hay, R. Moore, K. Moore,
D. Munday, M. Needham, A. Parker, S. Takach, T. White, S. Wotton;
CERN: G. Barr, H. Blümer, G. Bocquet, J. Bremer,
A. Ceccucci, J. Cogan, D. Cundy, N. Doble, W. Funk, L. Gatignon,
A. Gianoli, A. Gonidec, G. Govi, P. Grafström, G. Kesseler,
W. Kubischta, A. Lacourt, S. Luitz, J.P. Matheys, A. Norton,
S. Palestini, B. Panzer-Steindel, B. Peyaud, D. Schinzel, H. Taureg,
M. Velasco, O. Vossnack, H. Wahl, G. Wirrer;
Dubna: A. Gaponenko, V. Kekelidze, D. Madigojine,
A. Mestvirishvili, Yu. Potrebenikov, G. Tatishvili, A. Tkatchev,
A. Zinchenko;
Edinburgh: L. Bertolotto, O. Boyle, I. Knowles, V. Martin,
H. Parsons, K. Peach, C. Talamonti
Ferrara: M. Contalbrigo, P. Dalpiaz, J. Duclos, A. Formica,
P.L. Frabetti, M. Martini, F. Petrucci, M. Savrié;
Florence: A. Bizzeti, M. Calvetti, G. Collazuol, G. Graziani,
E. Iacopini, M. Lenti, A. Michetti;
Mainz: H.G. Becker, P. Buchholz, D. Coward, C. Ebersberger,
H. Fox, A. Kalter, K. Kleinknecht, U. Koch, L. Köpke, B. Renk,
J. Scheidt, J. Schmidt, V. Schönharting, Y. Schué, R. Wilhelm,
M. Wittgen;
Orsay: J.C. Chollet, S. Crépé, L. Fayard,
L. Iconomidou-Fayard, J. Ocariz, G. Unal, D. Vattolo,
I. Wingerter-Seez;
Perugia: G. Anzivino, F. Bordacchini, P. Cenci, P. Lubrano,
A. Nappi, M. Pepe, M. Punturo;
Pisa: L. Bertanza, A. Bigi, P. Calafiura, R. Carosi,
R. Casali, C. Cerri, M. Cirilli, F. Costantini, R. Fantechi,
S. Giudici, B. Gorini, I. Mannelli, V. Marzulli, G. Pierazzini,
F. Raffaelli, M. Sozzi;
Saclay: J.B. Cheze, M. De Beer, P. Debu, R. Granier de
Cassagnac, P. Hristov, E. Mazzucato, S. Schanne, R. Turlay,
B. Vallage;
Siegen: I. Augustin, M. Bender, M. Holder, M. Ziolkowski;
Turin: R. Arcidiacono, C. Biino, R. Cester, F. Marchetto,
E. Menichetti, N. Pastrone;
Warsaw: J. Nassalski, E. Rondio, M. Szleper, W. Wislicki,
S. Wronka;
Vienna: H. Dibon, G. Fischer, M. Jeitler, M. Markytan,
I. Mikulec, G. Neuhofer, M. Pernicka, A. Taurok.
CERN, Geneva, Switzerland
1 Introduction
A long-standing question in high energy physics has been the origin of the phenomenon of CP violation. CP violation was first observed in the decay [1]. Effects have subsequently been found in [2], the charge asymmetry of () [3] and () [4], [5] and most recently in [6]. All of these effects can be explained by applying a single CP violating effect in the mixing between and which proceeds through the box Feynman diagram and are characterised by the parameter .
A second form of CP-violation with different characteristics can also be investigated in the decay of the neutral K-mesons. The kaon state (the ) can decay directly into a final state without first mixing into a kaon with . This is referred to as direct CP-violation, may proceed by the penguin Feynman diagram and is characterised by the parameter . The measured quantity is the double ratio of the decay widths, which, in the NA48 experiment is equivalent to the double ratio of four event-counts
A non-zero value of signals that direct CP violation exists.
CP-violating effects are also being searched for in the decays of B-mesons [7].
This talk describes the first results on from the NA48 experiment at CERN. More precise details of this measurement, in particular on the data selection and corrections have since been published in ref. [8].
The previous round of measurements on direct CP violation ended with some disagreement. The NA31 experiment at CERN published the first evidence for direct CP violation [9] and their final measured value was [10], while the E731 experiment at Fermilab measured [11] which is consistent with no effect. A new measurement of from the KTeV collaboration [12] is the subject of another talk at this conference [13].
2 Principle of the experiment
The measurement of proceeds by counting the number of decays from a beam into both and within a given energy range and fiducial region and counting the number of decays into the same modes from a beam in the same energy and fiducial region. These four numbers are then corrected for background, acceptance and the influence of uncorrelated activity in the detectors and are used to calculate as defined in equation (1). By collecting the data for both the and events simultaneously, the variation of the flux of particles cancels when inserting the numbers into (1).
To simplify the task of correcting for the influence of uncorrelated activity in the detectors, the data are collected with both the and beams switched on simultaneously. Most of the uncorrelated activity in the detectors originates from the beam, and so the rate of uncorrelated activity is, to a good approximation, the same at the time when either a or a decay occurs. This principle applies both for losses where the uncorrelated activity causes the reconstruction of the event to fail and also for cases where pile-up of signals in the detector cause trigger inefficiencies.
Similarly, the acceptance correction is simplified by arranging for the and events to both be collected with the same decay profile along the beam direction. By simply counting the events, the decays have a distribution characterised by an exponential decay corresponding to the lifetime of cm ( m), while the distribution is almost completely flat. Instead, in the NA48 analysis, a weight is applied to the events as a function of the measured decay position along the beam in order to give them the same exponential decay distribution as the . Consequently, the geometrical acceptance is very similar for and and the correction to the ratio cancels in the ratio in (1). The same principle is also applied to the decays.
The kaon beams are produced from a proton beam which strikes two targets, producing particles of different types and energies. The charged particles are swept away with a magnet and dumped leaving only a neutral beam containing , , , neutrons, photons and neutrinos which passes through the collimators. The kaons which are used for the measurement have energies between 70 and 170 GeV. The target is placed 120 m upstream of the fiducial region where the events are counted in order to let and decay. The target is placed as close as possible to the fiducial region, the gap which is needed for the sweeping magnet and charged particle dump is made as small as possible. This gap changes the energy spectrum due to Lorrenz contraction. This change is the same for and decays and so cancels in principle in (1). However, since the acceptance as a function of the kaon energy is different in the two modes, the analysis is done in 5 GeV wide bins of energy such that the product of the acceptance and the energy spectrum is constant across each energy bin and the cancellation of the energy spectra differences occurs in (1).
3 The experimental apparatus
As described above, the experiment consists of two beams of kaons, one from a target 120 m upstream for measuring decays (which must be of high intensity because CP violating decays are rare) and one from a target immediately in front of the fiducial region for measuring the decays (low intensity, since the decays predominantly to the two-body final states). This is followed by a detector system for measuring and final states and separating them from the large rate of background from three-body decays from the beam. In addition, a ‘tagging’ system is required in order to determine from which beam each decay occurred.
The kaon beams are both produced from 450 GeV protons from the slow extraction of the CERN super proton synchrotron (SPS), a burst lasting 2.4 s is produced every 14.4 s. The 200 MHz time structure from the accelerator is almost completely removed by debunching before the protons are extracted from the accelerator. The proton intensities on the and targets are and protons per burst respectively. The protons for the beam are derived from the protons which passed through the target without interacting. A small fraction of these are deflected by channelling using a bent crystal (to separate them from the debris from the target) and transported to the target. At the entrance to the fiducial region, the two beams are separated by 6.8 cm. The beam is tilted slightly so that the two beams converge with an angle of 0.6 mrad at the detector (This makes the detector illumination as similar as possible in the two modes).

The layout of the detector is shown in fig. 1. The events are measured in a liquid krypton electromagnetic (e.m.) calorimeter. The 13212 readout cells are in a tower arrangement so that the distribution of energy is measured by flash ADCs in a Cartesian grid of 2 cm 2 cm cells 25 ns. The calorimeter is calibrated with an electronic pulser and with electrons from events. The events are triggered by a second system of flash ADCs which measure the signals on summed readout cells whose output is fed into a digital computation pipeline. A trigger decision is generated every 25 ns based on a minimum total energy, a maximum proper decay time and the number of peaks. The events are detected in a charged particle spectrometer consisting of four multiwire drift chambers and a magnet with a horizontal momentum kick of 265 MeV/. The e.m. calorimeter and a set of three muon detectors are used for particle identification to distinguish and events respectively from the signal events. The triggering of the events occurs in several steps: the first level is based on hits in a pair of planes of scintillation counter hodoscopes in coincidence with an energy deposition in the calorimeters (a hadron calorimeter is located downstream of the LKr for this purpose); the second level is based on a reconstruction of the hits in the spectrometer to determine the kaon energy, kaon mass and proper decay time in an array of microprocessors. The beam pipe runs down the middle of all the detectors to allow the neutrons, photons and undecayed kaons to pass through the detector to a beam dump downstream.
The tagging to assign each measured decay to either the or beams is performed by determining whether or not a proton hit the target in coincidence with the decay. The event time of events is reconstructed from the hits in the hodoscope, the event time of events is reconstructed from the digitised pulse profiles for the LKr cells near the centre of each shower. A series of scintillation counters (the tagger) is installed along the path of the protons for the beam. If a coincidence ( ns window) between the event time and a proton reconstructed in the tagger occurs, the event is assigned to be a , otherwise it is assigned to be a . For events, the vertex resolution from the drift chambers is good enough to directly see from which target the kaon was produced (vertex tagging).
4 Analysis
The analysis is performed in twenty 5 GeV wide bins of kaon energy and the corrections are applied to each bin individually (except where indicated). The analysis proceeds by counting the number of candidate events in each of the four decay channels and applying the weights described above to the events to synthesise the exponential decay distribution of the events (-weighting).
Acceptance: Corrections are made for the small residual acceptance difference after the weighting which comes principally from the 0.6 mrad angular separation between the beams and the different beam divergences (0.15 mrad in and 0.375 mrad in ) leading to a total acceptance correction to of .
Energy scale and non-linearity: The decay position of the events must be reconstructed accurately on an absolute scale so that the definition of the fiducial region is precisely the same for charged and neutral events. The length of the fiducial region is defined in terms of the proper decay time and a cut is made at 3.5 where is the mean lifetime from the PDG [14]. This corresponds to 13.2 and 32.0 m at 70 and 170 Gev respectively. The decay position of events is determined from geometry. The decay position of events is determined from the energies and relative positions of the electromagnetic clusters and a shift in the energy scale will cause a corresponding shift in the decay vertex position and lead to an uncertainty on . A counter in the beamline (shown as AKS on figure 1) is used to veto kaon decays which decay upstream. This is used to define the start of the fiducial region in the mode and also provides a fiducial mark in the decay distribution (it marks the upstream end of the fiducial region) which is used to tune the energy scale factor. A single factor is used, common to all energy bins. This now sets the scale which is used to define the fiducial region in the beam, the position from which the -weighting starts and the end of the fiducial region in the mode.
Overall, the sensitivity of the result to the energy scale is low because of a cancellation in between a stretch of the fiducial region and the determination of the -weights from the reconstructed vertex position. Non-linearities in the response of the electromagnetic calorimeter also play a role in limiting the precision of the value of . The e.m.-calorimeter’s response as a function of energy is studied carefully with a variety of methods: electrons from decays, special runs in which a beam is introduced into the experiment and strikes a target at a known fixed location producing photons from , and and using the reconstructed masses in decays. The uncertainty in the value of from energy scale and non-linearity effects is .
Uncorrelated activity: A sampling of the uncorrelated activity in the detectors is obtained by triggering at a random instant in time but proportional to the intensity of the beams (random events), using counters near the beam dumps. The response of the detectors to the combination of a normal event and a random event is computed by adding the signals channel by channel and feeding the resulting event through the reconstruction program. These events have thereby artificially been given double the amount of uncorrelated activity and are used to compute the effect on leading to a correction of . (This correction is not applied to energy bins separately).
Backgrounds: The event samples are background subtracted. Background to events from and from decays is completely removed by the analysis cuts. A subtraction is performed in from and events from the beam by studying events with reconstructed masses adjacent to the kaon mass and events with a non-zero transverse momentum. This leads to a correction to of . The background in the mode comes exclusively from decays. A subtraction is made based on an extrapolation of events in which the four photons which were detected can be reconstructed to a mass which is close but not equal to the configuration. The extrapolation is done using a Monte-Carlo simulation leading to a correction to of . An additional correction to of is made for the loss of events which scatter on the beam collimator system and subsequently regenerate.
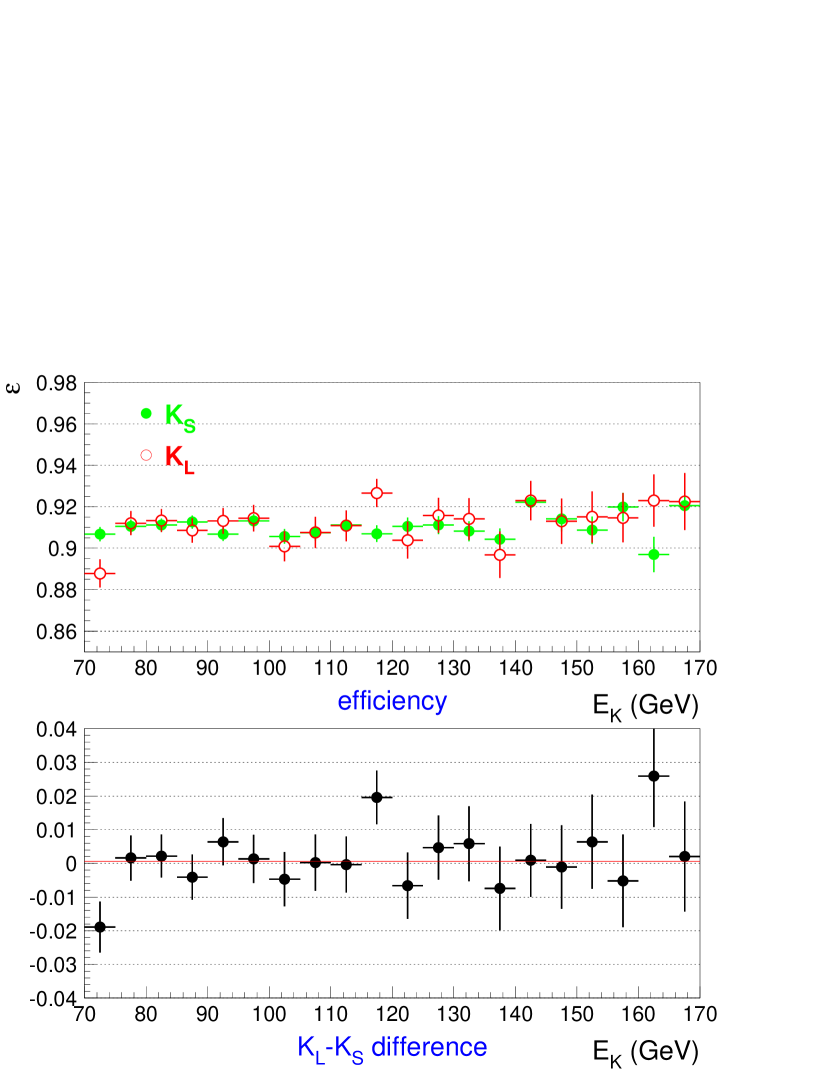
Trigger efficiencies: Trigger efficiencies were measured using independently triggered events which pass all the analysis cuts by counting how many did not have a positive response from the primary trigger. The inefficiency was very low () and no correction to was needed. The charged trigger inefficiency was (fig. 2) which was partially due to a timing misalignment in a part of the run. A correction to of is applied for the difference between the efficiency for and -weighted events.
Tagging: The tagging scheme described above is used to assign each event to be either or based on whether or not a proton is seen in the tagger in coincidence with the event. A conservative ns coincidence window is used which leads to a probability of erroneously failing to tag a real event ( measured in events with vertex tagged events). Tails in the event time determination which could lead to a difference in this probability between and events and thereby bias were excluded using events with Dalitz decays and photon conversions. The probability of accidentally associating a tagger hit with an event is . This is measured separately for and events by studying coincidence windows after artificially displacing the event time. The total correction of due to tagging is .
5 The result
| Tagging | |||
| trigger efficiency | |||
| background | |||
| background | |||
| Acceptance | |||
| Uncorrelated activity | |||
| Scattering/regeneration | |||
| Neutral scales and linearities | |||
| Charged vertex | |||
| Total correction |
A summary of the corrections and systematic errors is given in table 1. The sample used to compute contains events (accidentally associating a proton in the tagger with some of these decays means that we only positively identify as originating from the beam). The trigger was downscaled by a factor of two, ( events have approximately twice the branching ratio and twice the acceptance as events) and the sample contains decays. There are roughly twice the number of events in each of the decay modes. The values of the double ratio in each bin in kaon energy are shown in figure 3, after

trigger efficiency, tagging, background and acceptance corrections are included in each bin. The bins which are used in the analysis, between 70 and 170 GeV (decided prior to running the experiment), are shown with black symbols. The of the average is 25.7 (19 d.o.f.). Extensive checks have been made to exclude systematic biases which could lead to a variation of with the kaon energy as the data might suggest. As a further check, the double ratio was computed in three additional energy bins, as indicated in figure 3. These three extra points strongly disfavour the hypothesis of a linear trend in the data.
The result is which, using equation (1) leads to
| (2) |
The total error is , obtained by combining the statistical and systematic errors in quadrature. This measurement confirms is non-zero and therefore that direct CP violation occurs in neutral kaon decays.
6 Review of direct CP-violation in kaons
A comparison of the experimental measurements and theoretical predictions for are shown in figure 4. The
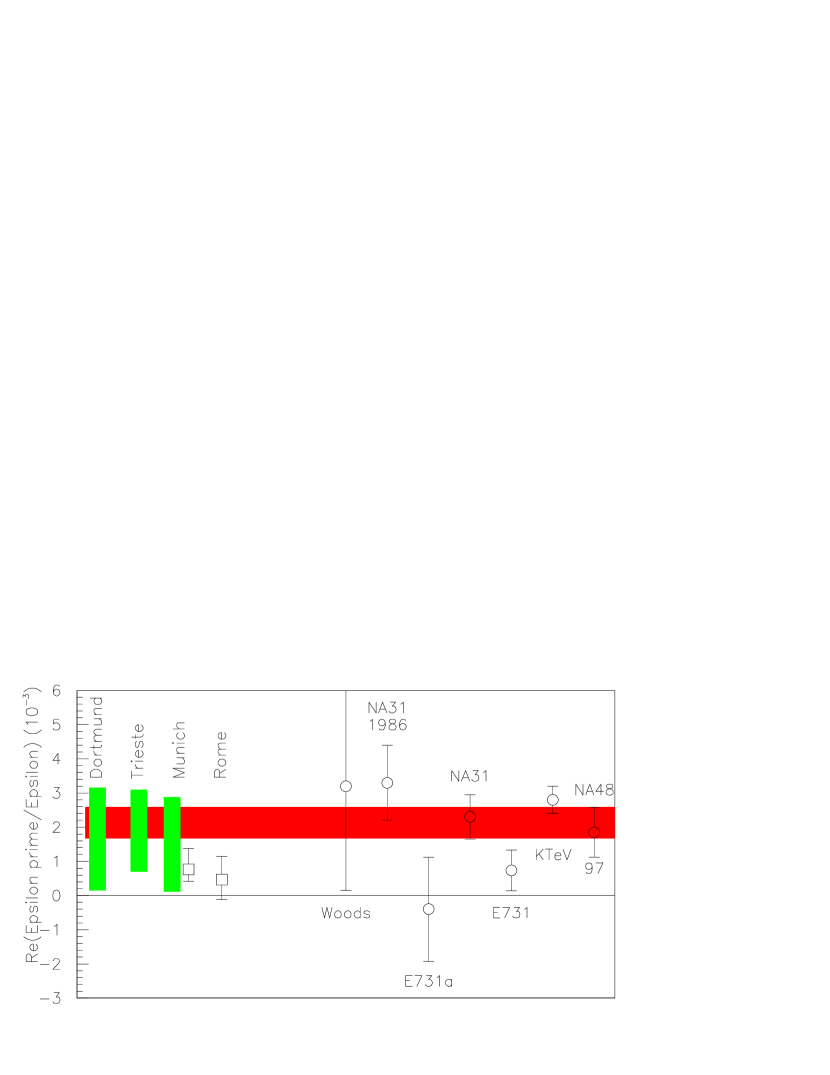
technique of all four experiments is to measure the number of decays of each of the four modes and using cancellations when inserting them into equation (1) wherever possible to reduce systematics. The experiments differ in their approaches to how to overcome the problem that the large difference in lifetime of the and mesons means that they have very different decay distributions in the experimental apparatus. The NA48 approach involving taking all four modes simultaneously and -weighting has been described above. E731 was the first experiment to take data with all four modes measured simultaneously (about 20% of their data sample), the rest was taken with separate runs for the two modes and for the two modes. KTeV collect all four modes simultaneously, although the data presented so far have also been with separate runs for the two modes and for the two modes. Both KTeV and E731 use Monte-Carlo simulation to correct the results for the different acceptances caused by the different decay distributions of the events. This technique maximises the statistics available for the measurement. NA31 used a somewhat different technique in which a -like decay distribution of decays was synthesised by moving the target up and down the fiducial region during the run. This required that the two modes were taken at different times from the two modes. A carefully designed experiment was used to avoid biases from different detector and trigger rates under the various beam conditions.
The theoretical predictions from the various groups [15, 16, 17, 18] are also shown on figure 4. The computation is decomposed into constituent pieces using a product-operator expansion and the different groups then use a variety of techniques to compute the individual contributions. The most difficulty is encountered in computing a contribution known as which corresponds to the gluonic penguin diagrams. Most of the computations find that the contributions destructively interfere to some extent to yield a prediction that epsilon prime is smaller than the measured value. However, one can choose values of the components which are each within the uncertainty of the computation and which combine to yield a value consistent with the measurements. A new computation, completed after the conference yields a large negative value of [19]. For a review of the theoretical status of epsilon prime see also [20].
7 Conclusions and outlook
The first results from the new round of experiments are confirming that the value is positive. The average value of is when the errors are scaled in the style of the particle data group [14]. Both NA48 and KTeV were running at the time of the conference and have collected large new datasets which are currently being analysed. The KLOE experiment at DANE is starting and will be able to provide a measurement [21]. Overall, the precision to which is known is set to increase dramatically in the coming years which will open up challenging new opportunities for theoretical predictions.
References
- [1] J.H. Christenson et al.,Phys. Rev. Lett. 13, 138 (1964).
-
[2]
M. Banner et al.,
Phys. Rev. Lett. 21 1103 (1968), ibid 1107.
I. Bugadov et al., Phys. Lett. 28B, 215 (1968). - [3] S. Bennett et al., Phys. Rev. Lett. 19, 993 (1967).
- [4] D.E. Dorfan et al., Phys. Rev. Lett. 19, 987 (1967).
- [5] E. Ramberg et al., Phys. Rev. Lett. 70, 2525 (1993) and ibid 2529.
-
[6]
A. Alavi-Harati et al.
[KTeV Collaboration],
Submitted to Phys. Rev. Lett.
hep-ex/9908020. - [7] Talks by K. Honscheid, F. Takasaki, J. Dorfan, M. Medinnis and M. Paulini in these proceedings.
-
[8]
V. Fanti et al.
[NA48 Collaboration],
Phys. Lett. B465, 335 (1999),
hep-ex/9909022, CERN/EP 99-114. - [9] H. Burkhardt et al. [NA31 Collaboration], Phys. Lett. B206, 169 (1988).
- [10] G.D. Barr et al. [NA31 Collaboration], Phys. Lett. B317, 233 (1993).
- [11] L.K. Gibbons et al. [E731 collaboration], Phys. Rev. Lett. 70, 1203 (1993).
- [12] A. Alavi-Harati et al. [KTeV Collaboration], Phys. Rev. Lett. 83, 22 (1999) hep-ex/9905060.
- [13] Talk by E. Blucher in these proceedings.
- [14] Particle Data Group, “Review of Particle Properties”, Eur. Phys. J. 3 1 (1998)
- [15] M. Ciuchini et al., Z. Phys. C68, 239 (1995) hep-ph/9501265.
- [16] A.J. Buras, M. Jamin and M.E. Lautenbacher, Phys. Lett. B389, 749 (1996) hep-ph/9608365.
- [17] S. Bertolini et al., Nucl. Phys. B514, 93 (1998).
- [18] T. Hambye et al., Phys. Rev. D58, 14017 (1998).
- [19] T. Blum et al., hep-lat/9908025.
- [20] Talk by S. Aoki in these proceedings, Talk by G. Buchalla at the Europhysics Conference, Tampere, Finland 1999, and also the proceedings of the Kaon99 conference in Chicago (1999) (in preparation).
- [21] Talk by S. Bertolucci in these proceedings.
Discussion
Michael Peskin (SLAC): It is unfortunately easy to overstate the precision in the theoretical prediction of . One of the longstanding problems in lattice gauge theory has been in finding the correct large-distance part of the enhancement in . The lattice gauge theory calculation of has similar difficulties and should be viewed skeptically. There are new methods in lattice gauge theory that promise to improve this situation, but results for from these methods are not yet available.