Charm Mixing and Rare Decays
Abstract:
There has been significant recent experimental activity on the related topics of charm mixing and rare (flavor changing neutral current) decay. For mixing, several new results from direct (wrong sign) searches and first results from lifetime difference () searches have been reported. Limits for of approximately (or better!) are possible from work in progress. For rare decays, sensitivities to branching ratios are now at the level of a few .
It was the absence of flavor changing neutral currents (FCNC) that led Glashow, Iliopoulos, and Maiani (GIM) to propose a suppression mechanism which required the existence of a fourth quark (charm) in 1970 [1]. GIM suppression works very well for charm: the short-distance standard model predictions for FCNC decays and mixing are extremely small. It is this suppression that makes searching for charm mixing and rare decays interesting: the distinctive signatures of these effects and the very small standard model expectations provide an opportunity to search for new physics.
1 Indirect Searches for New Physics
As a reminder of why GIM suppression works so well for charm, consider the box diagrams which represent the lowest order short-distance contribution to D0– mixing (figure 1). The mixing amplitude calculated from these diagrams is proportional to [2]:
| (1) |
where are the Cabibbo-Kobayashi-Maskawa (CKM) matrix elements. If the quark masses were all equal, the loop functions would all be equal and the amplitude would be zero due to the unitarity () of the CKM matrix. If the mass differences are small, GIM very nearly works and mixing is small.
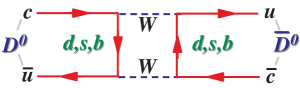
For charm, the CKM factor is insignificant ( in the Wolfenstein parameterization [3]) relative to the factors and (both ). Only the terms contribute in equation 1, and the mass difference between the and quarks is relatively small. The D0– mixing probability calculated from these box diagrams is [4]. By contrast, neutral quark mesons exhibit large mixing because the top mass is so large. For example, for the three CKM factors (, ) are roughly equal () so the contribution of the top quark dominates.
Because the short distance predictions for charm mixing are so small, long distance contributions may be important. They are more difficult to calculate, and there is significant disagreement over their size [5, 6, 7]. With long distance effects, may be as large as .
FCNC decays are also suppressed by the GIM mechanism. Even with long distance effects, the expected branching ratios for rare charm decays are in the range [7, 8].
If there is new physics such as a fourth generation of quarks, leptoquarks, etc., it can contribute to the box diagrams for mixing or the penguin diagrams for FCNC decays [9]. Because the standard model predictions are so small, there is a large window to observe the additional contributions of this new physics, unhidden by standard model effects. Using high statistics instead of high energy, one indirectly probes for new particle states which cannot be produced directly.
2 Charm Mixing 101
There are enough differences in the “nuts and bolts” of mixing for charm and beauty that it is useful to review the important points for charm.
2.1 Basic Charm Mixology
The neutral D mesons evolve according to:
Diagonalizing gives weak eigenstates
of definite mass and lifetime:
These eigenstates evolve with time as:
If conserves CP, then and are CP eigenstates and .
If you start with a D0, the probability that it is a at time is:
where and .
2.2 Search Strategies
There are two basic methods currently employed to search for charm mixing. In direct or “wrong sign” searches, one looks for , where is a Cabibbo favored (CF) mode such as or . The sign of the daughter K or distinguishes from D0. The produced D is identified using a D∗ tag: . The sign of the “bachelor” pion from the D∗ decay tags the produced neutral D as a D0 () or (). The signal for mixing is that the bachelor pion and the K daughter have the same charge: .
The second method is to look for a lifetime difference between and . If and are CP+ and CP- eigenstates, then:
| (7) |
The lifetimes and can be measured using neutral D decays to states of definite CP, such as (CP+) or (CP-). Even if one relaxes the “no CP violation” requirement, because it is known [16] that CP violation is small in charm decay and therefore and are approximately CP eigenstates.
2.3 The DCS Wrinkle
For wrong sign hadronic searches (, ,…) there is an interesting “wrinkle”. Because mixing is at best a small effect, doubly Cabibbo suppressed (DCS) decay cannot be ignored when looking for a wrong-sign signal [17, 18]. Via DCS, can occur directly and not just through mixing . In this case:
and the wrong sign decay rate becomes:
| (8) |
where
By measuring the proper time of the decay of the neutral meson, one can disentangle the contributions from DCS and mixing: while all terms in equation 8 share a common exponential time dependence, the mixing term () is proportional to , the DCS term () has no additional time dependence, and the interference term is proportional to .
The interference term is interesting: it may be observable even if the mixing term isn’t (in which case mixing would be observable in hadronic modes but not semileptonic!). Alternatively, if it has the opposite sign of the mixing term (destructive interference) and is of roughly equal size the effects of mixing could be masked [17]. Finally, this term could allow experimenters to distinguish between and contributions to mixing. This is especially true if CP violation in mixing is very small or zero (see section 2.4).
Note also that the CP conjugate rate for wrong sign decays is not the same as equation 8:
| (9) |
2.4 Simplifying Assumptions
The wrong sign rates of equations 8 and 9 can be simplified by making assumptions about the nature of CP violation. For example, it is likely that there is no direct CP violation in CF or DCS decays111For direct CP violation to appear in a decay mode, there must be two amplitudes that contribute significantly to that final state. and that CP is not violated in charm mixing [15], i.e.
| (10) |
If we assume both of the above then
| (11) |
Defining the strong (final state interaction) phase and the CP violating phase :
| (12) |
the wrong sign rates become:
| (13) |
If we assume CP invariance () then and:
| (14) |
where
| (15) |
If one has sufficient proper time resolution, equation 14 shows that the contributions due to and can be discriminated (assuming CP invariance).
2.5 Comments on Assumptions
There may be excellent theoretical motivation for the assumptions made in subsection 2.4. But, as demonstrated by E791 in their hadronic wrong sign search [13], there are no technical reasons for experimenters to make them. E791 first quoted mixing limits based on equations 8 and 9 (minimal assumptions). They then quoted limits after making the simplifying assumptions of equations 10 and 11, and finally for the case of no mixing (DCS only). This approach avoids two difficulties. First, if experimenters quote results based on only one set of assumptions, it can be difficult and misleading to compare results from different experiments (if past history is any guide, they are unlikely to make similar ones). Second, and more importantly, assumptions mask possibly interesting phenomena (assuming CP invariance precludes searching for CP violation in mixing).
The situation in searches is slightly different. There, one measures , and only if and are CP eigenstates. An observation of is evidence for mixing but extracting from this requires additional information.
3 Wrong Sign Mixing Searches
E791 and ALEPH have recently published results from wrong sign searches. CLEO and FOCUS have shown preliminary results from analyses in progress. E791 is the only one to present results in the most general case.
3.1 E791 Wrong Sign Searches
E791 at Fermilab is a fixed-target hadroproduction experiment. Using a 500 GeV beam and thin target foils, they logged hadronic interactions. Their spectrometer employed silicon microstrip detectors for vertexing, two threshold Cerenkov detectors for particle identification, a muon hodoscope and a lead/liquid scintillator electromagnetic detector for electron identification. They have published results for wrong sign searches using hadronic and semileptonic decay modes.
Their hadronic analysis [13] uses the CF decay modes and .

Figure 2 shows the right sign and wrong sign signals they obtain, where they have combined D0 and modes for the purpose of making the figure. In the plots, . There are 5643 and 3469 reconstructed signal events in the right sign and samples. In their analysis, they keep the D0 and samples separate, and perform a simultaneous binned maximum likelihood fit to each of the eight resulting data sets. The D0 mass and width and the peak and width are constrained to be the same in each data set, but most parameters (such as backgrounds) are uncoupled, leading to a 41 parameter fit in the most general case.
Making no assumptions about CP violation or mixing, E791 sets the following 90% CL limits:
| (16) |
Assuming CP violation only in the interference term (see equations 10 and 11), they find a 90% CL limit of:
| (17) |

If they assume no mixing, they find relative branching ratios (equation 12) for DCS modes:
| (18) |
The E791 semileptonic wrong sign search [12] uses the D0 decay modes and . The missing neutrino gives a two-fold ambiguity in the D0 momentum; based on Monte Carlo studies they pick the higher momentum solution. Fixing the D0 mass, they then fit the and proper time distributions. The right and wrong sign plots are shown in figure 3. The dotted lines show the estimate of the background they get using an event mixing technique (they combine D0 candidates from one event with a bachelor pion from another). In this analysis, E791 does not quote a “minimal assumption” result, instead they make the assumption of equation 10 from the outset and fit to a time dependence given by equation 4. The number of right sign decays they get from their fit is () and (). The mixing limit they obtain is:
| (19) |
3.2 ALEPH Wrong Sign Search

The ALEPH collaboration has used its sample of hadronic decays to search for mixing in D0K- [14]. The right sign and wrong sign mass plots they obtain are shown in figure 4. After carefully accounting for combinatoric and physics222Backgrounds that come from D0 decays with misidentified or missing daughters. backgrounds in these mass plots, they find and .
To set limits on mixing, they assume CP invariance. They parameterize the interference between mixing and DCS somewhat differently than equation 14. For the proper time dependence of they use:
| (20) |
They quote 95% CL limits on mixing for three values of :
| (21) | |||||
As noted in section 2.3, the sensitivity to mixing decreases dramatically if there is maximal destructive interference (). It is difficult to decide how to compare these limits to those from other experiments, given that they fix when extracting results and that the value of is not known experimentally.
ALEPH used the ratio of observed wrong sign and right sign events to measure:
| (22) |
If one makes the assumption of zero mixing, this is also a measurement of . ALEPH also quotes
which they get from their fit to equation 20 in the limit of zero interference () and with the constraint .
3.3 CLEO Wrong Sign Search
The CLEO collaboration has reported [20] preliminary results from a wrong sign search for mixing using data from fb-1 of integrated luminosity taken with the CLEO II.V detector. This analysis takes great advantage of the three layer, double-sided silicon vertex detector (SVX) they installed in 1995. In addition to giving CLEO the ability to measure the proper time of charm decays, the SVX greatly improves their measurement resolution of , the energy release in the D∗± decay used to tag the initial state of the neutral . This improved resolution enhances their sensitivity to mixing by increasing their signal to noise.
After cuts designed to suppress backgrounds from other D0 decays and “cross-talk” between their right-sign and wrong-sign samples, they obtain the mass and plots for wrong sign candidates shown in figure 5. Superimposed on the data (solid lines) in these plots are colored regions which show the contributions from backgrounds determined by a two-dimensional fit to and . The background shapes were determined from Monte Carlo. From their fit they find events in their wrong sign sample.
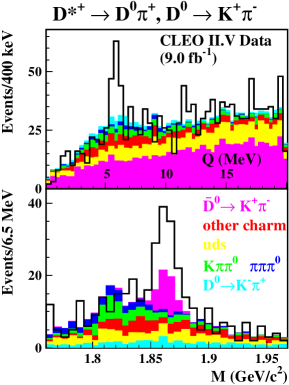
A similar fit to their right sign sample yields candidates. Using these numbers, they find
| (23) |
Using a time dependent fit to differentiate between mixing and DCS contributions (described below) they measure
CLEO has split its wrong sign sample into D0 and candidates and states that they see no evidence for a time-integrated CP asymmetry (the statistical error on this asymmetry is 0.19). They assume CP invariance and use the proper time distribution given by (14) in their fits. In this parameterization the interference term gives independent information on . From their fits, CLEO finds one-dimensional intervals at 95% CL of:
| (24) |
Systematic errors are included when finding the above intervals. It is not possible to determine the sign of from the fit, which depends only on . With this assumption of CP invariance, and if so that and , the above results give separate limits on the and contributions to mixing, an interesting and important result (particularly so given their excellent sensitivity).

3.4 FOCUS Wrong Sign Searches
The Fermilab photoproduction experiment FOCUS collected data in 1996–97. From this data, it has reconstructed 15 times more charm decays than its predecessor E687. Several improvements were also made to the spectrometer. The target was segmented so that more charm decays occur outside of the target (improves signal to noise). Vertex position resolution was significantly improved by the addition of silicon detector planes in the target region. Particle ID was significantly improved by the addition of a new lead glass electromagnetic calorimeter, two new muon systems, and significant improvements to the Cerenkov reconstruction code.
FOCUS is in the process of performing semileptonic and hadronic wrong sign searches. A mass difference () plot for their preliminary right sign semimuonic (D0K-) analysis is shown in figure 6. They model their background shape by combining reconstructed D0’s from one event with soft pions from another, and this background is normalized at large ( GeV/c2). Using 92% of their data, they find roughly 16500 background subtracted right sign candidates.
They get roughly equal numbers of events in the electron mode (D0K-). They are employing a “blind” analysis — they will not look in the wrong sign signal region until their cuts have been optimized and their backgrounds are understood. They will extract from a two dimensional fit to and . They predict a sensitivity by extrapolating from preliminary studies: if they observe precisely zero background subtracted events in their wrong sign signal region, their 90% CL limit on will be 0.12%.
FOCUS does not yet have a prediction for the sensitivity of their hadronic mode search. They have a large sample of reconstructed D∗ tagged D0decays, with approximately 150,000 D0K-, D0K-, and D0K- candidates. With this large sample and excellent proper time resolution they should be competitive with CLEO.
4 Lifetime Difference Searches
E791 has published results of a search for , while CLEO and FOCUS searches are in progress.
4.1 E791 Search
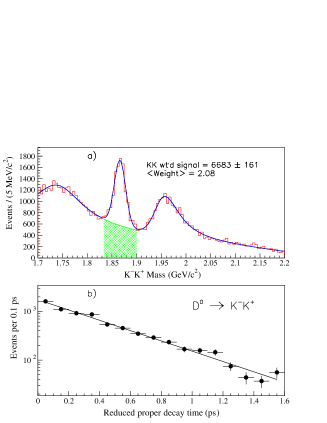
E791 searched [21] for a lifetime difference between the CP+ and CP- eigenstates of the D0. To do so, they compared the lifetimes of the decays D0K-K+ (CP+) and D0K- ( CP+ + CP-):
| (25) | |||||
The mass plot for the K-K+ candidates used in their analysis is shown in figure 7, along with the reduced proper time distribution used to extract the lifetime for this decay mode. Their fit to the mass distribution includes Breit-Wigners to account for reflections from misidentified K- and K- decays. The dashed line in plot (b) of the figure shows the results of their lifetime fit333If , the proper time distribution for is not strictly exponential. Given the previous limits on , however, E791 notes [21] that an exponential is an excellent approximation given their resolution.. After cuts, they have signal events in K-K+ and in K-. They observe no difference in lifetimes, and quote:
| (26) |
4.2 CLEO Search
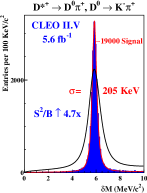
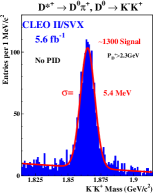
CLEO has shown very preliminary results on based on 5.6 fb-1 of the 9.1 fb-1 data sample they have collected with the CLEO II.V detector. They compare the lifetimes of D0K-K+ D0(both CP+) and D0K- to extract a measurement of via equation 25.
They measure the proper time of decays using only coordinate information:
(their beam spot has , ).
Based on samples of roughly K-K+, , and K- (figure 8) events they find:
| (27) |
With much more data to analyze, they believe their sensitivity will increase substantially.


4.3 FOCUS Search
FOCUS will also search for by comparing the lifetimes of the CP+ final states and to that of (equation 25). Mass plots for their candidates are shown in figure 9. By varying the identification cuts, they can control and study the reflection from observable at GeV/c2. This reflection does not overlap with the signal, and FOCUS includes a contribution from this reflection in its fits. Due to excellent proper time resolution (% of the D0 lifetime) the fractional error in their lifetime is equal to the fractional error in their yield. They expect a statistical error on of .
5 Rare Decay Searches
Just as for mixing, the GIM mechanism leads to a strong suppression of FCNC decays such as or , which have expected branching ratios in the range [7, 8]. Dilepton modes such as these have experimental advantages which make them well suited for sensitive searches: lepton identification is typically clean and efficient, and leptons are infrequent in charm events so that combinatoric backgrounds are minimal.
Dilepton modes that violate lepton flavor number (LFNV) or lepton number (LNV) such as and would be clear evidence for new physics and experiments typically look for these decays in addition to FCNC modes.
E791 has recently published results on searches for several FCNC, LFNV, and LNV modes. FOCUS has an analysis in progress and has shown predicted sensitivities.
5.1 E791 Rare Decay Search
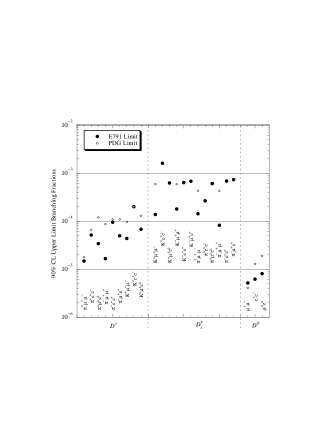
E791 performed a blind search [22] for 24 rare and forbidden modes. They find no evidence for any of them and set 90% CL upper limits on the number of events () they observe using the prescription of Feldman and Cousins [23]. They turn this into an upper limit on the branching ratio for each mode by using a normalizing mode:
| (28) |
where is detection efficiency. An important aspect of this method is the comparison to a normalizing mode. If this mode is similar to the mode of interest, many sources of systematic error cancel due to the ratio of detection efficiencies in equation 28. For example, for rare D+ decay modes, E791 uses . The branching fraction is taken from the Particle Data Book [24]. They incorporate systematic errors into their limits using the methods of Cousins and Highland [25].
The results of their searches are compared to previous limits in figure 10. In nearly all cases E791 is the first to report a limit or has significantly improved the previous limit.
5.2 FOCUS Rare Decay Search
The FOCUS experiment is in the early stages of its search for rare and forbidden dilepton modes. They are also doing a blind search, and so can only quote expected “sensitivities,” which they define as the limits they would set if the number of events in the signal region equals the predicted number of background events. Their analysis is very similar to that performed by E791. Currently their sensitivities for D+ modes are at the level, although this may improve.
6 Summary
It is very difficult to summarize the recent activity in experimental searches for charm mixing: there is little overlap in the assumptions made by experiments that have recently shown results. The best limits in the most general case (minimal assumptions) come from E791:
If one assumes , E791 also has the best published limit:
from a search using semileptonic decays.
Analyses in progress by CLEO and FOCUS are sensitive to (maybe lower).
First results from searches for a lifetime difference have recently been published by E791. They find at 90% CL. Since and are at least approximate CP eigenstates, . CLEO and FOCUS will push limits on to the few level in the very near future.
E791 has recently published limits on the branching ratios for 24 rare and forbidden decay modes. In nearly all cases their results are new or are a significant improvement over previous limits. Their limits on the branching ratios for D+ rare decays, for example, are at the level of a few . The rare decay search of the FOCUS collaboration is in progress, and they are sensitive to D+ branching ratios of a few .
It is interesting to note that can occur via The branching ratio for this decay is , which can be calculated from the known branching ratios for () and for () [24]. Experiments are getting tantalizingly close to seeing this, which could be used as a “calibration” point for experimental sensitivity.
Acknowledgments.
I would like to thank the local conference committee for organizing an interesting and productive meeting. Thanks also go to those members of the ALEPH, CLEO, E791, and FOCUS collaborations who provided me with information and plots relevant to their searches for charm mixing and rare decays.References
- [1] S. L. Glashow, J. Iliopoulos, and L. Maiani, Phys. Rev. D 2 (1970) 1285.
- [2] A. Pich, Nucl. Phys. 66 (Proc. Suppl.) (1998) 456 [hep-ph/9709441].
- [3] L. Wolfenstein, Phys. Rev. Lett. 51 (1983) 1945.
- [4] A. Datta and D. Kumbhakar, Z. Physik C 27 (1985) 515; H. Y. Cheng Phys. Rev. D 26 (1982) 143.
- [5] L. Wolfenstein, Phys. Lett. B 164 (1985) 170; J. Donoghue, E. Golowich, B. R. Holstein, and J. Trampetic, Phys. Rev. D 33 (1986) 179.
- [6] H. Georgi, Phys. Lett. B 297 (1992) 353 [hep-ph/9209291]; T. Ohl, G. Riccaiardi and E. Simmons, Nucl. Phys. B 403 (1993) 605 [hep-ph/9301212].
- [7] S. Pakvasa, Flavor Changing Neutral Currents in Charm Sector, hep-ph/9705397.
- [8] A. J. Schwartz, Mod. Phys. Lett. A 8 (1993) 967; P. Singer and D. X. Zhang, Phys. Rev. D 55 (1997) 1127 [hep-ph/9612495].
- [9] See for example: J. L. Hewett, T. Takeuchi, and S. Thomas, Indirect Probes for New Physics, hep-ph/9603391.
- [10] W. C. Louis, et al., E615 Collab., Phys. Rev. Lett. 56 (1986) 1027.
- [11] J. C. Anjos, et al., E691 Collab., Phys. Rev. Lett. 60 (1988) 1239.
- [12] E. M. Aitala, et al., E791 Collab., Phys. Rev. Lett. 77 (1996) 2384 [hep-ex/9606016].
- [13] E. M. Aitala, et al., E791 Collab., Phys. Rev. D 57 (1998) 13 [hep-ex/9608018].
- [14] R. Barate, et al., ALEPH Collab., Phys. Lett. B 436 (1998) 211 [hep-ex/9811021].
- [15] Y. Nir, Nuovo Cim. 109 A (1996) 991 [hep-ph/9507290].
- [16] P. L. Frabetti, et al., E687 Collab., Phys. Rev. D 50 (1994) 2953; J. Bartelt, et al., CLEO Collab., Phys. Rev. D 52 (1995) 4860; E. M. Aitala, et al., E791 Collab., Phys. Lett. B 403 (1997) 377 [hep-ex/9612005].
- [17] G. Blaylock, A. Seiden, and Y. Nir, Phys. Lett. B 355 (1995) 555 [hep-ph/9504306].
- [18] T.E. Browder and S. Pakvasa, Phys. Lett. B 383 (1996) 475 [hep-ph/9508362].
- [19] L. Wolfenstein, Phys. Rev. Lett. 75 (1995) 2460 [hep-ph/9505285].
- [20] M. Artuso, et al., CLEO Collab., Search for – Mixing, hep-ex/9908040.
- [21] E. M. Aitala, et al., E791 Collab., Phys. Rev. Lett. 83 (1999) 32 [hep-ex/9903012].
- [22] E. M. Aitala, et al., E791 Collab., Phys. Lett. B 462 (1999) 401 [hep-ex/9906045].
- [23] G. J. Feldman and R. D. Cousins, Phys. Rev. D 57 (1998) 3873.
- [24] C. Caso, et al., Particle Data Group, Eur. Phys. J. C 3 (1998) 1.
- [25] R. D. Cousins and V. L. Highland, Nucl. Inst. Meth. A 320 (1992) 331.