SLAC-PUB-8278
19-Nov-1999
Review of Mixing
Results***Work
supported by U.S. Department of Energy contract DE-AC03-76SF00515.
Mourad Daoudi
Stanford Linear Accelerator Center
Stanford, CA 94309
Abstract
A review of mixing results at the end of July
1999 is presented. Emphasis is put on recent measurements of
and . For , the new world average
is . For , the new
world average 95% CL limit is , with a sensitivity of
. Other related results are covered very
briefly.
Invited talk at 8th International Symposium on Heavy Flavour Physics
Southampton, UK, July 25–29, 1999
Review of Mixing Results
A review of mixing results at the end of July 1999 is presented. Emphasis is put on recent measurements of and . For , the new world average is . For , the new world average 95% CL limit is , with a sensitivity of . Other related results are covered very briefly.
1 Introduction
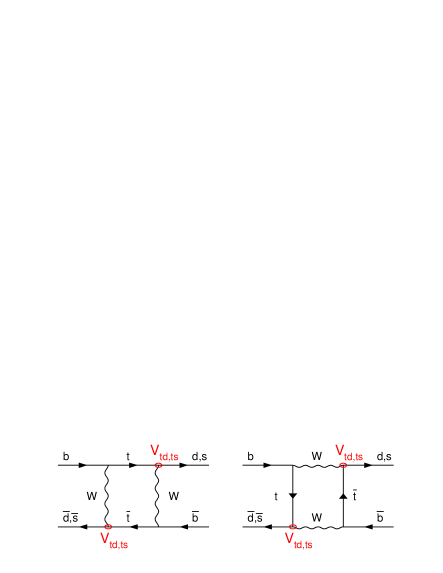
The main motivation for performing mixing measurements lies in the determination of the matrix element , which represents one of the constraints on the Unitarity Triangle.
is accessible experimentally through the box diagrams of figure 1, by measuring the mass difference in mixing.
and are related by:
Similarly mixing provides a measurement of .
While is measured with very good precision, the determination of is limited by theoretical uncertainties in the decay constant and the bag factor . However, in the ratio / most hadronic uncertainties cancel :
With , a precise measurement of both and provides a strong constraint on . This underlines the importance of mixing measurements.
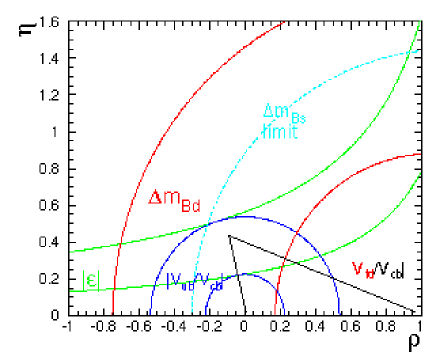
In the Wolfenstein parametrization the CKM matrix is defined by four parameters, two of which are quite well known, and , and two that are not well determined, and whose values define the apex of the Unitarity Triangle. In the -plane, is represented by a circle centered at (1,0). It provides one of three constrains on the Unitarity Triangle, the other two being and (figure 2). and are given by
in terms of , , , and . Note that, unlike , has no dependence on and . Therefore, a precise measurement of provides in essence a measure of the product .
Another important aspect is the fact that mixing is complementary to the violation related measurements that will be performed at factories in the near future. The measurements of and being essentially orthogonal, they will provide together an excellent constraint on the apex of the Unitarity Triangle in the system alone. Whereas, measurements of and alone will not be sufficient to provide as good a constraint.
Improvements in lattice calculations continue to be made. For the latest developments in the determination of the decay constant and the bag factor , see the talk by S. Hashimoto at this conference . Further details can be found in Refs. . It is generally accepted that the product lie in the range MeV.
1.1 Time-integrated mixing measurements
The probability that a meson mix into a or remain unmixed as a function of proper time is:
The time-integrated mixed fraction is given by:
At the where mesons are produced essentially at rest, can extracted from a measurement of . Because is large ( times larger than ), it can be obtained only in a time-dependent mixing measurement (), which makes it rather very challenging.
At the resonance, where all species are produced, a measurement of allows the extraction of , the fraction of quarks that hadronize into a .
1.2 Time-dependent mixing measurements
The requirements for a time-dependent mixing measurement are: 1) a precise reconstruction of the proper time of the meson, 2) a determination of the flavor or of the meson both at production (initial-state tag) and at decay (final-state tag).
A variety of initial-state tags are used, they fall in three categories: 1) vertex and jet charge, high-momentum lepton and kaon, in the opposite hemisphere, 2) fragmentation kaon or pion in the same hemisphere, 3) polarized forward-backward asymmetry. The latter is unique to SLD, it exploits the parity-violating coupling and the presence of a highly polarized electron beam at the SLC.
The most widely used final-state tag is the sign of a high- lepton. Other tags include, for example, the sign of a partially or fully reconstructed meson, and the dipole charge (see below).
2 productions fractions
The LEP B Oscillations Working Group has compiled a new value for . Furthermore, with the inclusion of recent measurements by CLEO and CDF, mentioned below, a new world average value for was derived: .
A measurement of the charged branching ratio made by DELPHI recently resulted in an increase of the production fraction: . While, the average -baryon production fraction has decreased slightly: . As a result, the new production fraction becomes:
This value is in good agreement with a separate determination using the measurement of the branching ratio which yields: The new value of is somewhat smaller compared to that evaluated a year ago at the ICHEP’98 conference: . This will have the effect of reducing one’s sensitivity to , compared to one’s previous estimate assuming a larger value of .
3 mixing measurements
Over the last year there have been two new measurements of : one from CLEO and the other from CDF.
The CLEO time-integrated measurement is based on a 4.2 Million event sample. The final-state flavor is tagged using the sign of a pion in the partially-reconstructed decay chain: , . The initial-state is tagged with a high-momentum lepton in the rest of the event. A value of is obtained, from which the following result for is extracted:
This result is competitive with those from LEP, CDF, and SLD obtained in time-dependent analyses.
At CDF, a new time-dependent measurement was performed . It consists of the reconstruction of a decaying to either a or a :
The sign of the tags the flavor of the at decay while its flavor at production is given by a high momentum lepton in the opposite hemisphere.
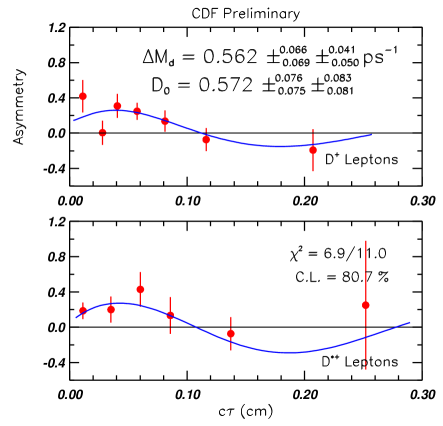
A nice feature of this analysis is the fact that is extracted from a maximum likelihood fit in which the tagging dilution factor () is also fitted. Effectively, the mistag rate is determined directly from the data. figure 3 shows the mixing asymmetry distribution as a function of proper time, for the and samples separately. The combined fit results in:
The value obtained from the fit for the dilution factor is: .
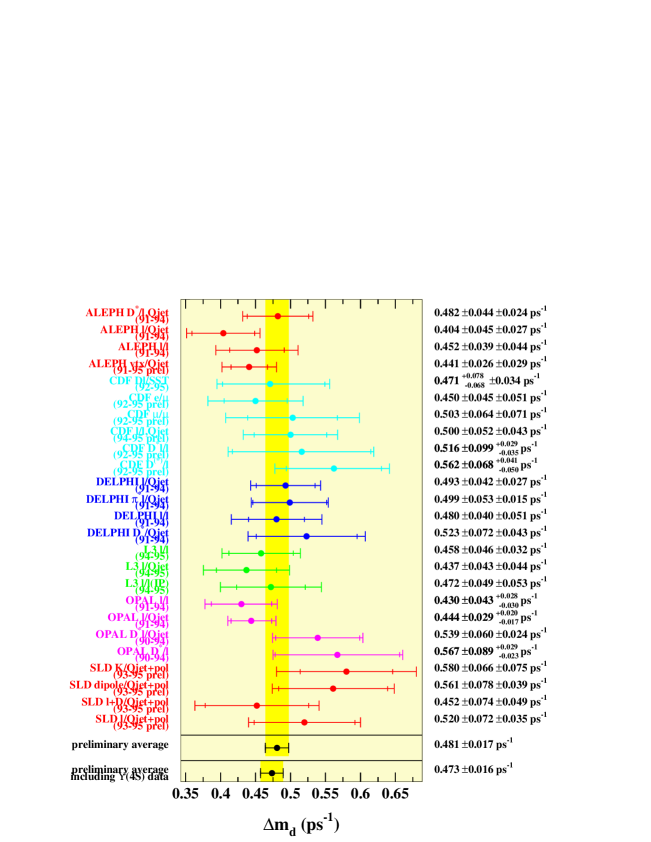
figure 4 contains a compilation of about 25 measurements of from the four LEP experiments, CLEO, CDF, and SLD, all very consistent with one another. The new world average value is :
Further improvements in mixing are expected from CLEO and SLD which have relatively large portions of data not yet analyzed.
4 mixing measurements
Over the last few years, a lot of efforts have been spent on mixing. Before reviewing some of the recent analyses, let us mention the first experimental limits on the ratio which provide indirect upper limits on . Unlike , recent calculations indicate that for the ratio is sizeable . Experimentally, the limits are derived by fitting in a -enriched sample the proper time distribution to a sum of two exponentials. The best limit comes from DELPHI :
Limits on were also set by L3 and CDF. Though the above limit does not provide a strong constraint on ( ps-1), future improvements are expected as additional and perhaps improved measurements are made.
Three ingredients are required for a measurement, besides a large data sample. They are a high enrichment (), a small mistag rate (), and a good proper time resolution (). This is illustrated by the following expression which gives the statistical significance to a signal :
is the total number of decays in the sample. The proper time resolution can be expressed as: , where is the decay length resolution and is the boost resolution. Clearly, for a large value of , all the sensitivity is at very short proper time, and the decay length resolution is the dominant term there.
A widely used approach to reconstruct a meson and tag its final-state flavor is to intersect a high- lepton with a downstream vertex which may be a fully- or partially-reconstructed meson. Sometimes the fraction in the sample is enhanced by requiring that a kaon or a meson be present in this vertex.
The extraction of a limit relies on the so-called Amplitude Fit method , where the term in the above expression for the time-dependent mixed probability is replaced by . Values of the amplitude parameter are scanned for each trial value of in a maximum likelihood fit. At the true mixing frequency, the amplitude , and is for all other values of . The 95% CL limit corresponds to the smallest value of for which the measured amplitude and its error satisfy the relation: . Similarly, the sensitivity of a given measurement corresponds to the smallest value of for which holds.
A total of eleven analyses have been performed by ALEPH, CDF, DELPHI, OPAL, and SLD. This summer, OPAL and DELPHI have produced updates on their mixing results. These are described below. For completeness, important results from other experiments are also reviewed.
4.1 ALEPH inclusive lepton analysis
This is the most sensitive mixing measurement to date . mesons are reconstructed as the intersection of a high- lepton and an inclusive vertex. The final-state flavor is given by the lepton sign, while the initial-state tag relies on vertex charge or a high-momentum lepton in the
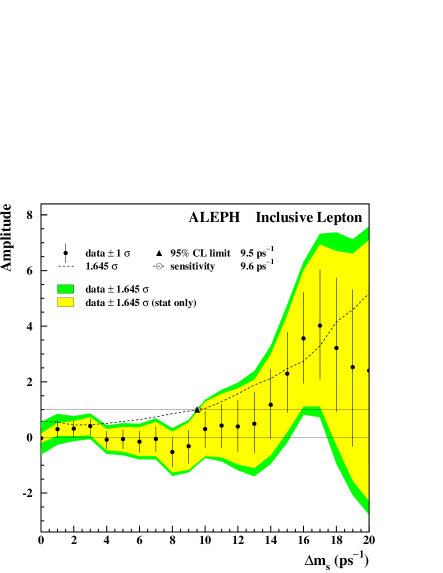
opposite hemisphere, or a fragmentation kaon in the decay hemisphere. A total of 33,023 decays are selected. The decay length resolution is modeled by a double-Gaussian distribution with a core (82%) m and a tail (18%) m. The relative boost resolution is estimated by in the core (72%) and in the tails (28%). figure 5 shows the amplitude vs. distribution obtained in this analysis. The derived limit is: ps-1 at 95% CL, with a sensitivity of ps-1. Combined with two other analyses ( and ), ALEPH’s sensitivity becomes and the overall limit is:
4.2 OPAL inclusive lepton update
OPAL uses a rather sophisticated technique to reconstruct in 3-D a vertex that contains a high- lepton . The final-state is tagged with the lepton sign, while the initial-state is given by either jet charge or a high- lepton in the opposite hemisphere. In this update, OPAL

included their 1995 data and made substantial improvements to their jet charge technique. The final analysis is based on 47,109 single-lepton and 6,031 di-lepton events. The amplitude vs. distribution is shown in figure 6. The sensitivity is and the limit is:
4.3 DELPHI exclusive and update
DELPHI has made the first attempt at an exclusive reconstruction . This approach has the advantage of an excellent proper time resolution, with the boost being determined exactly. The following decay channels are utilized:
where the and are reconstructed in 6 and 2 decay modes, respectively. From the full data sample corresponding to 3.6 Million hadronic ’s, 11 fully- and 33 partially-reconstructed decays are selected with a corresponding purity of 70% and 45%, respectively. With such a small efficiency this analysis by itself has no sensitivity to . However, because of its excellent proper time resolution it provides a non-negligible contribution at large values.
DELPHI choose to combine it with the more inclusive () analysis where 2953 candidates are selected with a purity of 40%. The overall sensitivity so obtained is and the 95% CL limit is .
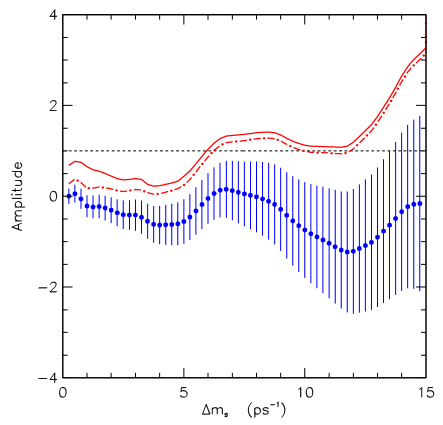
4.4 DELPHI update
This is overall the second most-sensitive mixing analysis . A total of 436 decays with a fully-reconstructed are selected in the decay modes . Another
441 candidates with a partially-reconstructed (missing ) are also selected. The content in the two sub-samples is estimated to be and ’s, respectively. Clearly, the sign provides the final-state tag, while a complex initial-state package including 9 discriminant variables gives the initial-state flavor with a 78% purity. The decay length resolution in this analysis is parametrized with a core (86%) Gaussian with m and a tail (14%) Gaussian with m. Whereas, the boost resolution is characterized by a relative residual in the core (78%) and in the tails (22%). The 95% CL limit extracted from this analysis is with a sensitivity of . This is illustrated by the amplitude vs. distribution shown in figure 7. The combined limit from all the DELPHI analyses is:
with an overall sensitivity of .
4.5 CDF analysis
Using their di-lepton trigger data, CDF perform a partial reconstruction of the in the decay chain . A sample of 1068 candidates is selected with a purity of 61%. A second high-momentum lepton in the opposite hemisphere tags the initial-state flavor.
This analysis results in a limit of:
and a sensitivity of , as shown by the amplitude distribution of figure 8.
4.6 SLD mixing results
Using a data sample equivalent to hadronic ’s, SLD has performed three mixing analyses, referred to as Lepton+D, Lepton+Tracks, and Dipole . The number of selected candidates in the three analyses is 2352, 8864, and 8211, respectively. In the first two, the final-state tag is provided by the high- lepton, while in the last one it is given by the dipole charge, defined as the charge difference between the tertiary and secondary vertices multiplied by the distance separating the two vertices.
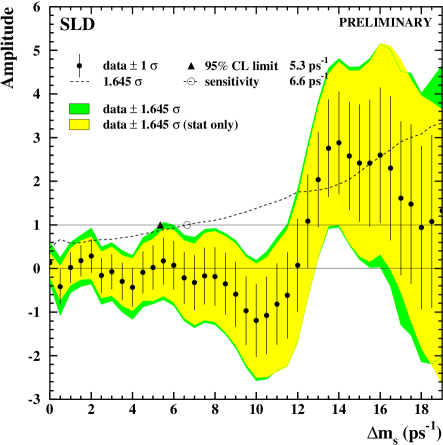
The initial-state tag is given primarily by the polarized forward backward asymmetry, and by jet charge, vertex charge, a high-momentum lepton or kaon in the opposite hemisphere. An excellent decay length resolution is achieved at SLD, characterized by a core (60%) Gaussian with m and a tail (40%) Gaussian with m. Good boost resolution is also realized: for the core (60%) and for the tails (40%). The combined amplitude distribution for the three analyses is shown in figure 9. An overall sensitivity of is obtained, and two separate intervals in are excluded at the 95% CL:
4.7 Summary of results
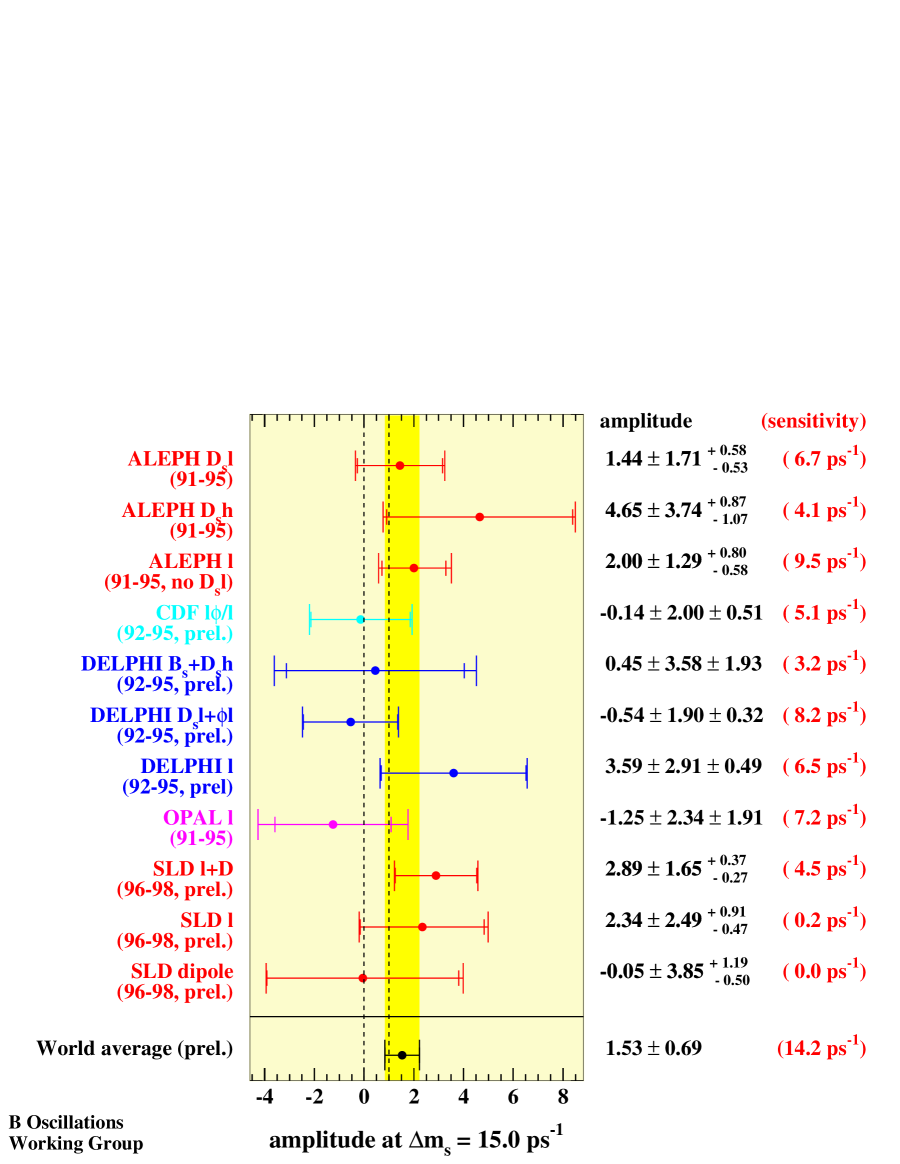
In the following, a summary as of the end of July 1999 of all mixing results compiled by the LEP B Oscillations Working Group is given. figure 11 gives the measured amplitude and its error at a value of 15 ps-1, as well as the sensitivity of each analysis. The world average amplitude at is away from zero ().
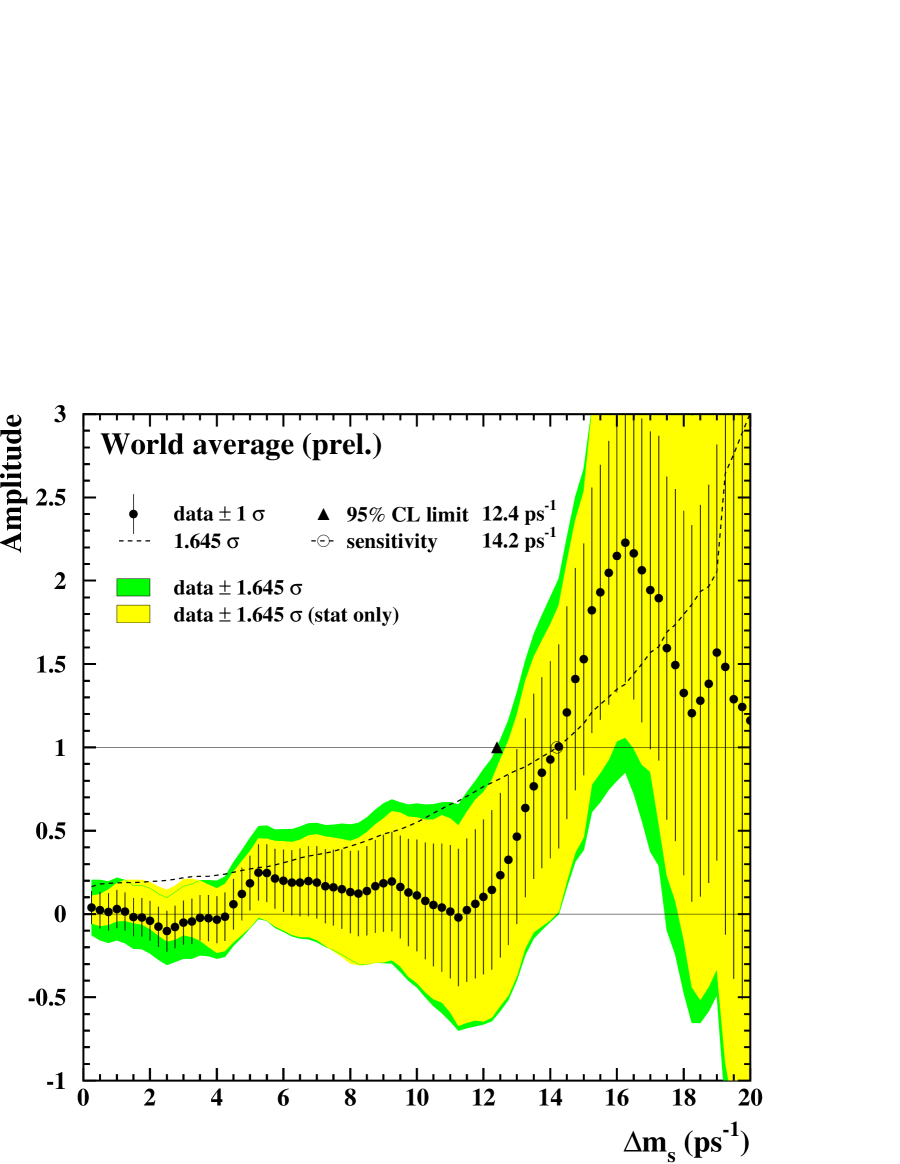
The world average amplitude vs. distribution is shown in figure 12. The overall sensitivity is and the combined limit:
Note that this limit does not take into account the new smaller value of the production fraction, as discussed above. Compared to last year’s results at the ICHEP’98 conference , the limit is unchanged, while the overall sensitivity has improved slightly (up from ).
The contribution of the limit on to the determination of CKM matrix is summarized in Ref. .
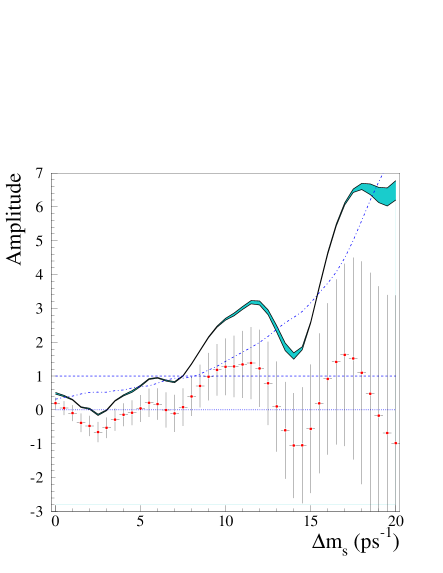
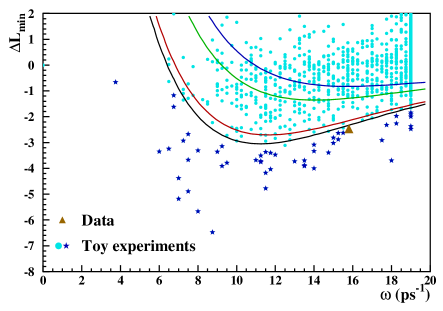
The bump seen in the amplitude distribution at around has been the subject of a lot interest. In a recent contribution, D. Abbaneo and G. Boix proposed a procedure to estimate the probability that the observed structure is due to a pure statistical fluctuation. They ran 2000 fast Monte Carlo experiments with a large value of (150 ps-1), each experiment being equivalent to the world sensitivity as of last winter (Moriond’99) . They convert the measured amplitudes into likelihood profiles as a function of . From these profiles which are shown in figure 10, they estimate the probability that the bump in the data (represented by the triangle in the figure) to originate from a fluctuation in a no-signal sample to be .
4.8 SLD status and future prospects
Final mixing results from SLD are expected in the near future. Since
Moriond’99, substantial improvements have been achieved, they come
from the following three sources:
Improved tracking resolution.
Improved charge dipole reconstruction.
Addition of two new analyses.
The design resolution with the pixel vertex detector VXD3 has been realized. It is characterized by a track impact parameter resolution of m in the -plane and m in the -plane. Furthermore, the precise location of the micron-size SLC beam spot is determined with an uncertainty of m.
Improvements in the SLD’s topological vertexing algorithm have resulted in a significantly better dipole tag purity (80% compared to 73% previously). The dipole tag, which is unique to SLD, exploits the charge flow in the cascade decay , and is made possible due to the ability to reconstruct (topologically) well-separated and vertices.

The dipole charge is reconstructed as the charge difference between the and vertices multiplied by the distance separating them. It is shown in figure 13, where the -quark and -quark components are represented by the dotted and the dashed histograms, respectively.
One of the two new analyses at SLD, called the + Tracks analysis, relies on the exclusive reconstruction of a in the and decay modes. It provides both a high purity of 33%, and an excellent decay length resolution m in the core (60%) and m in the tails (40%).
In the second new SLD analysis, called the Lepton + Kaon analysis, final-states containing an opposite sign lepton – kaon pair are selected. It is aimed primarily at isolating the semileptonic decays: , . Decays of and mesons produce lepton – kaon pairs with the same sign and are therefore suppressed. Thus, resulting in an enhancement of the purity. This analysis is also sensitive to the decays , , , in particular with the additional requirement of a second kaon in the vertex. The purity that is achieved is 26%, while a very good decay length resolution is also obtained with m in the core (60%) and m in the tails (40%). Both these new analyses have the disadvantage of a small overall efficiency. They have a small sensitivity to , but provide a substantial contribution at high values of when combined with the other SLD analyses.
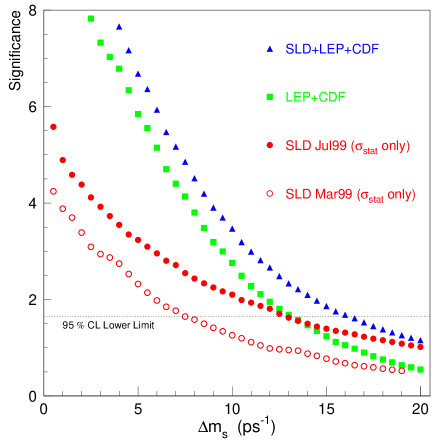
With these improvements, SLD’s overall sensitivity is estimated to increase to , and to dominate the world average for . The combined LEP+CDF+SLD sensitivity becomes . This is illustrated in figure 14.
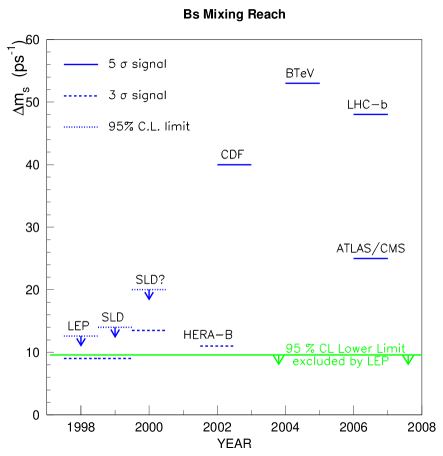
Several new experiments specifically geared for physics, violation in particular, are planned for the next decade. Their expected reach for mixing is shown in figure 15. It is anticipated that CDF will be the first experiment to measure , with a sensitivity of . Note that SLD’s reach could have been extended to . However, the run extension that was requested in order to achieve that was not approved due to lack of funding.
5 Conclusions
We have presented a review of mixing results as of the end of July 1999. For mixing, with a new measurement from CDF, the new world average for becomes:
In mixing, updates from OPAL and DELPHI were produced recently. The new world average average limit is:
and the new world average sensitivity is . This, without taking into account the smaller value of the production fraction, which is evaluated by the LEP B Oscillations Working Group to be:
A relatively significant () bump persists in the amplitude spectrum at around . An attempt at estimating the probability that this may be due to a statistical fluctuation was performed by G. Abbaneo and G. Boix (using winter’99 data). Their result is a probability of .
We have also seen the first attempts at constraining from above, by setting a lower limit on the ratio . The best limit comes from DELPHI:
In the near future, final results from SLD are expected, with substantial improvements coming from a better tracking resolution, an improved dipole charge reconstruction, and the inclusion of two new analyses. As of this writing, a partial update from SLD has already been presented at the Lepton-Photon’99 conference. In fact the world average limit and sensitivity compiled there supersede the above quoted values.
In the longer term, many physics experiments are planned well into the next decade. With a reach extending over a very wide range, a precise measurement of will be performed by these experiments.
Acknowledgments
I would like to thank my colleagues David Jackson, John Jaros, and Stéphane Willocq for very fruitful discussions.
References
References
-
[1]
J.M. Flynn, C.T. Sachrajda, [hep-lat/9710057].
Also in Heavy Flavours II, pp. 402-452 (World Scientific, Singapore, 1997), A.J. Buras, M. Lindner, Eds. - [2] A. Ali, D. London, Eur. Phys. J. C9 (1999) (68); A. Ali, D. London, Nucl. Phys. 54A (Proc. Suppl.)(1997) 297.
- [3] S. Hashimoto, “Summary of lattice results for decay constants, mixing, etc.”, in these proceedings.
- [4] “The BABAR Physics Book”, P.F. Harrison, H.R. Quinn, Eds., [SLAC-R-504] (1998).
-
[5]
LEP B Oscillations Working Group, see
http://www.cern.ch/LEPBOSC/
(and links/references therein). - [6] DELPHI Collaboration, [DELPHI 99-104, CONF 291].
-
[7]
CLEO Collaboration, see
http://www.lns.cornell.edu/public/CLEO
/analysis/results/B-mixing/. -
[8]
CDF Collaboration, see
http://www-cdf.fnal.gov/physics/new
/bottom/cdf4526/cdf4526.html. - [9] H.G. Moser, A. Roussarie, Nucl. Inst. Meth. A 384 (1997) 491.
-
[10]
See for example
M. Beneke et al., Phys. Lett. B459 (1999) 631. - [11] DELPHI Collaboration, [DELPHI 99-109, CONF 296].
- [12] ALEPH Collaboration, Eur. Phys. J. C7 (1999) 553, [hep-ex/9811018].
- [13] ALEPH Collaboration, Phys. Lett. B377 (1996) 205.
- [14] ALEPH Collaboration, Eur. Phys. J. C4 (1998) 367.
- [15] OPAL Collaboration, [CERN-EP-99-085], June 1999, 28pp., [hep-ex/9907061].
- [16] CDF Collaboration, Phys. Rev. Lett. 82 (1999) 3576.
- [17] J. Thom, SLD Collaboration, Proceedings of Beauty’99, Bled, Slovenia, June 1999, to appear.
- [18] F. Parodi, Proceedings of the 29th International Conference on High Energy Physics, Vancouver 1998, vol. 2, pp. 1148-1154.
-
[19]
S. Plaszczynski, “Overall determination of the CKM
Matrix”, in these proceedings.
See also:
F. Parodi, P. Roudeau, A. Stocchi, [hep-ex/9903063]; S. Mele, Phys. Rev. D59 (1999) 113011. - [20] G. Boix, D. Abbaneo, J. High Energy Phys. 08 (1999) 004, [hep-ex/9909033].
- [21] LEP B Oscillations Working Group, “Combined Results on Oscillations: Results from Winter 1999 Conferences”, [LEPBOSC 99/1], June 1999.
- [22] D.J. Jackson, Nucl. Inst. Meth. A 388 (1997) 247.
- [23] E. Gerndt, “Status of HERA-B”, in these proceedings.
- [24] R. Jesik, “b-physics potential of Tevatron Run II”, in these proceedings.
- [25] N. Harnew, “Prospects for LHCb, BTeV, ATLAS, CMS”, in these proceedings.
- [26] SLD Collaboration, [SLAC-PUB-8225], Aug. 1999, 25pp.
- [27] G. Blaylock, Proceedings of Lepton-Photon’99, Stanford, CA, August 1999, to appear.