New experimental data for the decays and
from SND detector.
M.N. Achasov, V.M. Aulchenko, K.I. Beloborodov, A.V. Berdyugin,
A.V. Bozhenok, D.A. Bukin, S.V. Burdin, T.V. Dimova,
S.I. Dolinsky,
A.A. Drozdetsky, V.P. Druzhinin, M.S. Dubrovin,
I.A. Gaponenko,
V.B. Golubev, V.N. Ivanchenko, P.M. Ivanov, A.A. Korol,
S.V. Koshuba,
G.A. Kukartsev, I.N. Nesterenko, A.V. Otboev,
E.V. Pakhtusova, V.M. Popov, A.A. Salnikov,
S.I. Serednyakov,
V.V. Shary, Yu.M. Shatunov, V.A. Sidorov,
Z.K. Silagadze,
Yu.V. Usov, A.V. Vasiljev, A.S. Zakharov
Budker Institute of Nuclear Physics and
Novosibirsk State University, Novosibirsk 630090, Russia
talk given by S. Burdin
at 8th International Conference on
Hadron Spectroscopy (HADRON 99),
Beijing, China, 24-28 Aug 1999
Abstract
The processes and
have been studied with SND
detector at VEPP-2M
collider in the vicinity of resonance.
The branching ratios
and
were obtained.
1 Introduction
The both decays and give
interference patterns in the energy dependences of the cross sections
of the processes
(1)
(2)
in
the region of resonance. The interference amplitude is
determined by the branching ratio of the corresponding decay. The
table value of the branching ratio
[1]
is based on the experiments in photoproduction
[2]. In collisions one can measure
the leptonic branching ratio of meson
.
Such measurements were performed in Orsay [3] and Novosibirsk
[4], but their accuracy was not too high.
The experimental result on the decay [1]
does not agree well with the theoretical predictions (see for
example [5]), but the improvement of the accuracy is needed.
Data collected at VEPP-2M [6] with SND detector
[7] in the vicinity
of resonance allow to improve the accuracy of the
measurements of these decays.
The result on the decay [8]
was obtained using 1996 data sample with
the total integrated
luminosity pb-1 and corresponding number of
mesons about . The 1998 data
were used to measure the decay . During 1998
about mesons were produced with the
integrated luminosity pb-1.
2 Event selection
The preliminary selections were
the same for the both processes.
The events with two collinear
charged tracks were selected. The cuts on the angles of
acollinearity in azimuth and polar directions were following:
, .
To suppress the beam and cosmic background the production point of charged
particles was required to be within cm from the
interaction point in the azimuth plane and cm along
the beam direction (the longitudinal size of the interaction region
is about cm).
The polar angles of the charged particles were limited in the range
, corresponding to the acceptance angle of
the outer system [7]. The outer system allows to distinguish
between the processes (1) and (2)
due to the difference in the probability to hit the outer system
for muons and pions. These
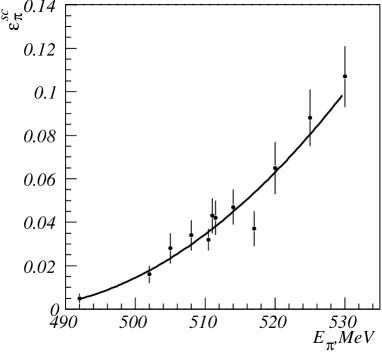
probabilities are shown in Fig. 2 and 2.
Figure 1: The energy dependence of the probability to hit the outer system
for muons.
Figure 2: The energy dependence of the probability to hit the outer system
for pions.
The data were divided for two samples (“muons” and “pions”)
in dependence on the existence of the hit in the outer system.
The admixture of the events of the process (2) in the sample
“muons” was about 3% at -resonance energy. The process
(1) gave 15% contribution to the sample “pions”
at the same energy.
Other sources of background are the cosmic muons and the process
.
The cosmic background was significant
only for the process (1) and was suppressed by the time of
flight system, which is a part of the outer system.
The events of the process did not contribute
to the sample “muons” due to the suppression by the outer system.
To reduce the background from these events for the process (2)
the procedure of separation based
on the energy depositions in the calorimeter layers was used.
The events of the process were suppressed by factor
, while only 7% of the events of the process under
study were lost.
The remaining background from the process was
about 1.5% at MeV.
The processes
and gave resonance background to the
process .
The events of these decays were
suppressed by restrictions on the energy depositions in the
calorimeter layers. The contribution of the resonance
background remained at the level of 0.5% at MeV.
Because such background changes the visible interference
pattern,
special efforts were made to subtract it. The selected events were
divided in two parts by the cut on the parameter
: and
.
To obtain the interference parameters
the events from the first part were used.
The resonance background was determined from the second part, where
its level is comparable with the visible cross section of the process
(2). The relationship between the quantities of the resonance
background in two parts was calculated by Monte Carlo simulation
[9].
The detection efficiencies were obtained
from the simulated data with using the experimental data for some
corrections. The efficiencies for the processes (1) and
(2) were 28% and 12% respectively
at the region of resonance.
3 Data analysis
The energy dependence of the visible cross sections
of the processes under study
was fitted with the following formula:
,
where – the detection efficiency, –
the Born cross section of the appropriate process, – factor
taking into account the radiative corrections [10, 11],
is the cross section of the background. The Born cross
section was factorized into non-resonant and resonant parts:
,
,
where – modulus and phase of the interference amplitude,
– mass and width of meson. Non-resonant
cross section was taken in the form
for the
process (1). A second order polynomial was used to describe the
cross section of the process (2).
The interference amplitude is related to the branching ratio of the
decay by the following expression:
,
where is the fine structure constant. For the decay
:
,
where – the pion form factor at the maximum of
resonance, .
Fig. 4 shows the cross section of the process
(1). The cross section for the process
(2) is shown in Fig. 4.
Figure 3: The Born cross section of the process
.
Figure 4: The visible cross section for the process
.
The fit gave the following results:
, ,
, , . The systematic errors are not
specified in these results.
From here the leptonic branching ratio of meson
and the branching
ratios ,
were obtained. The real and imaginary parts of the interference
amplitude of the decay are
following: ,
.
4 Conclusion
The measured value of and the
branching ratio are in good agreement with the
table branching ratio
[1]. The accuracy of the result for the decay
is comparable with the accuracy of the table value
[1].
The measured value of
agrees
with the table value and has much better accuracy. There is a discrepancy
between our result and the preliminary result of CMD-2 [12].
The measured is much
lower than VDM prediction with standard
mixing [5]. Such low real part can be
explained by the existence of direct decay of
to or
non-standard mixing.
5 Acknowledgement
The work is partially supported by RFBR (Grants No 96-15-96327, 99-02-17155,
99-02-16815, 99-02-16813) and STP “Integration” (Grant No 274).
References
[1] Review of Particle Physics. The European Physical Journal
C 3 (1998).
[2]
S.Hayes et al., Phys. Rev. D, V.4 (1971) 899.
[3]
J.E.Augustin et al., Phys. Rev. Lett. 30 (1973) 462.
[4]
I.B.Vasserman et al., Phys. Lett. B 99 (1981) 62.