OREXP 99-04
October 1999
Study of top-quark reconstruction with LCD Fast Simulation ***Work supported by Department of Energy grant DE-FG03-96ER40969 (Oregon).
Masako Iwasaki
Department of Physics, University of Oregon, Eugene, OR 97403
Abstract
We report the study of top-quark reconstruction in events at a 500 GeV linear collider using the LCD Fast Simulator. The final states of 6 jets as well as 4 jets and lepton are used. In order to reconstruct the jets, the performance of charged and neutral cluster separation are studied. We compare top-quark reconstruction for the LCD Small and LCD Large detectors, including the effect of varying the calorimeter granularity.
Presented at the world-wide study of physics and detectors for future linear colliders (LCWS 99), 8 Apr - 5 May 1999, Sitges, Barcelona, Spain
1 Introduction
Top-quark physics is an important topic for future linear collider experiments. Due to its large mass[1], the top quark may play a special role in particle physics. And since the final states are complicated, top-quark events provide an important performance benchmark for detector and event reconstruction performance. Therefore, realistic detector simulation studies are important, though many generator level studies have already shown the potential of a future linear collider for detailed studies of top-quark properties.
In this report, we present a study of top-quark reconstruction in using the Linear Collider Detector (LCD) Fast Simulation. The expected signature for production is two quarks and two bosons in the final states. The two bosons decay into either or , giving final states configurations of (i) two jets and four jets from W’s (45%), (ii)two jets, two jets and one charged lepton (44%), or (iii) two jets and two charged leptons(11%). We study cases (i) and (ii), where case (i) gives six jets and case (ii) has four jets and one charged lepton in the final states.
Jets were reconstructed by combining charged track and neutral cluster information. For this to work, we have to identify whether each cluster is neutral or charged. We will show neutral and charged cluster separation performance for different detector parameters. From these jets, we reconstruct top-quark candidates and present the resulting reconstruction performance.
2 Monte-Carlo Simulation
Monte-Carlo simulation events are generated using the PANDORA-PYTHIA program[2]. PANDORA generates parton-level 4-momentum vectors and PYTHIA 6.1[3] hadronizes the partons. For leptons, TAUOLA[4] is used. We generated 30,000 events with a top-quark mass of 175 GeV and a beam energy of 250 GeV. Beamstrahlung and initial state radiation are included. No other final states were generated.
To simulate the detector, we used the LCD Fast Simulation. Charged particles within the magnet field follow helical trajectories, and their momenta and positions are smeared. Electrons, photons, and hadrons produce clusters in the electromagnetic (EM) and hadronic (HAD) calorimeters. Here, one cluster was made from one particle. Energies and positions of clusters were smeared.
There are two detector models presently under study by the LCD group, a Small and a Large detector. In this study, we consider these two detector designs. These models differ in geometry, materials, and resolutions. The detector parameters are summarized in Table. 1. The smearing implemented in the LCD Fast Simulator is based on the resolutions. For the calorimeters, we assume transverse position resolutions of 1cm/ (electrons and photons) or 5cm/ (hadrons). In order to consider the detector granularity, clusters within calorimeter cells are merged, as described in Section 4. Charged tracks with E MeV and (0.83 for Large), and clusters with E MeV and were used.
| Small | Large | |
| Vertex Detector | CCD | CCD |
| Impact parameter resolution | ||
| Central Tracking | Si micro strips | TPC |
| Momentum resolution (High) | ||
| (Low) | ||
| Electromagnetic Calorimeter | W/Si pads | Pb/scintillator |
| Barrel Inner Radius | 75 cm | 200 cm |
| Endcap Inner Z | 150 cm | 300 cm |
| Energy resolution | ||
| Granularity | 20 mrad | 20 mrad |
| Hadron Calorimeter | Cu/scintillator | Pb/scintillator |
| Barrel Inner Radius | 140 cm | 250 cm |
| Endcap Inner Z | 186 cm | 350 cm |
| Energy resolution | ||
| Granularity | 60 mrad | 60 mrad |
| Coil Magnet | ||
| Magnetic field | 6 Tesla | 3 Tesla |
| Inner Radius | 100 cm (outside EM Cal) | 376 cm (outside HAD Cal) |
3 Charged and neutral cluster separation
Charged hadrons and electrons are detected by both the tracker and the calorimeters. At the center of mass energy of 500 GeV, events have an average charged particle energy of about 2.4 GeV. For these relatively low energies, the tracker resolution is better than the calorimeters. Therefore we use the tracker information for the charged particles, and remove the corresponding and the charged clusters. The tracks are then combined with the neutral clusters to form jets. This procedure is sometimes called the “energy flow” algorithm.
This technique requires a tight association between tracks and the corresponding charged clusters. All charged tracks are extrapolated to the point where the cylindrical radius is the same as the cluster radius. Then the nearest track is associated with each cluster. Figure 1 shows this distance when both cluster and track result from the same particle (left), and for photon clusters (right). There is a peak around zero when the clusters and tracks are from the same particle. On the other hand, there is no such a peak for the neutral clusters. By applying a cut on this distance, charged clusters were rejected.
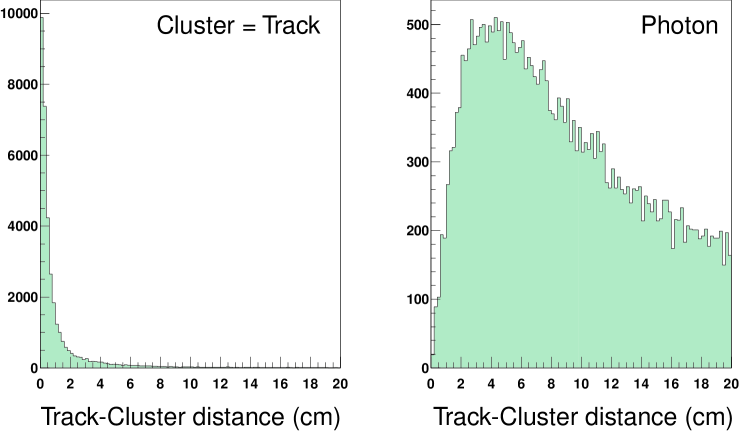
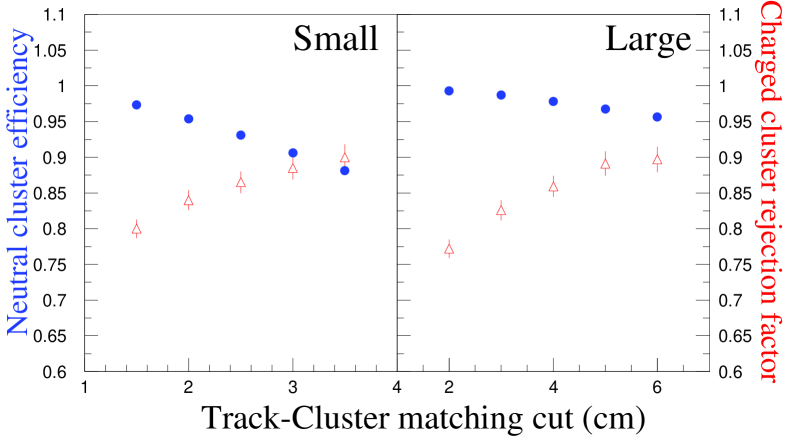
Figure 2 shows charged cluster rejection factors (open triangles) and neutral cluster efficiencies (solid circles) as a function of the value of the track-cluster distance cut. The performance of charged and neutral cluster separation is proportional to the magnetic field and the square of the calorimeter radius. Therefore, the Large detector with a 3 Tesla magnetic field and a radius of 200 cm gives better separation than the Small detector with 6 Tesla field and 75 cm radius. We used cut values of 2.5 cm and 4.0 cm for Small and Large detectors, respectively. This gave a 87% (86%) charged cluster rejection factor and a 93%(98%) neutral cluster efficiency for the Small (Large) detector.
4 Cluster merging
The LCD Fast Simulator makes one cluster from each particle in the calorimeters. To simulate the detector granularity and cluster width, which is typically a few units of Moliere radius, we merge the clusters when the angular separation between clusters is less than , where is a measure of detector granularity.
Table 2 shows the probability for a cluster to be merged with another cluster. The nominal granularity assigned to the LCD Small and Large detector models is 20 mrad for each. The 13 mrad case for the Small detector corresponds to a 1cm segmentation at the EM Calorimeter surface. The 30 mrad granularity is the same as that of the JLC calorimeter design. For our analysis, we used the same granularity for EM and hadronic calorimeters, and we did not use any longitudinal segmentation. Therefore, clusters within are merged even though these clusters might have different longitudinal positions.
| = 13 mrad | 20 mrad | 30 mrad | |
|---|---|---|---|
| Small | 2.7 0.4 % | 5.4 0.4 % | 10.0 0.5 % |
| Large | 5.1 0.4 % | 9.4 0.4 % |
5 Study of top-quark reconstruction
5.1 Reconstruction of 6 jets
In this analysis, we used only 6 jet events (14000 events). In order to reconstruct the 6 jets events, we select events where the number of charged tracks is 30 and the visible energy exceeds 100 GeV. (Visible energy is calculated using charged tracks and neutral clusters.) To find jets, charged tracks and neutral clusters are grouped into jets, using an invariant-mass (JADE) algorithm. First we apply and select events which have 6 or more jets. Then the value is increased, if necessary, until the event has exactly 6 jets. The efficiency of this selection is 71% for 6 jets events.
Since , -quark tagging may be important for reducing background. In order to tag the -quark jet, we used the method, where indicates the number of tracks which have 3-D impact parameter with significance (excluding decay tracks). A jet with was regarded as a -jet candidate. The method provides 87% purity and 67% efficiency for -quark jets. After selecting -quark jets, we form candidates by combining all remaining jet pairs. Jet pairs with invariant mass within 12 GeV of the nominal W mass were kept. Top-quark candidates are then formed from these and jets. To reduce random combinatoric background, we require the quantity satisfy the condition . The remaining combinations with invariant mass in the range 165 GeV to 185 GeV are regarded as top-quark candidates.
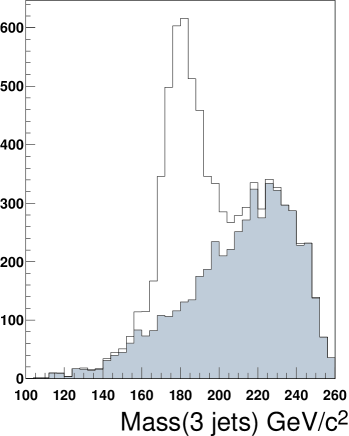
Fig. 3 shows the reconstructed top-quark mass distribution for the Small detector. The reconstruction performance for Small and Large is summarized in Table 3, where the “cluster merging size” is just . 20 mrad corresponds to the granularity of the current specifications for both Small and Large detectors. A merging size of 13 mrad corresponds to a segmentation of 1 cm at the inner radius of the Small EM calorimeter. The difference in reconstruction performance between 13 mrad and 20 mrad is very small (within 2%). With 30 mrad, we obtain about 10% smaller efficiency and a few percent worse angular and mass resolutions. This corresponds to the granularity of the JLC calorimeter. The angular resolution for reconstructed top is important for anomalous couplings analyses. Here, it is determined from reconstructed top relative to MC truth.
Comparing the LCD Small and Large detectors, they have similar mass resolution, but Large has about 10% better angular resolution, and a few percent higher efficiency. This is apparently due to its larger , which gives the Large detector an advantage for neutral and charged cluster separation, as described in the previous section.
| Cluster merging size | 13 mrad | 20 mrad | 30 mrad | |
|---|---|---|---|---|
| Small | Top-quark candidates | 2326 | 2303 | 2202 |
| Top-quark signal | 1772 | 1742 | 1633 | |
| Mass resolution (GeV) | 9.59 0.18 | 9.66 0.21 | 9.86 0.26 | |
| Angular resolution (mrad) | 62.9 1.2 | 63.8 1.3 | 71.4 1.5 | |
| Large | Top-quark candidates | 2469 | 2272 | |
| Top-quark signal | 1899 | 1703 | ||
| Mass resolution (GeV) | 9.38 0.17 | 9.96 0.22 | ||
| Angular resolution (mrad) | 56.7 1.3 | 60.1 1.0 |
6 Reconstruction of jetslepton
In this study, we used 8600 jetlepton events in the generated Monte Carlo sample described above. For event selection, we require the number of charged tracks be , the visible energy exceed 100 GeV, and a lepton track (muon or electron) with momentum GeV. No other criteria for lepton identification are required. All charged tracks, except for the charged lepton, are combined with the neutral clusters to form jets. As before, we first apply to select events with 4 or more jets, then increase until the event has exactly 4 jets.
To tag the -quark jets, we require , resulting in a 92% purity and 64% efficiency. We form the and top candidates exactly as was described for the 6-jet case. Of course, for this decay mode, we only have one and one top which can be reconstructed in this way.
The resulting reconstruction performance is summarized in Table 4. As before, we find the reconstruction performance for 13 mrad and 20 mrad merging size to be within 2%. For the 30 mrad case, we obtain 10% (Small) and 5% (Large) smaller efficiency and a few percent worse angular and mass resolution.
Comparing the Small and Large detectors, the Large detector has similar mass resolution and better angular resolution of 10% (20 mrad) and 2% (30 mrad). On the other hand, the Small design has 10% higher efficiency. This is because for jetlepton reconstruction, both -quark jet tagging and lepton identification are based on tracker information, which has wider acceptance for the Small detector (), compared to the Large detector ( ).
| Cluster merging size | 13 mrad | 20 mrad | 30 mrad | |
|---|---|---|---|---|
| Small | Top-quark candidates | 748 | 728 | 672 |
| Top-quark signal | 651 | 639 | 570 | |
| Mass resolution (GeV) | 9.61 0.26 | 9.63 0.23 | 9.64 0.39 | |
| Angular resolution (mrad) | 54.5 1.6 | 53.0 2.0 | 56.9 2.1 | |
| Large | Top-quark candidates | 678 | 651 | |
| Top-quark signal | 587 | 560 | ||
| Mass resolution (GeV) | 9.26 0.36 | 9.18 0.39 | ||
| Angular resolution (mrad) | 47.5 2.3 | 55.7 2.3 |
7 Conclusion
We have studied top-quark reconstruction in events at a 500 GeV linear collider using the LCD Fast Simulator. Two kinds of final states, six jets and 4 jets plus lepton, were used. The performance of charged and neutral cluster separation and the effect of varying the calorimeter granularity were studied.
Comparing the Large and the Small detectors, Large has an advantage in the neutral and charged cluster separation, because of its larger calorimeter radius. In the reconstruction, the Large detector has 10% higher selection efficiency than Small due to this advantage. On the other hand, the Small detector has 10% higher efficiency in jetslepton due to its better acceptance in for charged tracks.
The top-quark reconstruction performance improves by only 2% when the calorimeter granularity (simulated by merging clusters) is reduced from 20 mrad to 13 mrad. When the granularity is increased to 30 mrad, we obtain about a 10% reduction in top reconstruction efficiency and a few percent worse angular and mass resolution.
In these studies, we used the LCD Fast Simulator. Since neutral and charged cluster separation is crucial for top-quark reconstruction using this “energy flow” technique, more detailed and realistic studies, using full calorimeter shower simulations, will be a necessary.
References
-
[1]
CDF collaboration, F. Abe et al.,
Phys. Rev. Lett. 82 (1999) 271.
D0 collaboration, B. Abbott et al., Phys. Rev. D60 (1999) 052001. - [2] M. Peskin, These proceedings.
- [3] T. Sjöstrand, Comp. Phys Comm. 82 (1994) 74.
- [4] S. Jadach et al., Comp Phys Comm. 76 (1993) 361.