Performance of the CLEO III LiF-TEA Ring Imaging Cherenkov Detector in a High Energy Muon Beam
Abstract
The CLEO III Ring Imaging Cherenkov detector uses LiF radiators to generate Cherenkov photons which are then detected by proportional wire chambers using a mixture of CH4 and TEA gases. The first two photon detector modules which were constructed, were taken to Fermilab and tested in a beam dump that provided high momentum muons. We report on results using both plane and “sawtooth” shaped radiators. Specifically, we discuss the number of photoelectrons observed per ring and the angular resolution. The particle separation ability is shown to be sufficient for the physics of CLEO III.
HEPSU 99-5
Oct. 1999
Submitted to Nuclear Instruments and Methods A
1 INTRODUCTION
The CLEO III detector is designed to study decays of and quarks, leptons and mesons produced in collisions near 10 GeV center-of-mass energy. The new detector is an upgraded version of CLEO II [1]. It will contain a new four-layer silicon strip vertex detector, a new wire drift chamber and a particle identification system based on the detection of Cherenkov ring images.
The main physics goals of CLEO III include studies of the CKM matrix, CP violation and rare decays of mesons. These studies require, in most cases, the separation of charged kaons from charged pions. Examples include studying the rare decay , where the background is from . Measuring the CP violation rate asymmetry in , versus , where only the particle identification can distinguish between the two reactions. Another example is measuring the rate for , where the dominant reaction is .
There are many other physics goals where the role of the particle identification is useful but not as crucial as those mentioned above. As an example, consider the measurement of the CKM element which is thought to be best done using the reaction at the kinematic point where the transforms to a at rest in the rest frame. Here reducing the background in the reconstruction becomes important.
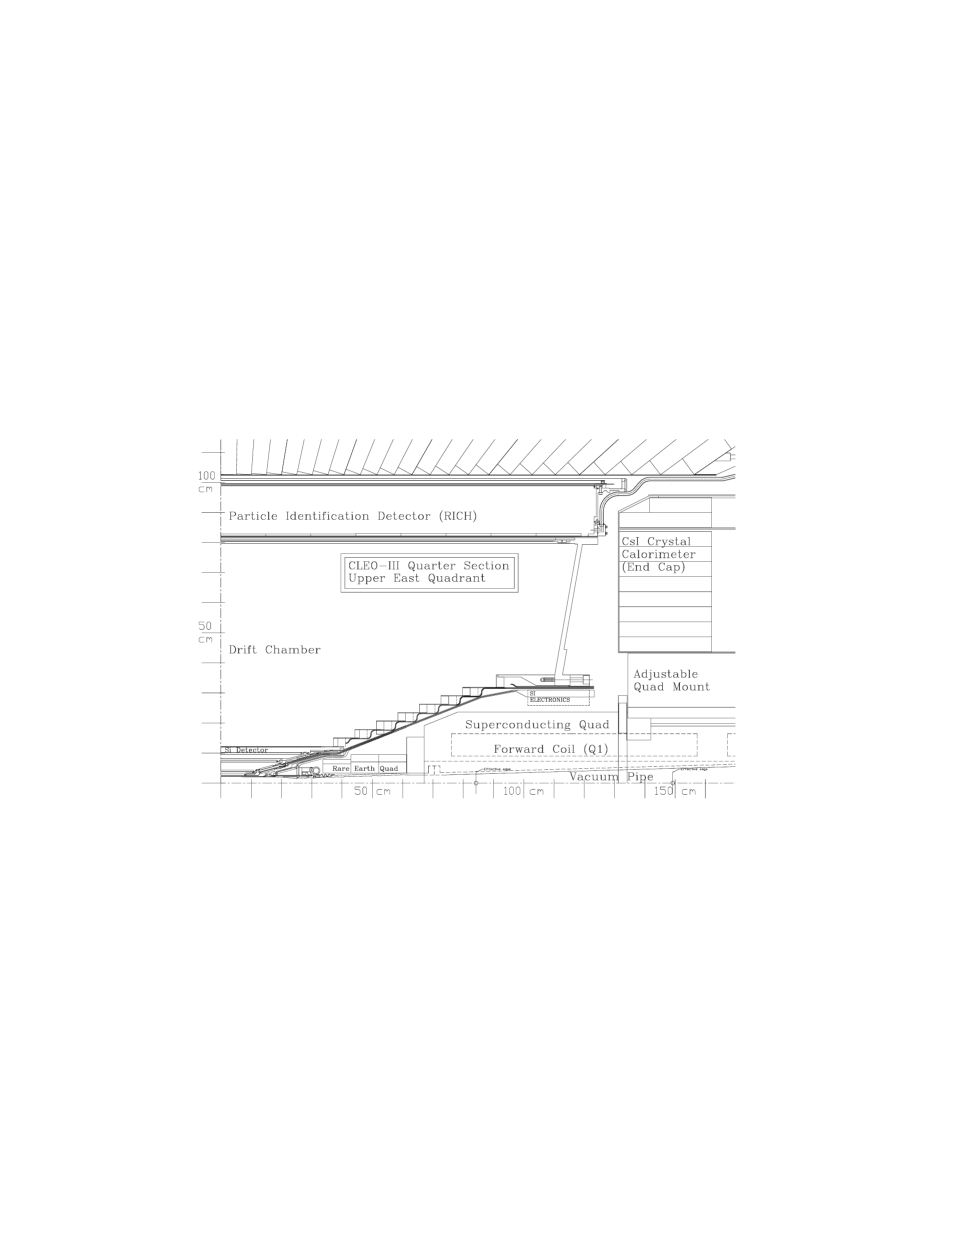
CLEO III has approximate cylindrical symmetry with endcaps for some detector elements. Its outer shell consists of a muon detector, a super-conducting coil and an electromagnetic calorimeter that uses CsI crystals. These are the same components as used in CLEO II. In order to achieve higher luminosity, the machine quadrupole magnets have been moved much closer to the collision point and necessitated the reconstruction of the detector inside the calorimeter. A sketch of CLEO III is shown in Fig. 1 [2, 3].
CLEO II produced many physics results, but was hampered by its limited charged-hadron identification capabilities. Design choices for particle identification were limited by radial space. The CsI calorimeter imposed a hard outer limit and the desire for maintaining excellent charged particle tracking imposed a lower limit, since at high momentum the error in momentum is proportional to the square of the track length. The particle identification system was allocated only 20 cm of radial space, and this limited the technology choices.
The highest momentum particles from decays occur in the two-body decay . Due to the small motion, the pions have a box shaped momentum distribution between 2.5 and 2.8 GeV/c. The goal of the particle identification system is to separate kaons from pions up to this momentum. It is useful to define the number of standard deviation separation as the difference between two measured quantities divided by the error on the measurement. For example 2 separation in Cherenkov angle would require that the difference between measured angles for pions and kaons divided by the average error on both measurement be equal to two. (In practice the errors on both measurements are nearly equal, especially when the difference in expected Cherenkov angle is small.)
The drift chamber incorporates a measurement of specific ionization (dE/dx) which allows good kaon/pion separation below 800 MeV/c and useful, 1.8 separation, above 2.2 GeV/c to about 3 GeV/c. Thus an addition particle identification system should have at least 3 separation at high momentum and at least 4 separation down to 800 MeV/c.
2 GENERAL PRINCIPLES OF A PROXIMITY-FOCUSED RICH
The CLEO III RICH detector consists of three components: radiator, expansion volume, and photon detector. No focusing is used; this is called “proximity-focusing” [4]. When an incident charged particle with sufficient velocity () passes through a radiator medium, it emits photons at an angle via the Cherenkov effect; some photons are internally reflected due to the large refractive index of the radiator, and some escape. These latter photons propagate in a transparent expansion volume, sufficiently large to allow the Cherenkov cone to expand in size (as much as other spatial constraints allow). The position of the photoelectrons are determined by a two-dimensional array of cathode-pads, in a photosensitive multi-wire chamber.
The resulting images are portions of conic sections, distorted by refraction and truncated by internal reflection at the boundaries of media with different optical densities. Thus, knowing the track parameters of the charged particle and the refractive index of the radiator, one can reconstruct the Cherenkov angle from the photoelectron positions and extract the particle mass. This elegant and compact approach was pioneered by the Fast-RICH Group [5, 6, 7].
In order to achieve efficient particle identification with low fake rates, we set as a design goal a system capable of separation with 4 significance () at 2.65 GeV/, the mean momentum for the pions from decays at a symmetric collider. At this momentum, the Cherenkov angle difference mr, which along with identification from the central Drift Chamber, requires a Cherenkov angle resolution mr per track. Since the estimated angular resolution per photon is 14 mr [8] using a 10 mm thick flat LiF radiator, we need approximately 12 photons to meet our goal.
3 DESIGN
The 20 cm radial space limitation requires us to use a compact photon detector. This is met by the use of Triethyleamine gas (TEA), mixed with methane. This mixture has a mean absorption length of 0.5 mm, but requires the use of light in the deep ultraviolet, between 135-165 nm. Other choices such as TMAE gas or phototubes would have taken most of our allotted space, and thus were not possible. Other solutions such as DIRC [9] were not feasible for several reasons including the existing detector iron and the desire to limit the detector thickness to less than 12% of a radiation length.
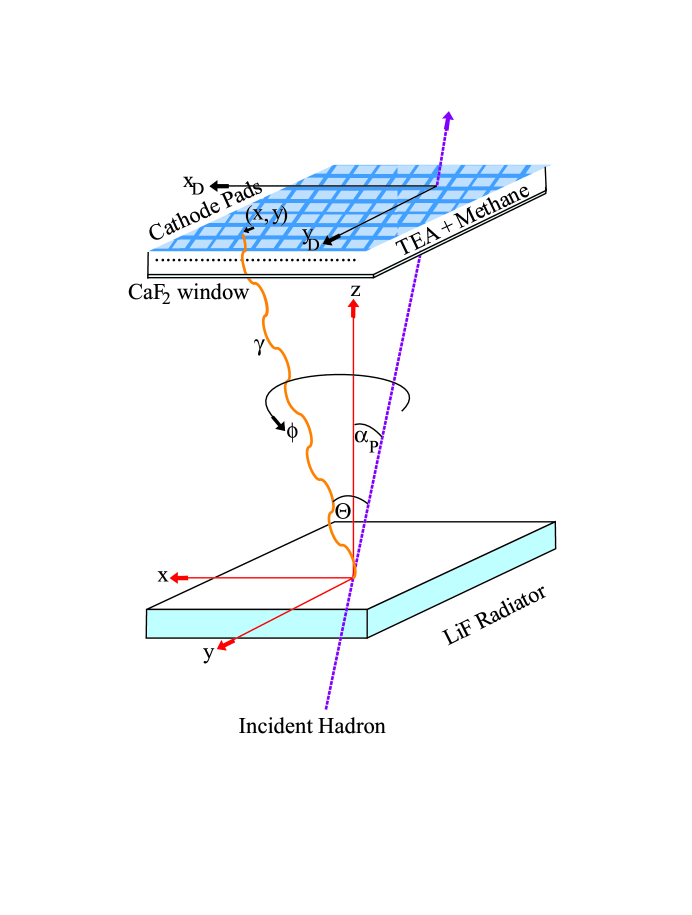
Transparent materials in this wavelength region are limited to flouride crystals. Thus the radiator is LiF and the chamber windows are CaF2. The components of our system are illustrated in Fig. 2. They consist of a LiF radiator, in which UV photons are generated, an expansion region, and a photosensitive detector. The angle is the polar angle of the incident particle with respect to the radiator normal, is the Cherenkov angle and specifies the azimuthal angle of the Cherenkov photons.
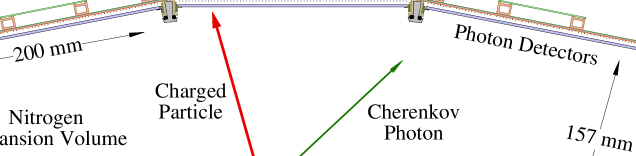
An end view of 1/10 of the detector is shown in Fig. 3. The radiators are glued to the outside of a carbon fiber cylinder of 82 cm radius. The crystals (approximately 17.5 cm x 17 cm x 1 cm) are arranged in 30 rows running parallel to the axis of the cylinder. Each row has 14 individual crystals. The inner cylinder and 30 photon detector modules are attached to end flanges and the space between them (the expansion volume) is filled with ultraviolet light (UV) transparent N2 gas.
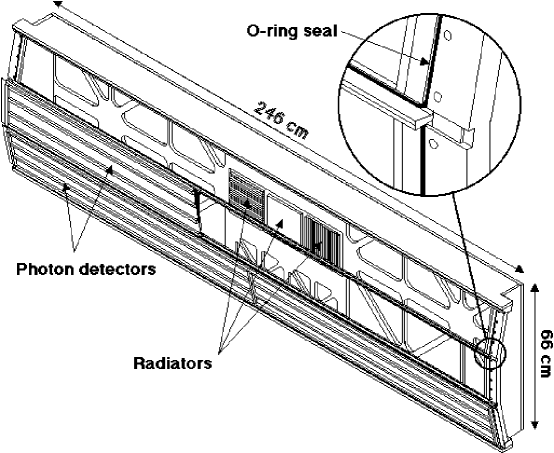
A sketch of a photon detector module is shown in Fig. 4.
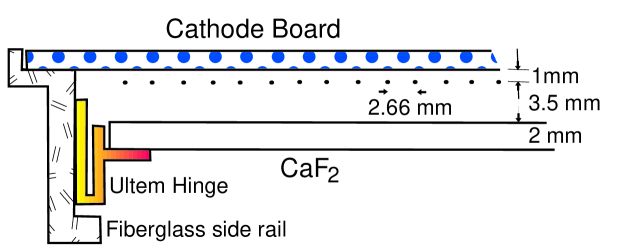
The wires run the entire length of the detector, approximately 2.5 m. They are supported every 30 cm by a ceramic spacer. The CaF2 window joints are placed directly on top of these spacers to minimize the loss of photon acceptance. Some parameters of the RICH detector are given in Table 1.
| Cathode pads | 24 in each 8 mm and 320 in each 7.5 mm |
|---|---|
| Wires | 70 Gold plated tungsten with 3% Rhenium, 20 m in diameter |
| 2 guard wires on each side, gold plated tungsten 30 m diameter | |
| Wire spacings | 2.66 mm between wires, 1 mm to cathode, 3.5 mm to CaF2 |
| Windows | 8 CaF2, 2 mm thick, 30 cm x 19 cm (some half size) |
| Electrodes | Anode wires at +HV, 100 m wide silver traces on CaF2 at -HV |
4 TEST SYSTEM ENCLOSURE
Our goal to maximize the UV photon yield influences the design of the expansion volume for CLEO III in three different ways. First, the only mechanical connection between the inner cylinder of radiators and the outer cylinder of photon detectors is located at the detector ends. This avoids the obstruction of photon propagation by other structural elements inside the expansion volume. Second, supports between adjacent photon detectors and inside the photon detectors themselves are kept small to allow for maximum coverage with photon-sensitive surface. Chambers are separated only by mm thick aluminum rails, which mainly control the spacing between photon detectors. Structural stability is based on the stiffness of the cylinder formed by the photon detectors. Furthermore, we need to minimize the material since the high quality CsI electromagnetic calorimeter is placed behind the RICH.
In order to satisfy these goals, we have a thin mechanical support system that puts high demands on chamber stiffness. One of the goals for the test beam was to prove the mechanical soundness of the design chosen for CLEO III. We therefore built an aluminum expansion volume box capable of supporting three photon detectors, that reproduces as closely as possible the final CLEO III photon detector support. The box is shown in Fig. 5. In particular, the middle photon detector was supported in exactly the same way as in the final design. In addition the box provided mounting structures for the radiator crystals.
The final design calls for an expansion volume free of contaminants with a significant UV absorption in the sensitive wavelength range. Such contaminants would be oxygen, which has to be kept to a level ppm to achieve 99% transmission, water or more complex, organic molecules. To achieve the required purity we used a stainless steel gas system supplied with 99.99% pure . Purification included Oxisorb filters.
A key element of the photon detector mounting scheme are 1/8” diameter O-rings in the support structure running around the perimeter of each photon detector. They provide a gas tight separation between the expansion volume and the outside world while allowing for the removal of photon detectors if access is required.
The expansion volume transparency for UV photons was monitored by a system consisting of a deuterium lamp, a monochrometer, a gas volume containing the gas sample and a photomultiplier tube. The transmission measurements were normalized to different reference gases of research grade quality. Fig. 6 shows the results for the transparency of nitrogen after passage through the test beam expansion volume box. We observed an absorption line at 145 nm. Its origin is not in contamination inside the expansion volume as the dip vanishes when the box is flushed with 99.98% pure Argon. This line and the one near 136 nm appear to be caused by molecular transitions in the [10].

5 RADIATORS
5.1 Introduction
If a track is incident normal to a LiF radiator no light is emitted from the radiator in the frequency range that can be detected by TEA, due to total internal reflection. A full system for CLEO, therefore, would require that the radiators be tilted until the track angles are about 20o. This causes several serious problems. One is the difficulty in accurate radiator mounting. More importantly, some of the light from one radiator must traverse through another radiator resulting in losses and reconstruction problems. To eliminate these problems we invented a novel radiator geometry. The light emitting surface of the radiator is cut with a profile resembling the teeth of a saw, the “sawtooth radiator” [11]. The major advantage of this configuration is that it reduces the losses of photons due to total internal reflection at the interface between the radiator and the expansion gap. It also turns out that the number of reconstructed photoelectrons is greatly improved and the angular resolution per photoelectron is greatly decreased.
A profile with teeth about 4 mm deep in a plate of 12 mm thickness is a good compromise between uniformity in light output, and cost. A detailed simulation has shown that a tooth angle of 42∘ is close to optimal and technically feasible. (The tooth angle is defined by the intersection of a plane parallel to the surface of a tooth with a plane parallel to the base of the radiator.) There are several problems inherent in producing such radiators, including the ability to precisely cut the LiF without cleaving the material and the ability to polish the surface yielding good ultraviolet light transmission. Furthermore, the production time and cost need to be reasonable. We worked with OPTOVAC in North Brookfield, Mass. to produce full sized radiators, with dimensions 17.5 cm x 17.0 cm x 1.2 cm. The two sawtooth radiators separated by a plane radiator as used in the test beam are shown in Fig. 7.

5.2 Shapes of Sawtooth Radiators
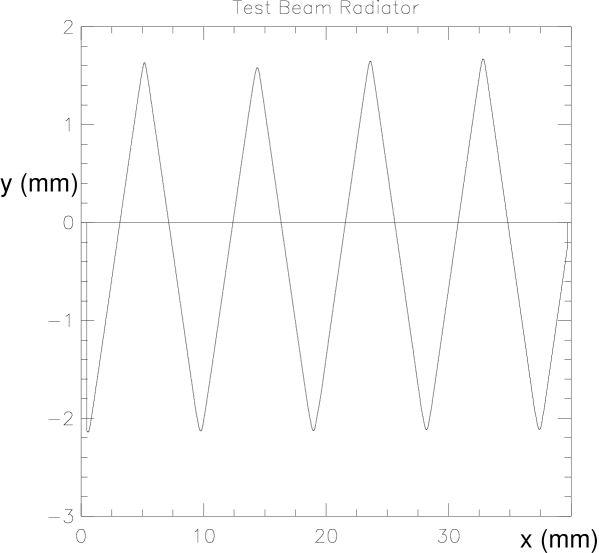
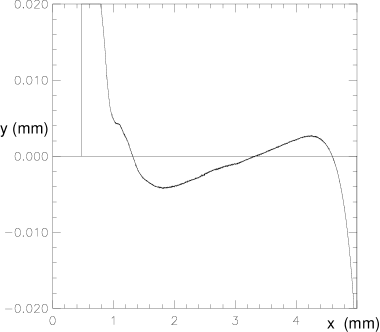
We measured the shapes of two sawtooth radiators, one used in the test beam and another more advanced sample used in the final detector. A plot of measurements of the test beam piece is shown in Fig. 8. There are 40,000 points and the vertical precision is good to approximately 50 nm. Such accuracy is certainly overkill, but was provided by the Form-Talleysurf machine that was available at the Center of Optics Manufacture, University of Rochester.
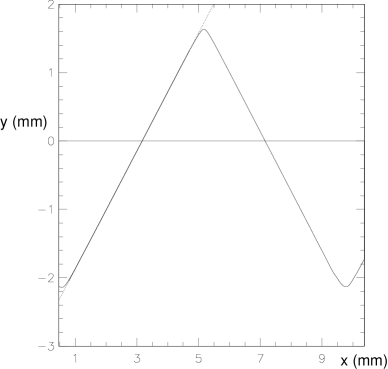
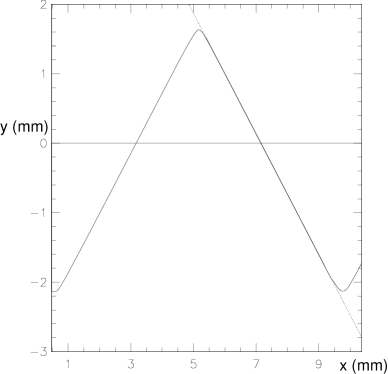
Each tooth edge was fit to a straight line. An example is given in Fig. 9. The angles can be changed slightly by changing the range of fit, but not significantly as will be demonstrated later. Fitting both sides of four teeth on each of the two radiators gave the measurements listed in Table 2.
 ,
,
| tooth | Test Beam Radiator | New Radiator | ||
|---|---|---|---|---|
| Face | Left Side | Right Side | Left Side | Right Side |
| 1 | 40.794 | -40.974 | 41.609 | -41.612 |
| 2 | 40.629 | -40.820 | 41.607 | -41.507 |
| 3 | 41.088 | -41.073 | 41.635 | -41.526 |
| 4 | 41.077 | -41.079 | 41.586 | -41.601 |
| avg | 40.900.11 | -40.990.06 | 41.610.01 | -41.560.01 |
| rms (mr) | 3.9 | 2.1 | 0.4 | 0.4 |
For both radiators the left side and right side give equivalent values. These then can be averaged to give sawtooth angles of 40.900.07∘ for the test beam radiator and 41.5850.017∘ for the new radiator.
The r.m.s. deviations are almost an order of magnitude larger for the test beam with respect to the new radiator, being on the order of 4 mr and 0.4 mr, respectively. Although the 4 mr variation appears on first sight to be large enough to cause a significant degradation in the resolution, our simulation shows that it adds a contribution of only 1 mr in quadrature to the final Cherenkov resolution per track. Variations in tooth angles in the new radiators will add only a negligible, 0.1 mr variation in quadrature to the Cherenkov track angle resolution.
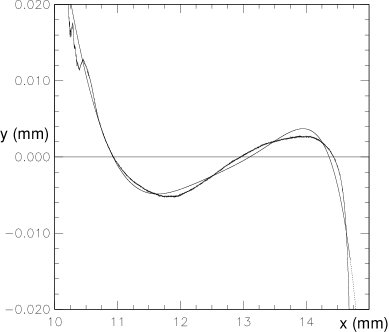
The actual tooth shapes deviate from strict linearity. Plots of the deviation of surface shape with respect to the linear fit are shown in Fig. 10 for both radiators. The general features are similar. The non-flat portions are caused, on the left side by the roll off in the valleys between the teeth and on the right side by the roll off to the tops of teeth. There is almost 1 mm of surface with “large” variations at the bottom and 0.5 mm at the top. Photons from these parts of the surface will not be at the proper position. This effect is somewhat ameliorated by the loss of optical transmission especially in the tooth valleys.
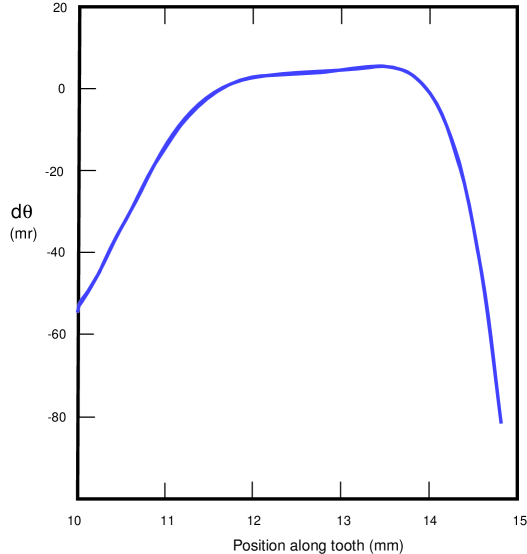
The plot for the new radiator also shows a polynomial fit to the surface. Though the fit isn’t perfect it does give a reasonable representation of the global aspects of the surface. Using this fit the derivative of the deviations from the linear fit is calculated and shown in Fig. 11.
5.3 UV Transmission
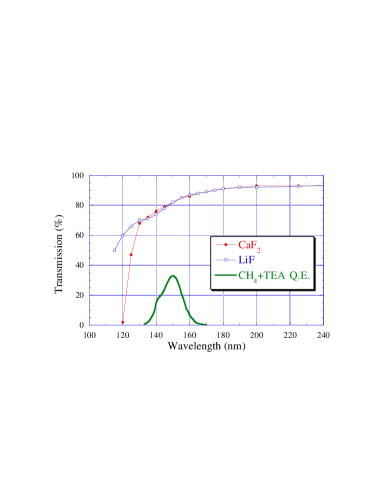
The transmission of the radiators, being on average 10 mm thick, is crucial to observing a significant number of Cherenkov photons. The plane radiators are polished on both sides and transmission measurements made through the bulk. On average a photon emerging from a plane radiator will have about half the absorption probability than indicated from these measurements since it will traverse only half the bulk material and need to penetrate only one surface. The measured transmission of a the plane radiator used in this test is shown in Fig. 12. We also show for comparison the transmission of an “average” 2 mm thick CaF2 window, used in the photon detectors and the shape of the CH4-TEA quantum efficiency curve.
Measurements of the transmission of the sawtooth radiators are made normalizing to a large prism with the same sawtooth angle that was polished using the same technique as the plane radiators. Measurements are made at 135 nm, 150 nm and 165 nm along three slices of the radiator and separately for the two sides of a tooth. In Fig. 13 we show the results of one such measurement at 150 nm.
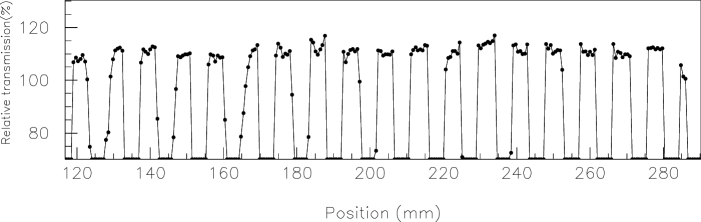
The transmissions are in excess of 100% showing that this particular radiator has better transmission than the normally polished prism. The excess could be due to better bulk transmission, but indicates that excellent polishing quality has been achieved. The zero transmission bands show the position of the other side of the tooth which should allow no light through in this setup. The transmission of that side is determined in a separate scan. The second sawtooth radiator that we used had 10% lower transmission than the first.
6 ELECTRONICS
The position of Cherenkov photons is measured by sensing the induced charge on array of 7.5 mm x 8.0 mm cathode pads. Since the pulse height distribution from single photons is expected to be exponential [14], this requires the use of low noise electronics. Pad clusters in the detector can be formed from single Cherenkov photons, overlaps of more than one Cherenkov photon or charged tracks. In Fig. 14 we show the pulse height distribution for single photons, two photons, and charged tracks. (See section(10.1) for a discussion of how single photon and double-photon pad clusters are defined.) The charged tracks give very large pulse heights because they are traversing 4.5 mm of the CH4-TEA mixture. The single photon pulse height distribution is exponential as expected for moderate gas gain. Also the cluster distribution with two detected photons has approximately half the slope of the one photon distribution as expected.

To have as low noise electronics as possible, a dedicated VLSI chip, called VA_RICH, based on a very successful chip developed for solid state applications, has been designed and produced for our application at IDE AS, Norway. We have fully characterized hundreds of 64 channel chips, mounted on hybrid circuits. For moderate values of the input capacitance , the equivalent noise charge measured is found to be about:
| (1) |
Its dynamic range is between 450,000 and 900,000 electrons, depending upon whether we choose a bias point for the output buffer suitable for signals of positive or negative polarity or we shift this bias point to have the maximum dynamic range for signals of a single polarity.
In our readout scheme we group 10 chips in a single readout cell communicating with data boards located in VME crates just outside the detector cylinder. Chips in the same readout cell share the same cable, which routes control signals and bias voltages from the data boards and output signals to the data boards. Two VA_RICH chips are mounted using wire bonds on one hybrid circuit that is attached via two miniature connectors to the back of the cathode board of the photon detector.
The analog output of the VA_RICH is transmitted to the data boards as a differential current, transformed into a voltage by transimpedance amplifiers and digitized by a 12 bit differential ADC. These receivers are part of very complex data boards which perform several important analog and digital functions. Each board contains 15 digitization circuits and three analog power supply sections providing the voltages and currents to bias the chips, and calibration circuitry. The digital component of these boards contains a sparsification circuit, an event buffer, memory to store the pedestal values, and the interface to the VME cpu.
While the noise performance in the Fermilab test was acceptable, we found that there was relatively large component of coherent noise (about 1000 electrons) whose source was imperfect grounding of the switched power supplies in the DAQ crates. (These will be replaced in the final system.) We achieved very good noise performance by subtracting the coherent noise on each hybrid card individually offline. This noise suppression has proven to be so successful that the CLEO data acquisition group is developing an on line DSP implementing this algorithm, thus making our system less susceptible to coherent pedestal fluctuations.
7 BEAM AND TRACKING SYSTEM
The 800 GeV proton beam was focussed on a thick target (beam dump). Charged particles which emerged were mostly relativistic muons that covered a large area. The emerging particles, mostly relativistic muons, had an r.m.s. spread of 17 cm horizontally and 33 cm vertically with its peak 20 cm below the center of the RICH. Beam intensities varied from 5 to 100 .
The test beam setup consisted of a scintillator hodoscope, two reference MWPCs and the RICH box as sketched in Fig. 15.
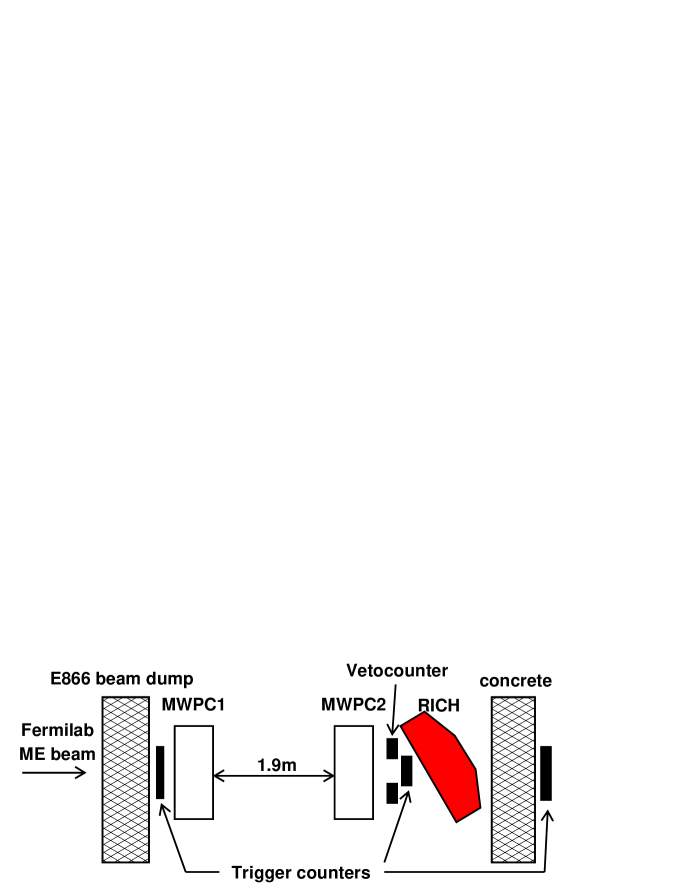
We used two identical modules of wire-proportional tracking chambers to define the position and angle of incident tracks. Each module was 33 cm by 33 cm and consisted of six planes. The wires were spaced at 5 mm intervals in all planes. The wire directions were perpendicular to the beam direction and parallel to the x-axis (horizontal), parallel to the x-axis and displaced by one-half the wire spacing, parallel to the y-axis (vertical), parallel to the y-axis and displaced by one-half the wire spacing, and at +30∘ and -30∘ to the y-axis. The center of the first module was placed 282 cm from the radiator and the second module 84 cm.
This chamber system had an average layer efficiency of 88%. The angular resolution of the charged tracks was 0.73 mr and the position accuracy at the radiator was 1 mm in both x and y directions. The tracking system inaccuracies are not negligable when compared to the Cherenkov angle resolution per track. In particular, the position error at the radiator makes a substantial contribution.
Scintillators in various configurations narrowed the phase space of the beam particles used for our measurements. The angular dispersions of the beam ranged from 3 mr to 6 mr r.m.s., for all the different settings.
8 TRIGGER
The trigger was given by a coincidence of three scintillator counters, with the last one behind a wall of 6 m of concrete to provide a lower momentum cut-off of 3 GeV/c for triggered events (). Additionally, the event was only accepted if there was no hit in an anti-counter system surrounding the acceptance of the trigger telescope and no additional hit in any of the counters in the preceding 100 s and following 3 s to avoid event pile-up due to preamplifier and read-out time constants.
9 PHOTON DETECTOR HIGH VOLTAGE OPERATION
The choice of the operating point of the photon detector wire chambers is driven by the need to optimize the signal-to-noise ratio to maximize the number of detected photons while maintaining high-voltage stability. The stability in chambers with a gas mixture containing TEA is limited by the inherent susceptibility to photon feedback. It calls for the use of a powerful quencher gas like as the main chamber gas component. In addition the high photon absorption capability of limits the sensitive spectral region to above 135 nm, thus reducing chromatic errors on the measurement of the Cherenkov angle.111The TEA quantum efficiency goes to zero above 165 nm. Stable operating conditions can be achieved for gas gains below [4].
At low gains, the gain distribution of our proportional chamber is a simple exponential (Fig. 14). In order to insure that we were measuring the maximum number of photoelectrons possible, we measured the pad gain as a function of wire high voltage and window high voltage using the plane radiator. The results are shown in Fig. 16. In both cases the gain increases exponentially with voltage. Since the wire to cathode spacing is smaller (1 mm) than the wire to window distance (3.5 mm) it is not surprising that the dependence on window voltage is much smaller.


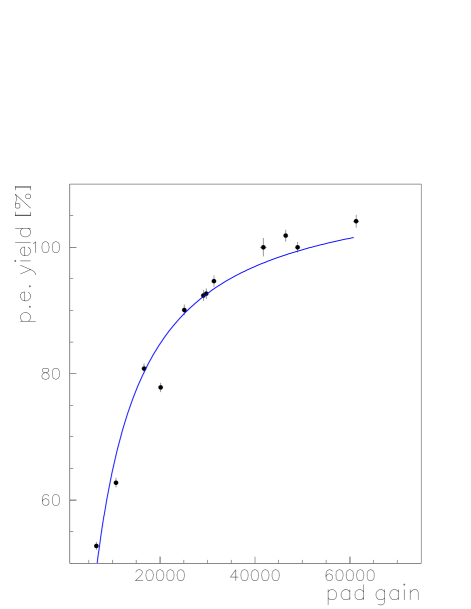
The exponential gain distribution leads to efficiency loss after a lower pulse height threshold is introduced to discriminate electronic noise hits. For our analysis we set this threshold at , which is equivalent to 2000 . The operating voltage for the photon detectors during the test beam was chosen based on the efficiencies obtained with this pulse height threshold during a scan where the pad gain was varied by changing the wire high voltage. The results are shown in Fig. 17. Sufficient efficiency was achieved when the pad gain in the two tested chambers was . We set the high voltages to achieve this gain throughout the test beam measurements.
The operating stability at the voltage required to achieve such a gain was first studied using several full-size chamber prototypes and later during chamber construction, when each chamber was tested for 30 days for high voltage problems. This procedure allowed for a very stable operation of the finished chambers with only one trip exceeding 1 A during the four weeks test beam period and dark currents usually below 30 nA per group of 24 wires.
10 BEAM-TEST RESULTS
10.1 Introduction
Photoelectrons are reconstructed by finding topological clusters of pads with each pad having a pulse height above a 5 noise cut (). The location of the photoelectron is determined by first calculating the naive geometric center-of-gravity and then apply a correction based on the pulse height profile is shown in Fig. 18. This distribution was determined using combination of photon data and charged track data at normal incidence to the photon detectors. At operating voltage, pad multiplicities are 2.2 pads per cluster; there is a significant overlap of photons. On average there are 1.1 photoelectrons per cluster.

From each photoelectron position, the original photon trajectory is optically traced back through all media to the center plane of the radiator, and the Cherenkov angle is reconstructed. Charged tracks through the tracking system are projected to the RICH detector where clusters of pad hits associated with the track are ignored. Other charged track clusters are distinguished from photon clusters by total charge and by the number of pads in the cluster. These charged tracks are usually out of time with the tracking system, because the RICH preamplifier time constants are long.
Data were taken at a variety of incident track angles; in the following discussion the data taken for tracks at an angle of 30∘ from the normal to the plane radiator and at normal incidence to the sawtooth radiator (0∘) are described in detail. The same analysis techniques were used on all data sets.
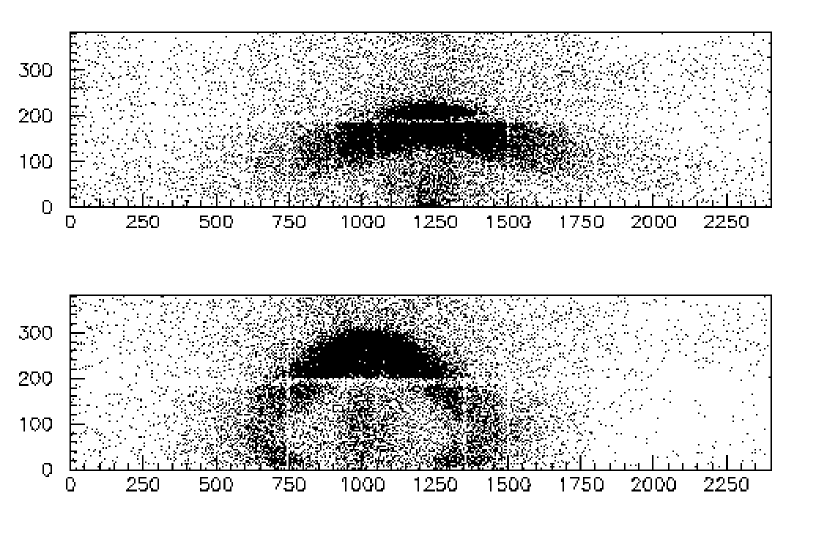
Fig. 19 shows a cumulative event display for all ring images in these two sets of data. For the plane radiator the one arc Cherenkov ring is visible, while for the sawtooth radiator the two arcs are visible, with the lower one largely outside of the fiducial region of the detectors. Acceptance is lowered by this image truncation, and by mechanical transmission losses from construction elements in the detector. The acceptance for contained plane radiator images is about 85%, the maximum realistic acceptance for a full RICH system, while the acceptance for sawtooth images is approximately 50% for this test beam run, because we have only two photon detectors. In the full CLEO setup, the sawtooth acceptance is approximately the same as for the plane radiator.
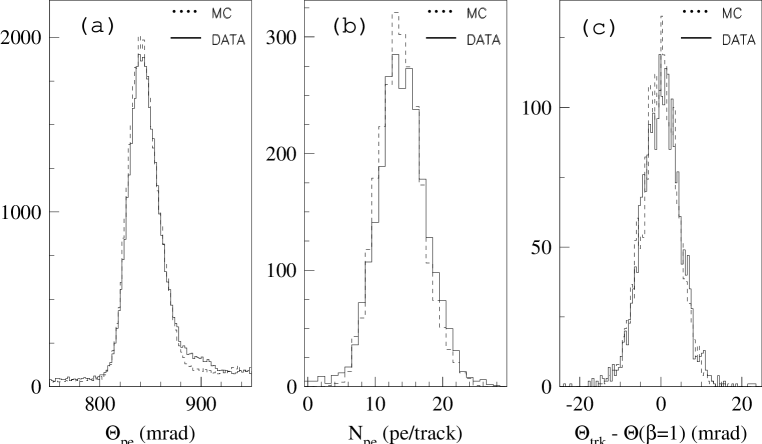
10.2 Results from the Plane Radiator at 30∘ Track Incidence
Results from the analysis of the 30∘ plane radiator data set are shown in Fig. 21; only images confined to a single detector are used. The distribution of Cherenkov angle for single photoelectrons has an asymmetric tail and modest background. It is fit with a lineshape similar to that used by for extracting photon signals from electromagnetic calorimeters [15]. The functional form is
| (2) |
Here is the measured angle, is the “true” (or most likely) angle and is the angular resolution. To use this formula, the parameter is fixed to value of about 5.
The data in Fig. 21 are fit using this signal shape plus a polynomial background function. We find a single photoelectron Cherenkov angle resolution mr. This is consistent with the Monte Carlo estimate of 13.5 mr. Errors quoted are first statistical then systematic, with the latter taken from two different fitting procedures, i.e., two methods of background estimation. The background fraction under the peak is 9.2% . This background is not electronic noise but rather it is principally due to out-of-time hadronic showers from the upstream beam dump that acts as our muon filter; there will be little or no such background in CLEO III. We tested this hypothesis by taking data with a plane radiator at normal track incidence. In this situation the Cherenkov light cannot escape the radiator due to total internal reflection. The hit pattern on the detector for this situation is shown in Fig. 20.

The Cherenkov angle per track is found as the arithmetic mean of all photoelectrons in an image. There is an image cut of and a systematic alignment correction is applied. The resulting distribution of Cherenkov angle per track is fit to a Gaussian, and gives the angle resolution per track mr, which compares favorably with the Monte Carlo estimate of 4.45 mr. The systematic error is estimated from the variation222This variation has a number of root causes, each at the few percent level: the expansion volume transparency was monitored to be above 95%, there are variations in transparency over each radiator face, etc. Hence the systematic error is estimated to be at the 5% level. between different datasets taken at the same track angle, which are repeatable to 5%.
The photoelectron yield per track is extracted from the area under the single photoelectron peak followed by background subtraction. Again systematic errors dominate and are given by different methods of background estimation. (Here the beam-test Monte Carlo makes no prediction for but rather uses the measurement as an input parameter.) This yield exceeds our benchmark of 12 photoelectrons/track.
 |
We can also view the resolution as a function of Npe. Fig. 22 shows the decrease in the track resolution as Npe increases. (Npe has not been background subtracted; we estimate the background as 9%.) The curve is a fit to the function where, and . (These parameters are highly correlated and include all systematic effects, such as tracking errors.)

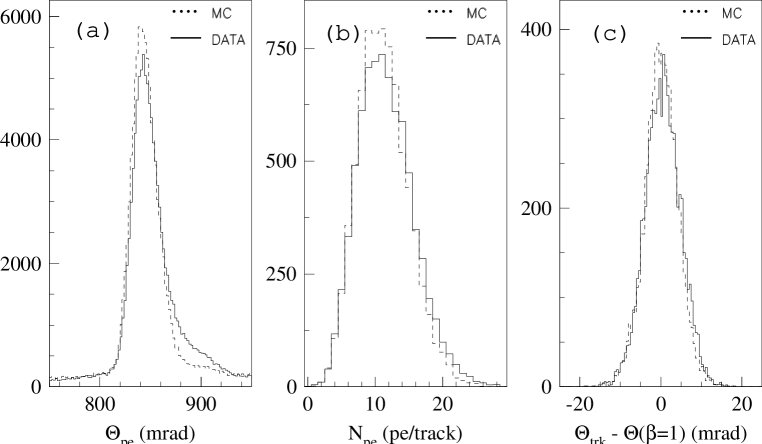
10.3 Sawtooth Radiator Results at Normal Track Incidence
Similar analysis for the 0∘ sawtooth radiator dataset, cf. Fig. 23, gives a single photoelectron Cherenkov angle resolution mr (compared with 11.1 mr from Monte Carlo), an angle resolution per track of mr (4.02 mr from Monte Carlo), and a photoelectron yield per track. The background fraction of 12.0% has been subtracted. Adjusted for full 85% geometric acceptance, becomes 18.8 per track.
 |
10.4 Summary and Discussion of Results
The average observed photon yields for the plane and sawtooth radiators at various incident angles are given in Table 3. The plane data is for full acceptance, while the sawtooth data is given both for observed and extrapolated yields. The statistical errors are negligible in comparison to the systematic errors which we estimate to be 5%.
| Radiator | 0∘ | 10∘ | 20∘ | 30∘ | 40∘ |
|---|---|---|---|---|---|
| plane | 14.1 | 13.3 | 12.3 | ||
| sawtooth (observed) | 10.4 | 10.7 | 10.1 | 9.7 | 9.5 |
| sawtooth (full acceptance) | 18.8 | 19.2 | 17.9 | 16.3 | 15.5 |
| Systematic errors are 5%, statistical errors are much smaller. | |||||
Fig. 24 provides a summary of angular resolution results from all datasets at all incident angles. The measured Cherenkov angle resolution per track from the plane radiator data (denoted by squares) increases as a function of the incident track angle due to the increase in emission-point error.333The Cherenkov angle resolution per track is dominated by chromatic and emission-point errors [4]. The chromatic error is larger at small incident track angles, but they become comparable at large incident track angles. The beam-test Monte Carlo simulation gives the light dashed curve in Fig. 24, which represents the data well.

The per track resolution, e.g. 4.54 mr at 30∘, is somewhat larger than the nave extrapolation from angular resolution per photon and the number of observed photons, i.e. . Monte Carlo studies indicate that the sources of the increased resolution are the MWPC tracking errors (the principal cause, 2.3 mr at 30∘) and the beam background (1.2 mr at 30∘). The tracking errors in this experiment do not change with incident angle to the radiator, since the angle is changed by rotating the RICH box. However, the emission-point error is effectively increased more with larger incident angles to the radiator, due to an incorrect track impact point on the radiator face. In CLEO III the background will be much reduced, and the tracking error contribution will be smaller, though still significant.
We expect that the sawtooth radiator resolution will not be degraded by the tracking errors [11] in CLEO, while the plane radiator resolution is worsened and the degradation increases with dip angle. The tracking system has its poorest resolution in the direction along the electron beam. The sawtooth images are symmetric in this direction, and thus are less sensitive to the tracking errors than the plane radiator images. The tracking errors cause poorer resolution at larger angles.
The measured track resolutions for the sawtooth radiators are higher than predicted by the beam-test Monte Carlo as shown by the heavy dashed curve in Fig. 24. Our simulation shows that this discrepancy is not due to the variation in tooth angle or the actual shape of the radiator surfaces. The relatively large values of the track resolution, above 4 mr, is due to the limited acceptance, caused by having only two photon detectors.
In order to estimate the ultimate performance of this RICH, an extrapolation was made based on the beam-test Monte Carlo. The background and tracking errors are associated only with our beam test, so both were removed from the simulation for this study. The resulting photoelectron yield was then corrected for the geometric acceptance of the beam-test setup and scaled to “full acceptance”, defined as 85% of the solid angle covered by a cylindrical RICH. This correction was applied to the sawtooth data only, as the plane radiator data are already at full acceptance. The result of this extrapolation for the per track resolution for the plane radiator is shown as the light solid curve in Fig. 24, which is flat in track angle and below our benchmark of 4 mr for CLEO III.
For the sawtooth a large acceptance correction needs to be made. The Geometric acceptance is approximately 50% for all track angles. By naive statistical calculation this increases the per track resolution by 35%. Monte Carlo studies show that tracking errors are the next largest contribution (e.g. 1.9 mr at 0∘), and are exacerbated in this configuration because one of the arcs in the image is out of the detector fiducial. The beam background is approximately constant for all track angles (e.g. 1.3 mr at 0∘).
The full acceptance extrapolation for the per track resolution for the sawtooth radiator, is shown as the heavy solid curve in Fig. 24. Here the muon tracking errors and the background have been removed and the photon acceptance of the sawtooth scaled to that of the plane radiator. The expected CLEO III RICH performance will fall somewhere between the beam-test Monte Carlo curve and the “full acceptance” curve.
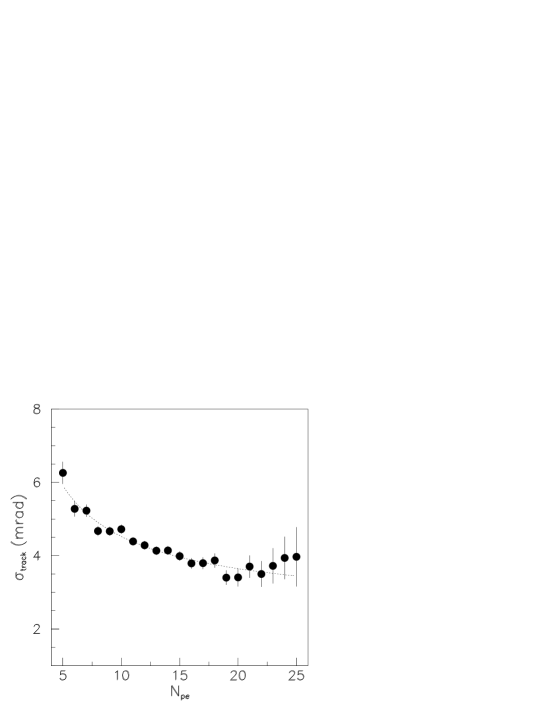
Instead of extrapolating the resolution at the larger projected photoelectron yields, we can view the resolution per track already achieved in this data as a function of photoelectron yield. Fig. 25 shows the Cherenkov resolution per track for the 0∘ sawtooth dataset as a function of photoelectron yield. For the expected yield of 18.8 per track, the Cherenkov resolution is 3.5 mr. This number which contains all experimental effects fits nicely between the best allowable resolution of 3 mr and below the measured average 4.5 mr. Since this curve is derived from the data it automatically takes into account statistical and systematic effects.
In Fig. 26 we show the expectations of the resolution in CLEO III, where we have included the CLEO III tracking errors. The largest source of error for the sawtooth radiator is the chromatic dispersion, which is even larger for the plane radiator. However, the plane radiator also has large contributions from the emission point error (not knowing where in the radiator the photon was emitted) and the tracking error. Averaging over the solid angle the Cherenkov angular resolution will be approximately 4 mr, which is adequate to separate kaons from pions in the two-body decays to or , which have an average difference in Cherenkov angle of 14.4 mr.

11 CONCLUSIONS
A beam test of the first two sectors of the CLEO III RICH Detector has been successfully carried out. The resolution is better at smaller incident track angles and better for sawtooth radiators. The detector operated in a robust manner and will make a useful particle identifier for CLEO III.
For plane radiators we measure a full acceptance yield of between 12-14 photoelectrons, and Cherenkov angular resolutions of 4-5 mr, depending on incident angles between 20∘ and 40∘. Our results are consistent with Monte Carlo expectations taking into account tracking errors and backgrounds.
For sawtooth radiators we must extrapolate to full acceptance. We expect between 18-19 photoelectrons between 0∘ and 20∘ incident track angles. The Monte Carlo under estimates somewhat the measured Cherenkov angular resolution. However, even including an anomalous contribution of 1.4 mr in quadrature with our Monte Carlo expectations of 2.8 mr gives a projected CLEO III resolution of 3.1 mr.
Since the difference in Cherenkov angles is 14.4 mr in the highest momentum range of decays, we expect that this detector will be useful indeed.
ACKNOWLEDGEMENTS
We would like to thank Fermilab for providing us with the dedicated beam time for our test, the Computing Division for its excellent assistance, and our colleagues from E866 for their hospitality in the beamline. Especially helpful were Chuck Brown, Joel Butler, and Ruth Pordes. We appreciate the initial guidance and advice from Jacques Séguinot and Tom Ypsilantis. Franz Muheim and Stephen Playfer were important participants in the early stages of this work. We also thank the U. S. National Science Foundation and the Dept. of Energy for support.
References
- [1] Y. Kubota et al, Nucl. Instr. Meth. A320 (1992) 66.
- [2] M. Artuso, “Progress Towards CLEO III”, to be published in the Proceedings of the XXIX International Conference on High Energy Physics, hep-ex/9811031 (1998).
- [3] S.E. Kopp, Nucl. Instr. Meth. A384 (1996) 61.
- [4] T. Ypsilantis and J. Séguinot, Nucl. Instr. Meth. A343 (1994) 30.
- [5] R. Arnold et al., Nucl. Instr. Meth. A314 (1992) 465.
- [6] J.-L. Guyonnet et al., Nucl. Instr. Meth. A343 (1994) 178.
- [7] J. Séguinot et al., Nucl. Instr. Meth. A350 (1994) 430.
- [8] A. Efimov et al., Nucl. Instr. Meth. A365 (1995) 285.
- [9] B. Ratcliff, Nucl. Instr. and Meth. A343 292 (1994).
- [10] P. G. Wilkinson, Journal of Molecular Spectroscopy, 6, (1961) 1.
- [11] A. Efimov and S. Stone, Nucl. Instr. and Meth. A371 79 (1996).
- [12] E. Nygard et al., Nucl. Instr. Meth. A301 (1991) 506.
- [13] G. Viehhauser et al., Nucl. Instr. Meth. A419 (1998) 577.
- [14] R. Bouclier et al., Nucl. Instr. Meth. A205 (1983) 205.
- [15] T. Skwarnicki, “A Study of the Radiative Cascade Transitions Between the Upsilon-Prime and Upsilon Resonances,” DESY F31-86-02 (thesis, unpublished) (1986).
———-