Hadron production in two-photon collisions at LEP-L3111Presented at the Central European Triangle Symposium on Particle Physics, Zagreb, Croatia, June 17-19, 1999
Abstract
The reaction hadrons is analysed for quasi-real virtual photons using data collected by the L3 detector during the LEP high energy runs at 183 and 189 GeV. Preliminary results on the cross sections hadrons) and hadrons) are given in the interval 5 GeV 145 GeV. The centre-of-mass energy dependence of the two-photon cross section is well described by the universal Regge parametrisation, but with a steeper rise with energy as compared to hadron-hadron cross sections. The data are also compared to the expectations of different theoretical models. To investigate diffractive processes, the elastic process and the inclusive production are studied in the GeV region. In all channels a comparison is made with the Pythia and Phojet Monte Carlo generators.
KFKI-1999-08/A
October 25, 1999
1 INTRODUCTION
The \ee\ra\ee\ra\eehadrons process is a copious source of hadron production at high energies. The hadron system has predominantly a low mass value. A large fraction of the hadrons escape detection due to the large diffractive cross section and the Lorentz boost of the system. For these events, the measured effective mass is smaller than the centre of mass energy of the two interacting photons . In this reaction most of the initial energy is taken by the scattered electrons and positrons. We analyse only data where these are not detected (anti-tagged events).
New results are presented on the total cross section \ee\ra \eehadrons) for the \ee centre of mass energy of \rts= 183 \GeV and \rts= 189 \GeV. The two-photon cross section hadrons) is then derived in the interval 5 145 \GeV. The analysis of the data taken at \rts= 130-161 \GeV has been published [1].
2 TOTAL CROSS-SECTION
2.1 Event selection
Data have been collected with the L3 detector [2, 3] at \rts= 182.72 \GeV with a total integrated luminosity of 51.35 {,d}uring 1997 and at \rts= 189 \GeV with a total integrated luminosity of 171.8 {,d}uring 1998.
Hadronic two-photon events are selected by the following criteria :
-
At least six particles must be detected. A particle can be a track, a photon or a pion cluster in the hadron calorimeter or in the luminosity monitor.
-
The total energy in the electro-magnetic calorimeter is required to be greater than 500 \MeV. The total energy deposited in the calorimeters must be below 40% of the collision energy.
-
An anti-tag condition excludes events with an electromagnetic shower shape and energy greater than 70 \GeV in the luminosity monitor, in a fiducial region of 33-64 mrad. The value of the selected events is thus smaller than 8 , in average .
After selection, the background from beam-gas and beam-wall interactions is found to be negligible. The analysis is limited to events with 5 \GeV. More than 1 million events are selected.
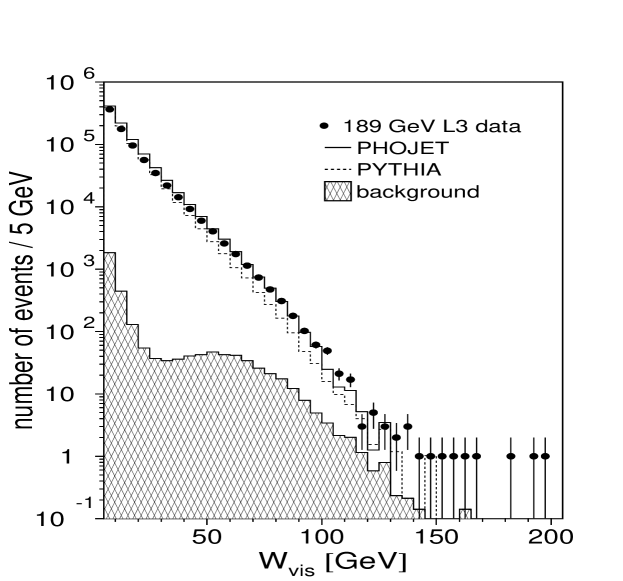
The various hadrons processes are simulated with the Phojet222Phojet version1.05c [4] and Pythia333Pythia version 5.718 and Jetset version 7.408 [5] event generators. The background processes \ee hadrons(), ZZ(), Zee(), We(), , and \ee were simulated and subtracted. At low masses the background is below 1%, dominated by the two-photon production. It increases at high masses, due to annihilation processes, and reaches a maximum of 12% at 145 \GeV. In Figure 1 the spectrum is shown for the \rts= 189 \GeV data. The trigger efficiency is mass dependent, for the \rts= 189 \GeV data it varies from 78% at =5 \GeV to 94% for 80 \GeV.
2.2 Unfolding and efficiency
From the observed distribution of the visible effective mass, , the true hadron mass distribution must be extracted. The number of observed events are then corrected for the efficiency and acceptance of the detector.
The measured spectrum is weakly correlated to the total centre of mass energy of the system because part of the produced particles may go undetected in the forward and backward regions. In order to obtain the Wγγ distribution from the spectrum the method of [6] is used.
After unfolding the events are corrected for detector acceptance and efficiency. There is a systematic difference of 20% between the results obtained with the two Monte Carlo models, which may be attributed to a different modelling of the diffractive interactions which are not easily seen in the detector.
2.3 Cross sections and systematic errors
From the number of events the cross section \ee\ra \eehadrons) is measured. To extract the total cross section of two real photons the photon flux [7] is calculated using the method described in [8] and the hadronic two-photon cross-section is extrapolated to zero Q2 using the form factors of [9]. Depending on the form factors used, this calculation may vary by 10% [8].
The systematic errors are evaluated for each bin. The main sources are:
-
uncertainties on the trigger are 5% at = 5 \GeV and 2% at = 145 \GeV.
-
uncertainties on the energy scale of the calorimeters excluding the clusters measured in the luminosity calorimeter are .
-
the cut on the number of particles gives a systematic error of 10% at = 5 \GeV and 1% at = 145 \GeV.
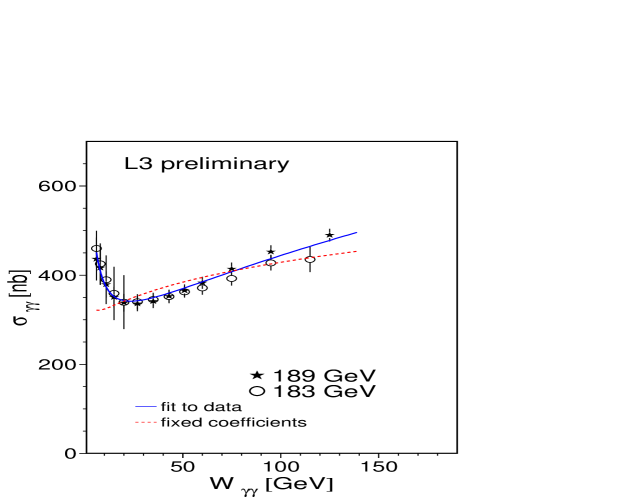
The mass dependent statistical and systematic errors are added in quadrature in each bin. The uncertainty related to the Monte Carlo model is not added to the systematic errors, but the complete analysis is done for Pythia as well as for Phojet. The discrepancy on the cross section reflects the difference on selection efficiency given by the two generators. The hadrons cross sections unfolded with Phojet at \rts= 183 \GeV and \rts= 189 \GeV are compared in Figure 2. The data are compatible within systematic errors.
2.4 Regge parametrisation
Total hadronic cross sections show a characteristic steep decrease in the region of low centre of mass energy followed by a slow rise at high energies. A. Donnachie and P.V. Landshoff [10] showed that a parametrisation of the form
| (1) |
can account for the energy behaviour of all total cross sections, the powers of being universal. In a recent compilation of the total cross section data [11] a fit of Equation 1 for all hadron total cross sections gives a result compatible with the universal values of and . The coefficients and are process and dependent.
This expression may also be valid for the two-photon total hadronic cross section. The data are fitted to Equation 1 with the parameters and fixed to the world average value. The coefficients and are highly correlated, the correlation being -0.8. The fit does not represent well the energy dependence, we therefore try a fit with , and as free parameters. The fits are shown in Figure 2 and the results given in Table 1. The obtained value is more than a factor two higher than the universal value. In PDG 1996 [12] a different universal fit was given, but with these values the factor two difference is conserved, showing that the fitted value of is strongly correlated to . We try to avoid this by fitting only the Pomeron exchange for sufficiently high values. The results, using different minimum values of and different Monte Carlo generators for unfolding are listed in Table 1. We observe also that the value of increases by increasing the lower mass cutoff, thus indicating a somewhat variable slope due to the onset of QCD phenomena.
| fit | interval | A | B | fixed | C.L. | |
|---|---|---|---|---|---|---|
| PDG98 (Phojet) | 5-145 \GeV | 50.9. | 1153.114. | 0.34 | 0.2220.019 | 0.995 |
| PDG98 (Phojet) | 5-145 \GeV | 172.3. | 325.65. | 0.34 | 0.095 fixed | 0.000034 |
| PDG96 (Phojet) | 5-145 \GeV | 90.10. | 1519.169. | 0.468 | 0.1680.012 | 0.895 |
| PDG98 (Pythia) | 5-145 \GeV | 78.10. | 753.116. | 0.34 | 0.2060.013 | 0.61 |
| (Phojet) | 13-145 \GeV | 23010 | — | — | 0.0700.006 | |
| (Phojet) | 31-145 \GeV | 1508 | — | — | 0.1180.007 | 0.06 |
| (Phojet) | 39-145 \GeV | 1268 | — | — | 0.1360.008 | 0.45 |
| (Phojet) | 47-145 \GeV | 1159 | — | — | 0.1460.010 | 0.46 |
| (Pythia) | 13-145 \GeV | 1857 | — | — | 0.1180.005 | |
| (Pythia) | 31-145 \GeV | 1456 | — | — | 0.1460.006 | 0.05 |
| (Pythia) | 39-145 \GeV | 1357 | — | — | 0.1530.006 | 0.04 |
| (Pythia) | 47-145 \GeV | 1319 | — | — | 0.1560.010 | 0.14 |
2.5 Models for total cross sections
Three models describing the total cross section are compared to our data in Figure 3.
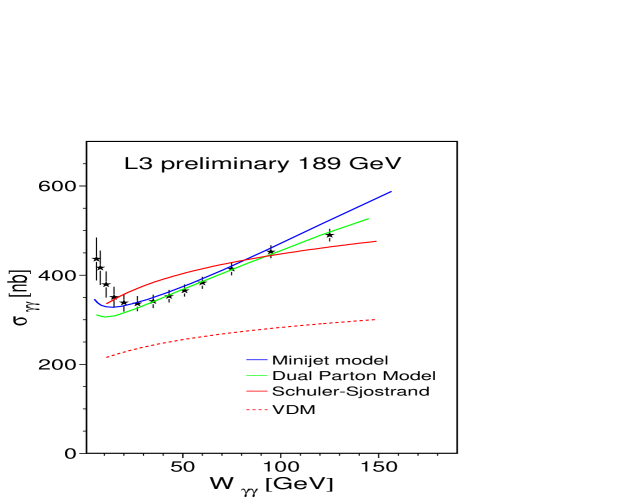
The model of G.A. Schuler and T. Sjöstrand [13] aims at a smooth superposition of hadron-like and point-like photon interactions. Following their discussion, one sees that the fluctuation of both photons into vector mesons is not sufficient to describe the data. Adding the point-like splitting of the photon to q pairs, the cross section increases to values comparable to our data points.
The cross sections predicted by R. Engel and J. Ranft [4] are in good agreement with the data. In their model p and pp data are used to fix the couplings of the Pomeron and of the Reggeon to the q fluctuation of the photon. The cross sections are then calculated in the framework of a Dual Parton Model, with the unitarization constraint [4].
The calculation of the mini-jet model of R.M. Godbole and G. Pancheri [14] ascribes to QCD the task of calculating the average number of semi-hard collisions , which is a function of the impact parameter and of the centre of mass energy . The collisions are assumed to be independent of each other at a fixed value of the impact parameter and to have a Poisson type distribution around the average value. In Figure 3 the parameters which fit best the photoproduction data are used ( 2 \GeV and 0.66 \GeV), together with the GRV parton density function.
3 EXCLUSIVE PAIR PRODUCTION
Since photons can fluctuate directly into neutral Vector Mesons, the cross-section is expected to remain large at high centre-of-mass energies [15] (”elastic” scattering). A measurement performed at large , above the well known but still controversial threshold enhancement [16], can help to understand the behaviour of quasi-elastic and diffractive processes.
The exclusive \ee\ra \ee events are selected by requiring four tracks, with a distance of closest approach to the nominal vertex smaller than 1 mm in the transverse plane, total charge equal to zero and missing transverse momentum squared smaller than 0.05 \GeV2. In the \rts= 189 \GeV sample, we have selected 14000 events. The mass spectrum is dominated by the low mass threshold enhancement and agrees well with previous measurements [16].
There are 843 events with a mass \GeV. The four tracks in each event give rise to four possible neutral combinations. The equal charge and combinations are used to subtract the combinatorial background. Figure 4 shows the mass distribution after subtraction of the equal charge combinations. A peak in the mass range is visible, a Breit-Wigner fit gives M \MeV, \MeV. A second enhancement is also visible between 1.2 and 1.4 GeV, which corresponds to the resonance, the Breit-Wigner fit gives M \MeV, \MeV. Since the cannot be produced diffractively, this indicates the presence of non-diffractive processes. A region is defined by requiring both simultaneous combinations to have masses below 1.2 \GeV. The distribution of the events is shown in Figure 5. Exclusive \ra VV events were generated with the Pythia Monte Carlo, the dominant channel being \ra . Pythia expects too many events at high masses, while the mass-dependence of Phojet is too steep.

4 INCLUSIVE PRODUCTION
We study single diffractive dissociation in the inclusive process with using data collected at GeV, corresponding to . This process yields a larger number of events compared to the exclusive production at the price of higher background. Higher invariant masses are accessible, but events can not be fully reconstructed.
We select events with GeV and candidates with GeV and in the laboratory. Within this kinematic region the detection efficiency is uniform.
Diffractive events in general contain a rapidity gap that separates the final state particles originating from the two incoming photons. In order to separate non-diffractive production, we require the candidate to have the largest or smallest rapidity in the event, excluding its decay products.
Background is subtracted in two steps. First all combinations of two equal-charge tracks are treated as candidates, subject to the same cuts, and subtracted from the mass distribution of real candidates with opposite-charged tracks. The resulting mass distribution is fitted with a Breit-Wigner curve with fixed parameters MeV and MeV and a background of the form .
| cut | GeV | GeV | GeV | |
|---|---|---|---|---|
| Data | 202.4 40.0 | 77.1 23.9 | 34.3 6.8 | |
| Pythia | 3.0 GeV | 123.7 15.6 | 108.7 12.5 | 74.3 8.0 |
| Pythia VV | 2.5 GeV | 98.6 7.6 | 82.6 6.8 | 35.6 2.3 |
| Phojet | 3.0 GeV | 12.9 10.9 | 6.2 5.9 | — |
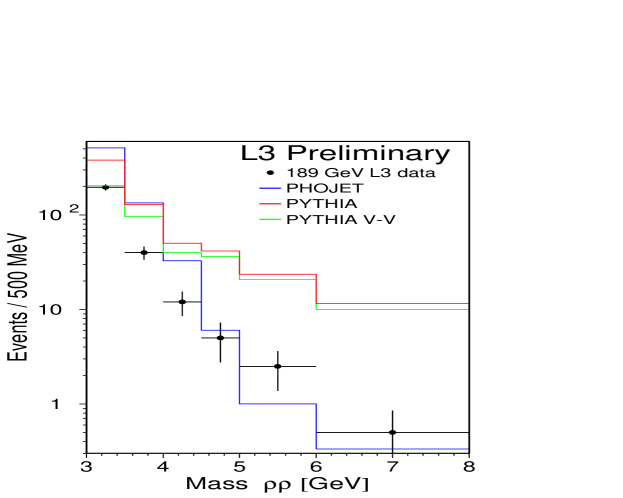
The number of events observed after background subtraction is shown in Table 2, together with the numbers expected from three Monte Carlo samples: full Pythia , Pythia containing only diffractive , with , and full Phojet . The lower value of the generated is also given in the table.
Figure 6 shows the mass distribution of the candidates for GeV. The strong signal is well reproduced by Pythia, while it is absent in Phojet.
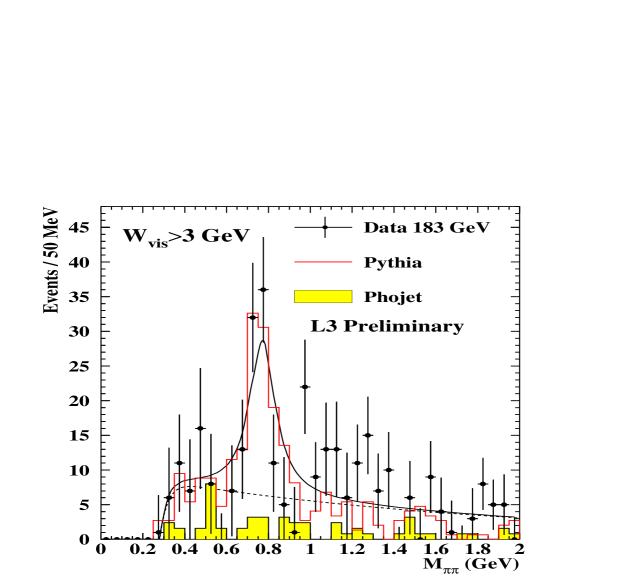
To test the diffractive nature of our sample, the decay angle of the candidates is studied. Conservation of the s-channel helicity implies transverse polarization for diffractive production from photons, while non-diffractive production is unpolarized. We define as the angle between the momentum in the frame and the momentum in the rest frame as measured by the visible hadronic system. This angle is not the true decay angle, but Monte Carlo simulations show that the resolution is . A fit of , corresponding to purely transverse polarization, gives (77% CL), while a fit with a constant, corresponding to unpolarized decay, gives and a confidence level of 19%.
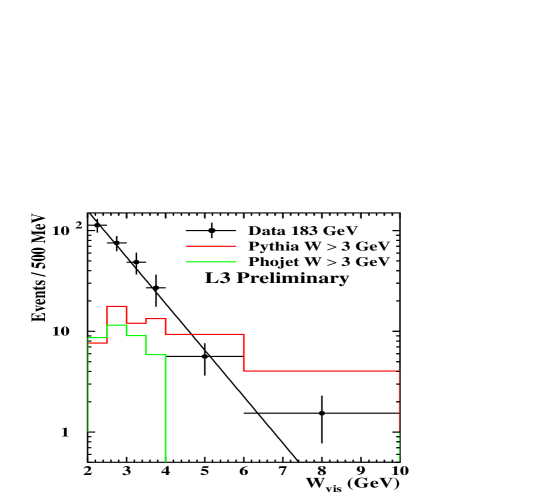
Figure 7 shows the number of events observed after background subtraction as a function of , together with predictions from Pythia and Phojet. Note that both Monte Carlo samples have a generator level cut at GeV, so in the first two bins they are expected to be low. Phojet predicts too few events, while the Pythia distribution is too flat.
The distribution after correction for detector effects using the sample of vector meson pairs generated by Pythia was fitted between 1 GeV2 3 GeV2 by an exponential function, and the preliminary slope parameter is .
5 CONCLUSIONS
The cross section \ee\ra \eehadrons) for untagged events is measured at LEP, with the L3 detector, at \rts = 183 and 189 \GeV, in the interval 5 \GeV 145 \GeV. The real photon total cross section hadrons), derived from the data, increases as a function of , faster than expected from the universal fit of hadron-hadron total cross-sections. The observed energy dependence can be reproduced by QCD models which include hard scattering of the partons inside the photon.
An analysis of \ra and events has been performed. In the region 3 \GeV 10 \GeV both Pythia and Phojet fail to reproduce the data : the energy dependence of production is too flat in Pythia and too steep in Phojet. In the sample the is transversely polarised as expected by s-channel helicity conservation. Almost no is produced by Phojet in the studied kinematical region.
ACKNOWLEDGEMENTS
I would like to express my gratitude to Maria N. Kienzle-Focacci and Evelyne Delmeire for providing their results and for useful discussions and encouragement.
This work was partly supported by the Hungarian Scientific Research Fund OTKA under contract numbers F-023259 and T-019181. Participation at this conference was supported by the Eötvös University and the conference organisers.
References
- [1] L3 Coll., M. Acciari et al.,\PLB 408 (1997) 450.
- [2] L3 Coll., B. Adeva et al., \NIMA 289 (1990) 35.
- [3] M. Acciarri et al., \NIMA 351 (1994) 300.
-
[4]
R. Engel, Z. Phys. C 66 (1995) 203 ;
R. Engel and J. Ranft, \PRD 54 (1996) 4246;
and R. Engel private communication. - [5] T. Sjöstrand, Comput. Phys. Commun. 82 (1994) 74.
- [6] G. D’Agostini, \NIMA 362 (1995) 487.
- [7] V.M. Budnev, I.F. Ginzburg, G.V. Meledin and V.G. Serbo, Phys. Rep. C 15 (1974) 181.
-
[8]
G.A. Schuler, Improving the equivalent-photon
approximation in electron-positron collisions, hep-ph/9610406,
CERN-TH/96-297.
We wish to thank the author for providing us with the numerical integration program of the luminosity function. - [9] J.J. Sakurai and D. Schildknecht, \PLB 40 (1972) 121.
- [10] A. Donnachie and P.V. Landshoff, \PLB 296 (1992) 227.
- [11] Review of Particle Physics, Eur. Phys. J. C 3 (1998) 1.
- [12] Review of Particle Physics, \PRD 54 (1996) 1.
-
[13]
G.A. Schuler and T. Sjöstrand, \NPB 407 (1993) 539 ;
G.A. Schuler and T. Sjöstrand, Z. Phys. C 73 (1997) 677. -
[14]
R.M. Godbole and G. Pancheri, hep-ph/ 9903331 (1999);
A. Corsetti, R.M. Godbole and G. Pancheri, \PLB 435 (1998) 441. - [15] V.L. Chernyak and I.R. Zhitnitsky, \NPB 222 (1983) 382.
-
[16]
ARGUS Coll., H. Albrecht et al., Z. Phys. C 50 (1991) 1;
PLUTO Coll., Berger et al., Z. Phys. C 38 (1988) 521;
TPC/2 Coll., Aihara et al., \PRD 37 (1988) 28.