Measurement of diffractive photoproduction of vector mesons at large momentum transfer at HERA
Elastic and proton–dissociative photoproduction of , and vector mesons (, , respectively) have been measured in interactions at HERA up to GeV2, where is the four-momentum transfer squared at the photon–vector meson vertex. The analysis is based on a data sample in which photoproduction reactions were tagged by detection of the scattered positron in a special-purpose calorimeter. This limits the photon virtuality, , to values less than 0.01 GeV2, and selects a average center-of-mass energy of = 94 GeV. Results for the differential cross sections, , for , and mesons are presented and compared to the results of recent QCD calculations. Results are also presented for the -dependence of the pion-pair invariant-mass distribution in the mass region and of the spin-density matrix elements determined from the decay-angle distributions. The Pomeron trajectory has been derived from measurements of the dependence of the elastic differential cross sections for both and mesons.
DESY 99-160
October 1999
The ZEUS Collaboration
J. Breitweg,
S. Chekanov,
M. Derrick,
D. Krakauer,
S. Magill,
B. Musgrave,
A. Pellegrino,
J. Repond,
R. Stanek,
R. Yoshida
Argonne National Laboratory, Argonne, IL, USA p
M.C.K. Mattingly
Andrews University, Berrien Springs, MI, USA
G. Abbiendi,
F. Anselmo,
P. Antonioli,
G. Bari,
M. Basile,
L. Bellagamba,
D. Boscherini1,
A. Bruni,
G. Bruni,
G. Cara Romeo,
G. Castellini2,
L. Cifarelli3,
F. Cindolo,
A. Contin,
N. Coppola,
M. Corradi,
S. De Pasquale,
P. Giusti,
G. Iacobucci,
G. Laurenti,
G. Levi,
A. Margotti,
T. Massam,
R. Nania,
F. Palmonari,
A. Pesci,
A. Polini,
G. Sartorelli,
Y. Zamora Garcia4,
A. Zichichi
University and INFN Bologna, Bologna, Italy f
C. Amelung,
A. Bornheim,
I. Brock,
K. Coböken,
J. Crittenden,
R. Deffner,
H. Hartmann,
K. Heinloth,
E. Hilger,
H.-P. Jakob,
A. Kappes,
U.F. Katz,
R. Kerger,
E. Paul,
J. Rautenberg5,
H. Schnurbusch,
A. Stifutkin,
J. Tandler,
K.Ch. Voss,
A. Weber,
H. Wieber
Physikalisches Institut der Universität Bonn,
Bonn, Germany c
D.S. Bailey,
O. Barret,
N.H. Brook6,
B. Foster7,
G.P. Heath,
H.F. Heath,
J.D. McFall,
D. Piccioni,
E. Rodrigues,
J. Scott,
R.J. Tapper
H.H. Wills Physics Laboratory, University of Bristol,
Bristol, U.K. o
M. Capua,
A. Mastroberardino,
M. Schioppa,
G. Susinno
Calabria University,
Physics Dept.and INFN, Cosenza, Italy f
H.Y. Jeoung,
J.Y. Kim,
J.H. Lee,
I.T. Lim,
K.J. Ma,
M.Y. Pac8
Chonnam National University, Kwangju, Korea h
A. Caldwell,
W. Liu,
X. Liu,
B. Mellado,
R. Sacchi,
S. Sampson,
F. Sciulli
Columbia University, Nevis Labs.,
Irvington on Hudson, N.Y., USA q
J. Chwastowski,
A. Eskreys,
J. Figiel,
K. Klimek,
K. Olkiewicz,
M.B. Przybycień,
P. Stopa,
L. Zawiejski
Inst. of Nuclear Physics, Cracow, Poland j
L. Adamczyk9,
B. Bednarek,
K. Jeleń,
D. Kisielewska,
A.M. Kowal,
T. Kowalski,
M. Przybycień,
E. Rulikowska-Zarȩbska,
L. Suszycki,
J. Zaja̧c
Faculty of Physics and Nuclear Techniques,
Academy of Mining and Metallurgy, Cracow, Poland j
A. Kotański
Jagellonian Univ., Dept. of Physics, Cracow, Poland k
L.A.T. Bauerdick,
U. Behrens,
J.K. Bienlein,
C. Burgard10,
K. Desler,
G. Drews,
A. Fox-Murphy, U. Fricke,
F. Goebel,
P. Göttlicher,
R. Graciani,
T. Haas,
W. Hain,
G.F. Hartner,
D. Hasell11,
K. Hebbel,
K.F. Johnson12,
M. Kasemann13,
W. Koch,
U. Kötz,
H. Kowalski,
L. Lindemann14,
B. Löhr,
M. Martínez, M. Milite,
T. Monteiro15,
M. Moritz,
D. Notz,
F. Pelucchi,
M.C. Petrucci,
K. Piotrzkowski15,
M. Rohde,
P.R.B. Saull,
A.A. Savin,
U. Schneekloth,
F. Selonke,
M. Sievers,
S. Stonjek,
E. Tassi,
G. Wolf,
U. Wollmer,
C. Youngman,
W. Zeuner
Deutsches Elektronen-Synchrotron DESY, Hamburg, Germany
C. Coldewey,
H.J. Grabosch,
A. Lopez-Duran Viani,
A. Meyer,
S. Schlenstedt,
P.B. Straub
DESY Zeuthen, Zeuthen, Germany
G. Barbagli,
E. Gallo,
P. Pelfer
University and INFN, Florence, Italy f
G. Maccarrone,
L. Votano
INFN, Laboratori Nazionali di Frascati, Frascati, Italy f
A. Bamberger,
S. Eisenhardt16,
P. Markun,
H. Raach,
S. Wölfle
Fakultät für Physik der Universität Freiburg i.Br.,
Freiburg i.Br., Germany c
P.J. Bussey,
A.T. Doyle,
S.W. Lee,
N. Macdonald,
G.J. McCance,
D.H. Saxon,
L.E. Sinclair,
I.O. Skillicorn,
R. Waugh
Dept. of Physics and Astronomy, University of Glasgow,
Glasgow, U.K. o
I. Bohnet,
N. Gendner, U. Holm,
A. Meyer-Larsen,
H. Salehi,
K. Wick
Hamburg University, I. Institute of Exp. Physics, Hamburg,
Germany c
A. Garfagnini,
I. Gialas17,
L.K. Gladilin18,
D. Kçira19,
R. Klanner, E. Lohrmann,
G. Poelz,
F. Zetsche
Hamburg University, II. Institute of Exp. Physics, Hamburg,
Germany c
R. Goncalo,
K.R. Long,
D.B. Miller,
A.D. Tapper,
R. Walker
Imperial College London, High Energy Nuclear Physics Group,
London, U.K. o
U. Mallik,
S.M. Wang
University of Iowa, Physics and Astronomy Dept.,
Iowa City, USA p
P. Cloth,
D. Filges
Forschungszentrum Jülich, Institut für Kernphysik,
Jülich, Germany
T. Ishii,
M. Kuze,
K. Nagano,
K. Tokushuku20,
S. Yamada,
Y. Yamazaki
Institute of Particle and Nuclear Studies, KEK,
Tsukuba, Japan g
S.H. Ahn,
S.H. An,
S.J. Hong,
S.B. Lee,
S.W. Nam21,
S.K. Park
Korea University, Seoul, Korea h
H. Lim,
I.H. Park,
D. Son
Kyungpook National University, Taegu, Korea h
F. Barreiro,
G. García,
C. Glasman22,
O. Gonzalez,
L. Labarga,
J. del Peso,
I. Redondo23,
J. Terrón
Univer. Autónoma Madrid,
Depto de Física Teórica, Madrid, Spain n
M. Barbi, F. Corriveau,
D.S. Hanna,
A. Ochs,
S. Padhi,
M. Riveline,
D.G. Stairs,
M. Wing
McGill University, Dept. of Physics,
Montréal, Québec, Canada b
T. Tsurugai
Meiji Gakuin University, Faculty of General Education, Yokohama, Japan
V. Bashkirov24,
B.A. Dolgoshein
Moscow Engineering Physics Institute, Moscow, Russia l
G.L. Bashindzhagyan,
P.F. Ermolov,
Yu.A. Golubkov,
L.A. Khein,
N.A. Korotkova,
I.A. Korzhavina,
V.A. Kuzmin,
O.Yu. Lukina,
A.S. Proskuryakov,
L.M. Shcheglova,
A.N. Solomin,
S.A. Zotkin
Moscow State University, Institute of Nuclear Physics,
Moscow, Russia m
C. Bokel, M. Botje,
N. Brümmer,
J. Engelen,
E. Koffeman,
P. Kooijman,
A. van Sighem,
H. Tiecke,
N. Tuning,
J.J. Velthuis,
W. Verkerke,
J. Vossebeld,
L. Wiggers,
E. de Wolf
NIKHEF and University of Amsterdam, Amsterdam, Netherlands i
B. Bylsma,
L.S. Durkin,
J. Gilmore,
C.M. Ginsburg,
C.L. Kim,
T.Y. Ling,
P. Nylander25
Ohio State University, Physics Department,
Columbus, Ohio, USA p
S. Boogert,
A.M. Cooper-Sarkar,
R.C.E. Devenish,
J. Große-Knetter26,
T. Matsushita,
O. Ruske,
M.R. Sutton,
R. Walczak
Department of Physics, University of Oxford,
Oxford U.K. o
A. Bertolin,
R. Brugnera,
R. Carlin,
F. Dal Corso,
S. Dondana,
U. Dosselli,
S. Dusini,
S. Limentani,
M. Morandin,
M. Posocco,
L. Stanco,
R. Stroili,
C. Voci
Dipartimento di Fisica dell’ Università and INFN,
Padova, Italy f
L. Iannotti27,
B.Y. Oh,
J.R. Okrasiński,
W.S. Toothacker,
J.J. Whitmore
Pennsylvania State University, Dept. of Physics,
University Park, PA, USA q
Y. Iga
Polytechnic University, Sagamihara, Japan g
G. D’Agostini,
G. Marini,
A. Nigro
Dipartimento di Fisica, Univ. ’La Sapienza’ and INFN,
Rome, Italy
C. Cormack,
J.C. Hart,
N.A. McCubbin,
T.P. Shah
Rutherford Appleton Laboratory, Chilton, Didcot, Oxon,
U.K. o
D. Epperson,
C. Heusch,
H.F.-W. Sadrozinski,
A. Seiden,
R. Wichmann,
D.C. Williams
University of California, Santa Cruz, CA, USA p
N. Pavel
Fachbereich Physik der Universität-Gesamthochschule
Siegen, Germany c
H. Abramowicz28,
S. Dagan29,
S. Kananov29,
A. Kreisel,
A. Levy29
Raymond and Beverly Sackler Faculty of Exact Sciences,
School of Physics, Tel-Aviv University,
Tel-Aviv, Israel e
T. Abe,
T. Fusayasu,
K. Umemori,
T. Yamashita
Department of Physics, University of Tokyo,
Tokyo, Japan g
R. Hamatsu,
T. Hirose,
M. Inuzuka,
S. Kitamura30,
T. Nishimura
Tokyo Metropolitan University, Dept. of Physics,
Tokyo, Japan g
M. Arneodo31,
N. Cartiglia,
R. Cirio,
M. Costa,
M.I. Ferrero,
S. Maselli,
V. Monaco,
C. Peroni,
M. Ruspa,
A. Solano,
A. Staiano
Università di Torino, Dipartimento di Fisica Sperimentale
and INFN, Torino, Italy f
M. Dardo
II Faculty of Sciences, Torino University and INFN -
Alessandria, Italy f
D.C. Bailey,
C.-P. Fagerstroem,
R. Galea,
T. Koop,
G.M. Levman,
J.F. Martin,
R.S. Orr,
S. Polenz,
A. Sabetfakhri,
D. Simmons
University of Toronto, Dept. of Physics, Toronto, Ont.,
Canada a
J.M. Butterworth, C.D. Catterall,
M.E. Hayes,
E.A. Heaphy,
T.W. Jones,
J.B. Lane,
B.J. West
University College London, Physics and Astronomy Dept.,
London, U.K. o
J. Ciborowski,
R. Ciesielski,
G. Grzelak,
R.J. Nowak,
J.M. Pawlak,
R. Pawlak,
B. Smalska,
T. Tymieniecka,
A.K. Wróblewski,
J.A. Zakrzewski,
A.F. Żarnecki
Warsaw University, Institute of Experimental Physics,
Warsaw, Poland j
M. Adamus,
T. Gadaj
Institute for Nuclear Studies, Warsaw, Poland j
O. Deppe,
Y. Eisenberg29,
D. Hochman,
U. Karshon29
Weizmann Institute, Department of Particle Physics, Rehovot,
Israel d
W.F. Badgett,
D. Chapin,
R. Cross,
C. Foudas,
S. Mattingly,
D.D. Reeder,
W.H. Smith,
A. Vaiciulis32,
T. Wildschek,
M. Wodarczyk
University of Wisconsin, Dept. of Physics,
Madison, WI, USA p
A. Deshpande,
S. Dhawan,
V.W. Hughes
Yale University, Department of Physics,
New Haven, CT, USA p
S. Bhadra,
J.E. Cole,
W.R. Frisken,
R. Hall-Wilton,
M. Khakzad,
S. Menary,
W.B. Schmidke
York University, Dept. of Physics, Toronto, Ont.,
Canada a
1 now visiting scientist at DESY
2 also at IROE Florence, Italy
3 now at Univ. of Salerno and INFN Napoli, Italy
4 supported by Worldlab, Lausanne, Switzerland
5 drafted to the German military service
6 PPARC Advanced fellow
7 also at University of Hamburg, Alexander von
Humboldt Research Award
8 now at Dongshin University, Naju, Korea
9 supported by the Polish State Committee for
Scientific Research, grant No. 2P03B14912
10 now at Barclays Capital PLC, London
11 now at Massachusetts Institute of Technology, Cambridge, MA,
USA
12 visitor from Florida State University
13 now at Fermilab, Batavia, IL, USA
14 now at SAP A.G., Walldorf, Germany
15 now at CERN
16 now at University of Edinburgh, Edinburgh, U.K.
17 visitor of Univ. of Crete, Greece,
partially supported by DAAD, Bonn - Kz. A/98/16764
18 on leave from MSU, supported by the GIF,
contract I-0444-176.07/95
19 supported by DAAD, Bonn - Kz. A/98/12712
20 also at University of Tokyo
21 now at Wayne State University, Detroit
22 supported by an EC fellowship number ERBFMBICT 972523
23 supported by the Comunidad Autonoma de Madrid
24 now at Loma Linda University, Loma Linda, CA, USA
25 now at Hi Techniques, Inc., Madison, WI, USA
26 supported by the Feodor Lynen Program of the Alexander
von Humboldt foundation
27 partly supported by Tel Aviv University
28 an Alexander von Humboldt Fellow at University of Hamburg
29 supported by a MINERVA Fellowship
30 present address: Tokyo Metropolitan University of
Health Sciences, Tokyo 116-8551, Japan
31 now also at Università del Piemonte Orientale, I-28100 Novara, Italy
32 now at University of Rochester, Rochester, NY, USA
| a | supported by the Natural Sciences and Engineering Research Council of Canada (NSERC) |
|---|---|
| b | supported by the FCAR of Québec, Canada |
| c | supported by the German Federal Ministry for Education and Science, Research and Technology (BMBF), under contract numbers 057BN19P, 057FR19P, 057HH19P, 057HH29P, 057SI75I |
| d | supported by the MINERVA Gesellschaft für Forschung GmbH, the German Israeli Foundation, and by the Israel Ministry of Science |
| e | supported by the German-Israeli Foundation, the Israel Science Foundation, the U.S.-Israel Binational Science Foundation, and by the Israel Ministry of Science |
| f | supported by the Italian National Institute for Nuclear Physics (INFN) |
| g | supported by the Japanese Ministry of Education, Science and Culture (the Monbusho) and its grants for Scientific Research |
| h | supported by the Korean Ministry of Education and Korea Science and Engineering Foundation |
| i | supported by the Netherlands Foundation for Research on Matter (FOM) |
| j | supported by the Polish State Committee for Scientific Research, grant No. 115/E-343/SPUB/P03/154/98, 2P03B03216, 2P03B04616, 2P03B10412, 2P03B03517, and by the German Federal Ministry of Education and Science, Research and Technology (BMBF) |
| k | supported by the Polish State Committee for Scientific Research (grant No. 2P03B08614 and 2P03B06116) |
| l | partially supported by the German Federal Ministry for Education and Science, Research and Technology (BMBF) |
| m | supported by the Fund for Fundamental Research of Russian Ministry for Science and Education and by the German Federal Ministry for Education and Science, Research and Technology (BMBF) |
| n | supported by the Spanish Ministry of Education and Science through funds provided by CICYT |
| o | supported by the Particle Physics and Astronomy Research Council |
| p | supported by the US Department of Energy |
| q | supported by the US National Science Foundation |
1 Introduction
The study of exclusive diffractive reactions at HERA has shown that when (photon virtuality) or the mass scale involved is large, the cross section increases with energy faster than expected for soft processes [1, 2]. The rise is consistent with predictions from models based on perturbative QCD (pQCD) in which and mass are used as the perturbative scale. It is expected that, for diffractive vector-meson photoproduction, the four-momentum transfer squared, , between the photon and the final-state vector meson may also serve as a hard scale, provided is large [3]. In the present paper, this hypothesis is studied by measuring diffractive vector-meson photoproduction as a function of and by confronting the data with the predictions of models based on pQCD, which should be applicable in the presence of a hard scale. In addition, the data at lower are compared to predictions of models expected to be valid for soft processes. This provides a means to study the transition between the soft, non-perturbative, and the hard, perturbative, regimes of QCD [4]. A detailed study of the onset of the pQCD regime should give important insight into the structure of strong interactions at hard scales as well as improve our understanding of soft phenomena in QCD.
Vector mesons can be diffractively photoproduced via two processes. In one of them, the target proton remains intact and the reaction is called exclusive (or elastic),
| (1) |
In the other process, the proton dissociates into a higher mass nucleonic state and the reaction is called proton-dissociative,
| (2) |
Reaction (1) is called elastic in the framework of the vector-dominance model (VDM) [5], in which the photon fluctuates into a virtual vector meson which in turn scatters elastically from the target proton [6]. This reaction has been studied over a wide range of center-of-mass energies GeV [1, 6]. The proton-dissociative reaction (2) has been studied at low energies [7] and information at high has been obtained recently [8].
In this study, reactions (1) and (2) are investigated with the ZEUS detector at HERA by measuring the processes and , where or , and is a system with mass GeV. The scattered positron was detected in an electromagnetic calorimeter close to the beamline at a distance of 44 m from the interaction point in the direction of the outgoing positron. This ensured that the virtuality of the exchanged photon is very small ( 0.01 GeV2) and that can be well approximated by the transverse momentum squared of the vector meson.
In the present paper, the pQCD [9, 10, 11, 12, 13, 14] and Regge [15] based approaches to vector-meson production are described. Then the measurements of elastic and proton-dissociative photoproduction of the and mesons are presented. Finally, the results are compared with models and a summary of the conclusions is given.
2 Models
2.1 The pQCD approach – hard scale models
In models based on pQCD [9, 10, 11, 12, 13, 14], the diffractive photoproduction of a vector meson from a proton can be viewed in the proton rest frame as a three-step process: the photon fluctuates into a state; the pair scatters on the proton target; and the scattered pair becomes a vector meson. The fluctuation is described in terms of the photon wave-function derived from QCD. The interaction of the pair with the proton is mediated in the lowest order by the exchange of two gluons in a color-singlet state. In the leading logarithmic approximation (LLA), the process can also be described by the exchange of a gluon ladder [10, 11, 12]. To be calculable in pQCD, the interaction has to involve a hard scale or, in other words, has to involve small transverse distances. The transition of a pair into a meson is, however, a non-perturbative phenomenon and can only be described in terms of the meson wave-function derived from lattice calculations and sum rules [13].
The expected signatures of the perturbative regime in diffractive meson production are:
2.2 The Regge approach – modeling the soft interactions
Regge phenomenology [15] has been successful in describing soft hadron-hadron interactions. In this approach, the interactions are described in terms of -channel exchanges of Regge trajectories. In particular, diffractive processes are assumed to proceed through the exchange of the Pomeron trajectory.
2.2.1 Regge factorization
Regge factorization [15] is the assumption that Regge pole residues factorize into a contribution from each vertex. In other words, for diffractive vector-meson photoproduction, the properties of the interaction at the Pomeron-proton vertex should not depend on the properties of the Pomeron-vector-meson vertex. This hypothesis implies that the ratio of elastic to proton-dissociative vector-meson photoproduction, , should be the same for the three vector mesons under study in this paper. In the framework of VDM, these ratios should have the same values as in hadron-proton reactions.
2.2.2 The Pomeron trajectory
In general, the differential cross section for a two-body hadronic process, , can be expressed at high energies as
| (3) |
where is a function of only and is the Pomeron trajectory. At lower values, the exchange of a Reggeon trajectory should also be taken into account.
By studying the dependence of at fixed , can be determined directly. Usually, the trajectory is assumed to be linear, , but its form is not predicted by Regge theory. The early determinations of the Pomeron trajectory according to this procedure used data from elastic scattering [16, 17].
Under the assumption that decreases exponentially (i.e. ), can also be determined from a study of the energy behavior of the exponential slope . This method, however, is less direct and also depends on the range over which the exponent is fitted. Determinations of based on this procedure [18, 19] from and elastic scattering yielded values in the range of 0.14–0.28 GeV-2. However, the high precision ISR data at small showed that has a value 0.25 GeV-2 with a small uncertainty [20]. The same analysis gave .
Studies of the elastic photoproduction of and mesons have shown [1] that these processes can be well described by the Regge phenomenology developed for soft hadron-hadron collisions. The steep energy behavior of the elastic photoproduction cross section at HERA, however, cannot be described in the Regge picture by a Pomeron trajectory with an intercept of 1.08 but requires a larger intercept. In addition, a direct determination of the Pomeron trajectory in a way similar to that described above has shown that the slope from elastic photoproduction of is smaller than 0.25 GeV-2 [21]. These observations suggest that the Pomeron trajectory is not universal when a large scale, like a large mass, is involved. It is thus of interest to see whether the universality notion can be kept in soft interactions. Earlier attempts to determine the Pomeron trajectory from the elastic photoproduction of mesons [22, 23] were not precise enough owing to the small span in the energy available. The present measurements at HERA, together with the existing lower-energy data, enable a more precise determination of the Pomeron trajectory and thus make it possible to test its universality. In this paper the Pomeron trajectory will be determined from the and vector-meson data. The measurement of this analysis does not add significant information to the analysis done in [21] and therefore will not be considered here.
3 Experiment
The data used in the present analysis were collected with the ZEUS detector at HERA in 1995, when HERA collided positrons of energy GeV with protons of energy GeV. The data sample used in this analysis corresponds to an integrated luminosity of 1.98 pb-1.
A detailed description of the ZEUS detector can be found elsewhere [24]. A brief outline of the components which are most relevant for this analysis is given below.
Charged particles are tracked by the central tracking detector (CTD), which operates in a magnetic field of 1.43 T provided by a thin superconducting coil. The CTD consists of 72 cylindrical drift chamber layers, organized in 9 superlayers covering the polar angle111The ZEUS coordinates form a right-handed system with positive- in the proton beam direction and a horizontal -axis pointing towards the center of HERA. The nominal interaction point is at . The polar angle is defined with respect to the direction. region . The transverse momentum resolution for full-length tracks is , with in GeV [25].
The high resolution uranium-scintillator calorimeter (CAL) [26] consists of three parts: the forward (FCAL), the rear (RCAL) and the barrel (BCAL) calorimeters. Each part is subdivided transversely into towers and longitudinally into one electromagnetic section (EMC) and either one (in RCAL) or two (in BCAL and FCAL) hadronic sections (HAC). The smallest subdivision of the calorimeter is called a cell. The CAL energy resolutions, as measured under test beam conditions, are for electrons and for hadrons ( in GeV).
The proton-remnant tagger (PRT1) is used to tag events in which the proton dissociates. It consists of two layers of scintillation counters perpendicular to the beam at m. The two layers are separated by a 2 mm thick lead absorber. Each layer is split into two halves along the –axis and each half is independently read out by a photomultiplier tube. The counters have an active area of cm2 with a hole of cm2 at the center to accommodate the HERA beampipe. The pseudorapidity range covered by the PRT1 is .
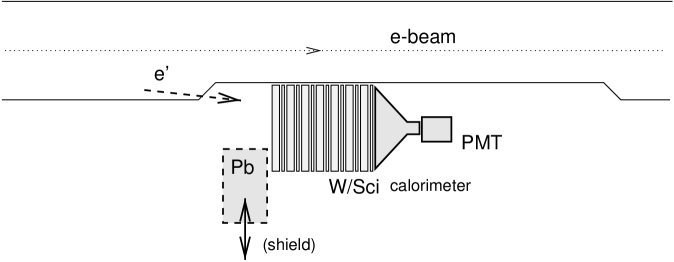
The photoproduction tagger (PT) is a small electromagnetic calorimeter located at m, sensitive to 22–26 GeV positrons scattered under very small angles (less than a few mrad). The HERA positron beampipe has a 14 mm deep and 60 cm long indentation on the side facing the ring center (Fig. 1). The calorimeter is installed behind a 1 mm thick copper window in the beampipe. During beam injection and acceleration, a movable 10 cm thick lead shield is inserted in front of the PT. The detector consists of twelve tungsten plates interleaved with 3 mm thick scintillator layers. The light from the scintillator is read out from the bottom by a wavelength-shifter plate coupled through a plastic light-guide to a photomultiplier tube with a quartz window (Philips XP1911). The detector sensitive edge is about 28 mm from the positron beam.
Additional scintillator strips are installed, after each of the first three tungsten plates, at depths corresponding to 2, 4 and 6 radiation lengths. These 8 mm wide vertical strips are connected to plastic light-guides coupled to three miniature photomultipliers (Hamamatsu R5600). Signals from the strips can be used to apply fiducial cuts and select well-contained electromagnetic showers.
Test beam measurements demonstrated that for 1–5 GeV electrons hitting the calorimeter centrally, the energy resolution is , and the calorimeter linearity is better than 1%. The energy measurement is used only at the trigger level for tagging photoproduction events. The tagger issues a trigger for events with an energy deposition above approximately 1 GeV. The low threshold ensures that the tagging efficiency is determined mainly by the geometric acceptance.
The luminosity is determined from the rate of the Bethe-Heitler bremsstrahlung process, , where the photon is measured with a calorimeter (LUMI) located in the HERA tunnel downstream of the interaction point in the direction of the outgoing positron [27]. The acceptance of the LUMI calorimeter for Bethe-Heitler events is greater than 98%.
4 Kinematics and cross sections
The kinematics of the inclusive scattering of unpolarized positrons and protons are described by the squared positron-proton center-of-mass energy, , and any two of the following variables:
-
•
, the negative square of the exchanged photon’s four-momentum;
-
•
, the fraction of the positron energy transferred to the hadronic final state in the rest frame of the initial-state proton;
-
•
, the squared center-of-mass energy of the photon-proton system (where is the proton mass); in the case of photoproduction.
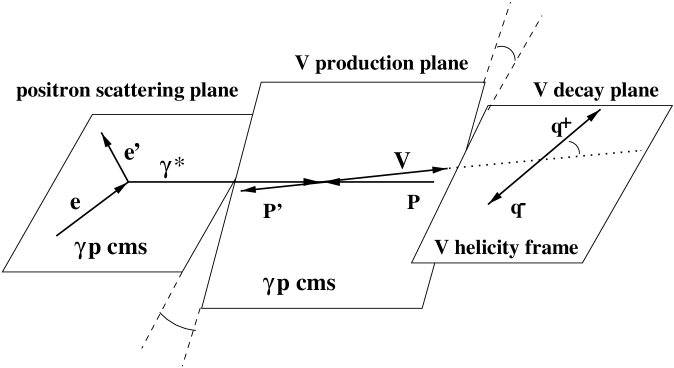
For the exclusive reaction ( two charged particles) and the proton-dissociative process , and the following additional variables are used (see Fig. 2):
-
•
the angle, , between the production plane (which contains the momentum vectors of the virtual photon and the vector meson) and the positron scattering plane;
-
•
the polar and azimuthal angles, and , of the positively-charged decay particle in the helicity frame. The polar angle, , is defined as the angle between the direction opposite to that of the outgoing proton and the direction of the positively-charged decay particle. The azimuthal angle, , is the angle between the decay plane and the production plane;
-
•
the mass, , of the diffractively-produced state in the proton-dissociative reaction. In the present analysis, however, it was not possible to measure this quantity directly and the range covered was obtained from Monte Carlo simulations (see Sect. 6).
Only the three-momenta of the decay particles were measured. Neither the momentum of the scattered positron, nor the angle, were measured. In such tagged photoproduction events, ranges from the kinematic minimum, , where is the electron mass, to a maximum value limited by the angular acceptance of the PT, , where is the maximum scattering angle, and and are the energies of the initial- and final-state positrons. The energy of the scattered positron is determined by the PT acceptance. Since the typical is very small (the median is approximately ), it can be neglected in the reconstruction of the other kinematic variables. The photon-proton center-of-mass energy is given by
| (4) |
where is the incoming proton energy, and and are the energy and longitudinal momentum in the laboratory frame of the produced meson , respectively; in this approximation, , the meson mass, , and its transverse momentum, , are assumed to be much smaller than . The four-momentum transfer squared is given by
| (5) |
where , are the magnitudes of the photon and meson momenta and is the angle between them. The starred quantities are defined in the photon-proton center-of-mass system and is the maximum value. For , and are given by
| (6) |
Since the maximum value in the kinematic range covered by this analysis is small ( for and for ) compared to the value, it can be neglected. The four-momentum transfer squared is then given by
| (7) |
The differential and integrated photoproduction cross sections for the processes were obtained from the cross sections measured for the reactions . The cross sections are related by
| (8) | |||||
where is the fine structure constant and is the effective photon flux. A measured cross section can thus be transformed into a cross section,
| (9) |
if is independent of (or ) in the studied region (where is the integrated effective photon flux).
5 Event selection
Vector mesons were observed in the two-body decay channels , , , and via the reconstruction of two oppositely-charged tracks in the CTD. The scattered positron was detected in the PT and the proton or its fragments escaped undetected or were tagged in either the FCAL or the PRT1.
5.1 Trigger
ZEUS uses a three-level trigger system. At the first level, a coincidence between signals in the PT and a track candidate in the CTD was required. Additionally, it was required that the energy deposition in any of the FCAL towers closest to the beampipe should not exceed 1.25 GeV in order to suppress proton beam-related backgrounds. An upper limit of 1 GeV on the energy deposited in the LUMI was also imposed; this requirement suppressed events having a random coincidence with bremsstrahlung. The second and the third trigger levels were mainly used to reject non-diffractive backgrounds by requiring exactly two tracks pointing to the same vertex with a -coordinate compatible with that of the nominal position of the interaction point, cm.
The trigger efficiency was studied using data samples selected by two independent triggers and was found to be about 90% for the elastic events used in this analysis and flat in all relevant kinematic variables. The efficiency for the proton-dissociative events was significantly lower, of the order of 10%, due to the FCAL energy requirement. This requirement restricts the mass of the dissociative system to GeV.
5.2 Offline requirements
In the offline event selection the following conditions were imposed:
-
•
exactly two oppositely-charged tracks from a common vertex;
-
•
each track with GeV and ;
-
•
the vertex coordinates in the range cm and cm;
-
•
, thereby selecting a region of high and well understood tagging efficiency;
-
•
a maximum energy of MeV (RCAL) and MeV (BCAL) deposited in any calorimeter cell, with the exception of those matched to tracks;
-
•
energy deposition in any of the 8 FCAL towers closest to the beampipe less than 1.20 GeV.
The number of events thus selected was 25446.
The final identification of the vector-meson candidates was performed using cuts on the invariant mass of the track pairs measured in the CTD. The pion, kaon and electron masses were in turn assigned to the tracks, leading to the selection of 22823 (), 366 (), and 120 () meson candidates. The invariant mass resolution varies from 5 to 60 MeV depending on the meson type and the values of and .
6 Acceptance corrections
6.1 Monte Carlo generators
The exclusive reaction was modeled using the DIPSI [28] Monte Carlo (MC) program. For the simulation of the reaction , the EPSOFT Monte Carlo generator [29] was used. The distribution at fixed was reweighted to the dependence
| (10) |
For and production, the function was used; this function was found by parameterizing the ISR [30] data on in single diffraction at large and [31]. For production the average between the above and (expected in Regge phenomenology for constant [32]) was used.
The (and for =) distribution was reweighted in both generators so as to reproduce the measured distribution after reconstruction; the polar and azimuthal angular distributions of the decay particles in the helicity frame were also reweighted.
6.2 Photoproduction tagging acceptance
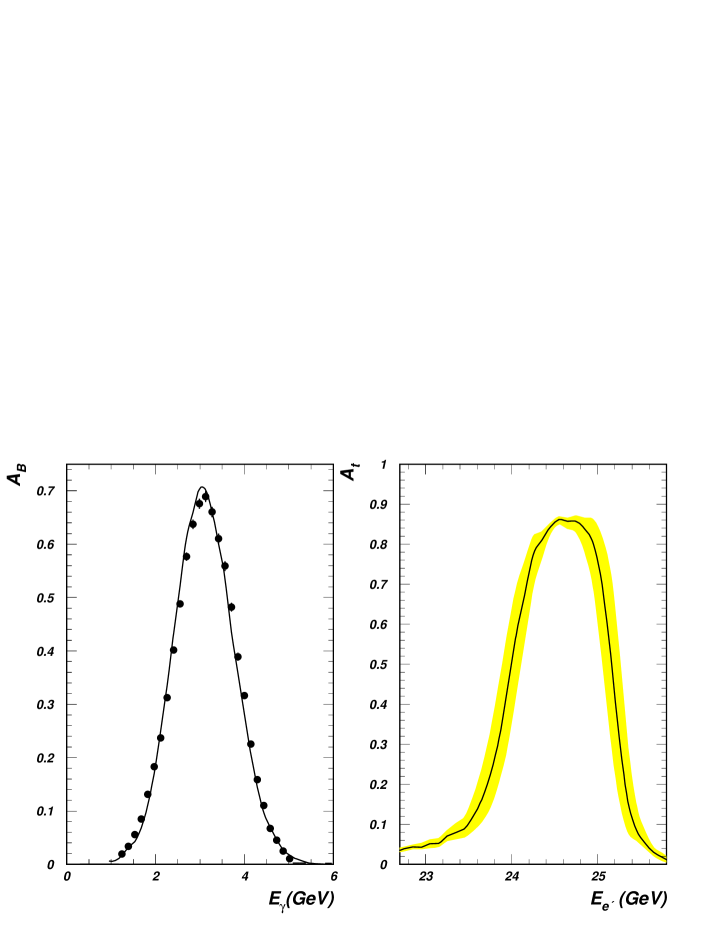
The geometric acceptance of the PT was simulated by a program which uses the HERA beam-transport matrices to track the positron through the HERA beamline. This program was tuned so as to reproduce the measured tagging efficiency, , using Bethe-Heitler events, . was defined as the fraction of bremsstrahlung events with a photon measured in the LUMI photon detector when the PT fired the trigger. In Fig. 3a, is shown as a function of the measured photon energy, , in the LUMI; the MC prediction is in reasonable agreement with the data. The acceptance for photoproduction events was determined using the geometric acceptance of the tagger and events generated according to the equivalent-photon approximation for positron scattering angles up to 3 mrad (for larger angles the acceptance is negligible); for these events, the positron was tracked through the HERA beamline. The photoproduction tagging efficiency, , was calculated as a function of the positron energy, , (see Fig. 3b). For the kinematic range used in this analysis, the average (cross-section weighted) PT acceptance was 70%. The systematic error was evaluated by changing the data sets used to tune the MC and by varying the photon energy scale and the position of the positron exit window in MC within their systematic uncertainties.
6.3 Overall acceptance
The generated events were processed through the same chain of selection and reconstruction procedures as the data, thereby accounting for trigger as well as detector efficiencies (except for that of the PT) and smearing effects in the ZEUS detector. The reconstructed Monte Carlo events were then weighted with the function in order to account for the PT acceptance and efficiency.
All measured distributions are well described by the Monte Carlo simulations. Some examples are displayed in Fig. 4. The overall acceptance in a given bin was then determined as the ratio of the number of accepted Monte Carlo events (weighted by ) to the number generated in the selected kinematic range. The acceptance, calculated in this manner, accounts for the geometric acceptance, the detector and reconstruction efficiencies, the detector resolution and the trigger efficiency.
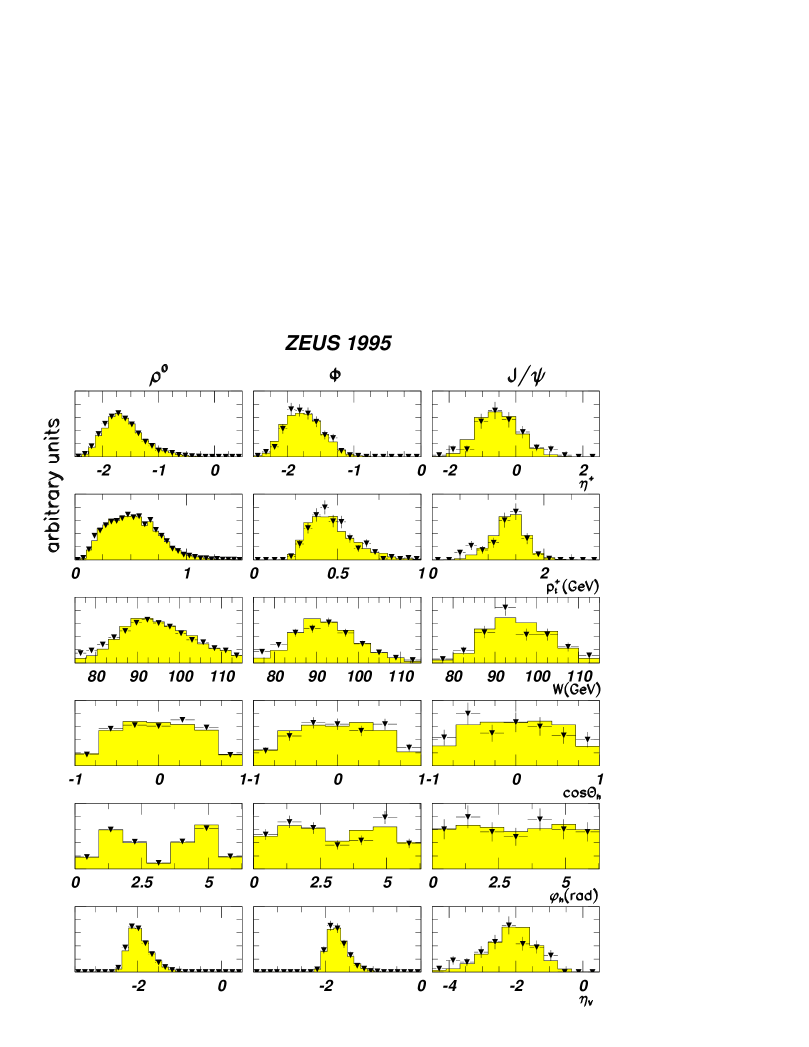
Figure 5 shows the overall acceptance for elastic events as a function of , and . Inefficiencies at small , as well as the strong variation of the acceptance with for and mesons, are mainly due to the relatively small opening angle between the decay particles, resulting in many very backward tracks (as can be deduced from the pseudorapidity distributions of tracks in Fig. 4) outside the geometric acceptance of the CTD.
The average acceptances are of the order of 30% for elastic and 5% for proton dissociative events, respectively. The much lower acceptance for the proton dissociative events is mainly due to the FCAL energy requirement imposed in the trigger.
7 Backgrounds
The dominant background sources are non-resonant production for the analysis, production for the analysis, and Bethe-Heitler production for the case. These backgrounds were statistically subtracted using the fits to invariant-mass distributions as described in Sect. 10.
The background due to inclusive photon diffractive dissociation, , was studied using Monte Carlo simulations and minimum-bias data samples. It was found to be about 1-2% and was also subtracted in the fitting procedure.
In the analysis, the backgrounds due to decays of and mesons were found from MC studies to be negligible. The background due to non-diffractive events was also small and was neglected.
On average, 10% of the diffractive events were rejected by the trigger due to accidental coincidences with bremsstrahlung events in the LUMI calorimeter. A correction was applied to account for this effect. A small fraction of events, below 1%, was selected due to fake photoproduction tagging from bremsstrahlung overlays (when the meson decay particles were measured by the CTD and the scattered positron was undetected, while the PT was hit instead by a bremsstrahlung positron); this effect was neglected.
8 Separation of elastic and proton-dissociative processes
The selected samples of diffractively-produced vector mesons are mixtures of elastic and proton-dissociative events. These two processes have been separated as a function of on a statistical basis using the MC simulation.
Proton-dissociative events were tagged by requiring a signal in one of the PRT1 counters above a threshold corresponding to the signal of a minimum ionizing particle. Alternatively, for systematic checks, energy depositions in the FCAL towers close to the beampipe were also used for tagging the proton-dissociative events.
Since the non-diffractive backgrounds were negligible, the following relation was assumed:
where and are the numbers of all accepted (but not necessarily tagged) proton-dissociative events, whereas and are the numbers of tagged proton-dissociative events, in the data and proton-dissociative EPSOFT samples, respectively. Therefore, the fraction, , of proton-dissociative events in the data was calculated from
where is the number of all observed events (elastic and proton-dissociative) in a given bin in the data. In Fig. 6 the observed fraction of PRT1 tags, , in the data and in the proton-dissociative MC, as well as the estimated fraction of proton-dissociative events, , are displayed separately for the , and samples. For the low region, the elastic process contributes a large fraction of the selected diffractive events. For GeV2, the contribution from the proton-dissociative process exceeds that from the elastic channel.
9 Systematic uncertainties
The systematic uncertainties were subdivided into those related to the selection procedure and the detector simulation, and those reflecting the uncertainty in the model used for the Monte Carlo generator.
The effects of the following changes in the selection procedure were checked:
-
1)
the FCAL (instead of PRT1) was used to tag the proton-dissociative events;
-
2)
the matching procedure between the tracks and energy depositions in CAL was varied by changing the matching distance between the track and CAL cluster and the energy requirement used to define the CAL cluster;
-
3)
the minimum value of the track transverse momentum was varied between 100 and 200 MeV;
-
4)
the limit on the track was varied between 2.1 and 2.3;
-
5)
the requirements on the vertex position were varied by amount corresponding approximately to the resolution, i.e. 5 cm in and 0.25 cm in the radial direction;
-
6)
the selected invariant mass region was changed by widening and narrowing it by amounts corresponding to approximately the appropriate mass resolution;
-
7)
the threshold values of all PRT1 counters were increased by 100%.
The first check resulted in 5–20% changes of the measured cross sections. Checks 2–5 resulted in 3–5% changes, and the last two checks had negligible effect.
In the MC simulation, the positions of some beamline elements (eg. the position of the synchrotron collimator jaws) were varied within their uncertainties, resulting in a 5–15% change in the cross section.
In order to estimate the systematic uncertainty from the uncertainties in the parameters assumed in the EPSOFT generator, the following modifications were made:
-
•
the shape of was varied within the uncertainties of its measurement [31]; for and production, this corresponds to and ; for production, to and . These variations significantly changed the acceptance corrections, by up to 10% at low and up to 70% for the proton-dissociative sample at the highest ;
-
•
multiplicity distributions of the decay particles of the dissociative system were varied within the uncertainties of their measurement [33]. This resulted in cross section variations of .
Additionally, the re-weighting of other MC distributions (of the decay particle angles or invariant masses, for example) was performed in the range allowed by maintaining satisfactory agreement between data and Monte Carlo. The effect on the cross sections was . In the determination of the spin-density matrix elements, the difference between the nominal method (see Sect. 10.1.3) and the method of moments was taken as an additional uncertainty.
The overall normalization error due to the photoproduction tagging uncertainty was %.
10 Results
The differential cross sections for elastic and proton-dissociative photoproduction of were evaluated in each bin of as:
| (11) |
| (12) |
where is the number of observed vector-meson candidates in bin after all selection cuts, is the estimated fraction of the proton-dissociative events in the bin, is the resonant contribution in the bin, is the branching ratio of the vector-meson decay mode considered, is the overall acceptance in the bin, the integrated luminosity, and is the integrated effective photon flux (see Eq. 9). In the kinematic region , where 3 mrad (see Sect. 6.2), and GeV, . The branching ratios for the , , or decay modes were taken as and , respectively. Effects due to QED radiation, estimated to be smaller than 2% [34], were neglected.
A similar procedure was used to evaluate the differential cross section .
For the proton-dissociative reaction, cross sections are extrapolated to using the EPSOFT MC, as modified by Eq. 10.
10.1 photoproduction
10.1.1 Resonance mass shape
The differential cross sections were fitted using a parameterization inspired by the Söding model [35], where the p-wave relativistic Breit-Wigner (BW) shape is distorted by the interference with non-resonant production:
| (13) |
where is the mass, is the momentum-dependent width
| (14) |
is the width of the , is the momentum in the rest frame and is the value of at . The non-resonant amplitude (taken to be -independent) is denoted by , and is the normalization factor of the resonant amplitude. Additionally, another term, , was introduced to account for the background from reactions with photon diffractive dissociation. The term was assumed to be linear in , [8] with in GeV. Alternatively the following parameterization, proposed by Ross and Stodolsky [36], was used:
| (15) |
where is given by Eq. 14 and has the same form as described above.
The for all the fits is satisfactory. The fitted values of , and do not depend on the prescription used to parameterize the mass distribution. The mass, , and width, , for all values are compatible with the values of the Particle Data Group (PDG)[37]. The level of background under the peak, as given by the integral of the function , is about 1–2%. The mass distributions for elastic and proton-dissociative production are shown in Fig. 7 together with the results of the fits using Eq. 13. The mass resolution varies between 20 and 60 MeV for between 0.5 and 1.2 GeV, respectively.

The fits to the mass distributions were repeated with and fixed to the PDG values. The results for and are shown as a function of in Fig. 8; they match with our earlier measurement for the low region at GeV [8]. Both and decrease with , indicating that the resonance shape distortion decreases. This decrease is much faster with than that with [38].
The dependence of the ratio on was parameterized as
| (16) |
The fit to the data yields (stat.) GeV-1/2 and (stat.) GeV-2 for the elastic reaction, and (stat.) GeV-1/2 and (stat.) GeV-2 for the proton-dissociative process. The similar magnitudes and dependences of the ratio for the elastic and the proton-dissociative processes indicate that the data are consistent with the hypothesis of factorization of the diffractive vertices.
The production cross section was evaluated in the mass range . The extrapolation from the measured range was made using the results of the fit to Eq. 13.

10.1.2 distributions
The differential cross sections, , for elastic and proton-dissociative (for ) photoproduction are plotted in Fig. 9a. Both samples exhibit an exponential drop with increasing , with the cross section for the elastic process falling off more steeply than that for the proton-dissociative process. A fit with the function in the range GeV2 for the elastic process gives = 6.0 GeV-2 and = 2.4 GeV-2 for the proton-dissociative sample, where (mod.) represents the uncertainty due to the modeling of the proton dissociation in the EPSOFT Monte Carlo.
The ratio of the elastic to the proton-dissociative cross sections, , in a given interval is shown in Fig. 9b. This ratio falls off rapidly with from about unity at 0.4 GeV2 to about for 1 GeV2. By comparison, this ratio has the value 2.0 0.2 (stat.) 0.7 (syst.) for 0.5 GeV2 at = 70 GeV [8]. An exponential fit to the ratio gives a value for the slope (stat.) (sys.) (mod.) GeV-2, which is similar to that found previously [8].
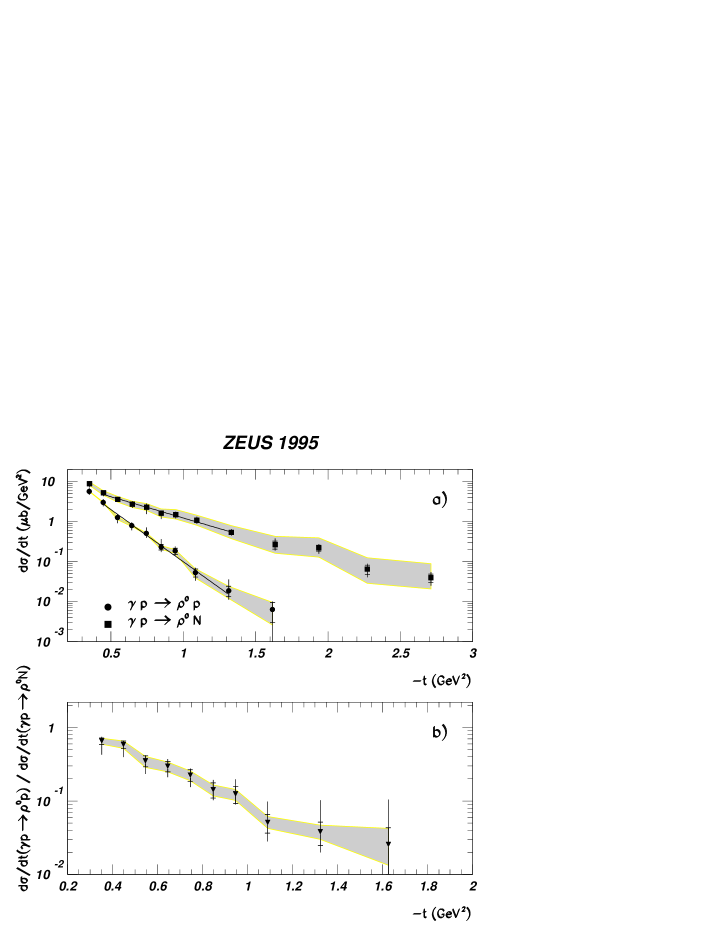
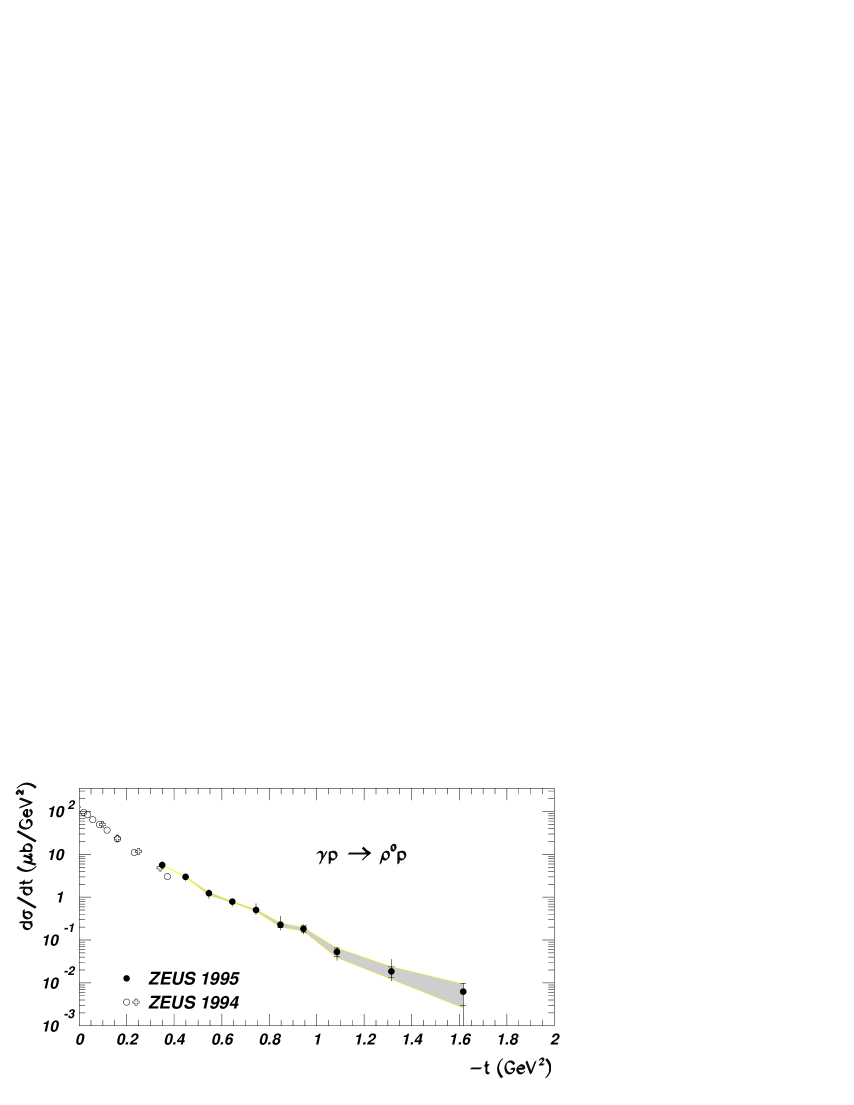
Figure 10 shows the differential cross section for the elastic reaction together with results obtained in our earlier studies of the low region [8, 39]. The data at low were measured at a somewhat lower ( GeV) and have been rescaled to the average of the present analysis ( GeV), assuming the Pomeron trajectory as measured in this analysis (see Sect. 11.4). The large data match well with the low results.
The data in Fig. 10 cannot be described by the expression over the whole range. The slope (of about [8]) in the low region is larger than that in the large region, in contrast to the case for , which is the same within errors in both regions, as well as at higher [40].
10.1.3 Decay angular distributions
The angular distributions of the decay pions were used to determine some of the spin-density matrix elements using the invariant mass selection . The direction of the virtual photon was approximated by that of the incoming positron. In this measurement, the three-dimensional angular distribution has been averaged over the azimuthal angle between the positron scattering plane and the production plane, , and thus no longer distinguishes the photon helicity states 1. The normalized two-dimensional decay angular distribution can be written as [41]
| (17) | |||||
where the spin-density matrix element represents the probability that the produced has helicity ; the element is related to the interference between the helicity non-flip and single-flip amplitudes; is related to the interference between the non-flip and double-flip amplitudes. If -channel helicity conservation (SCHC) [42] holds, , and should be zero.
The parameters , and Re were obtained by minimizing the difference between the two-dimensional () angular distributions of the data and those of the simulated events, which were re-weighted according to Eq. 17. A binned -method was used.
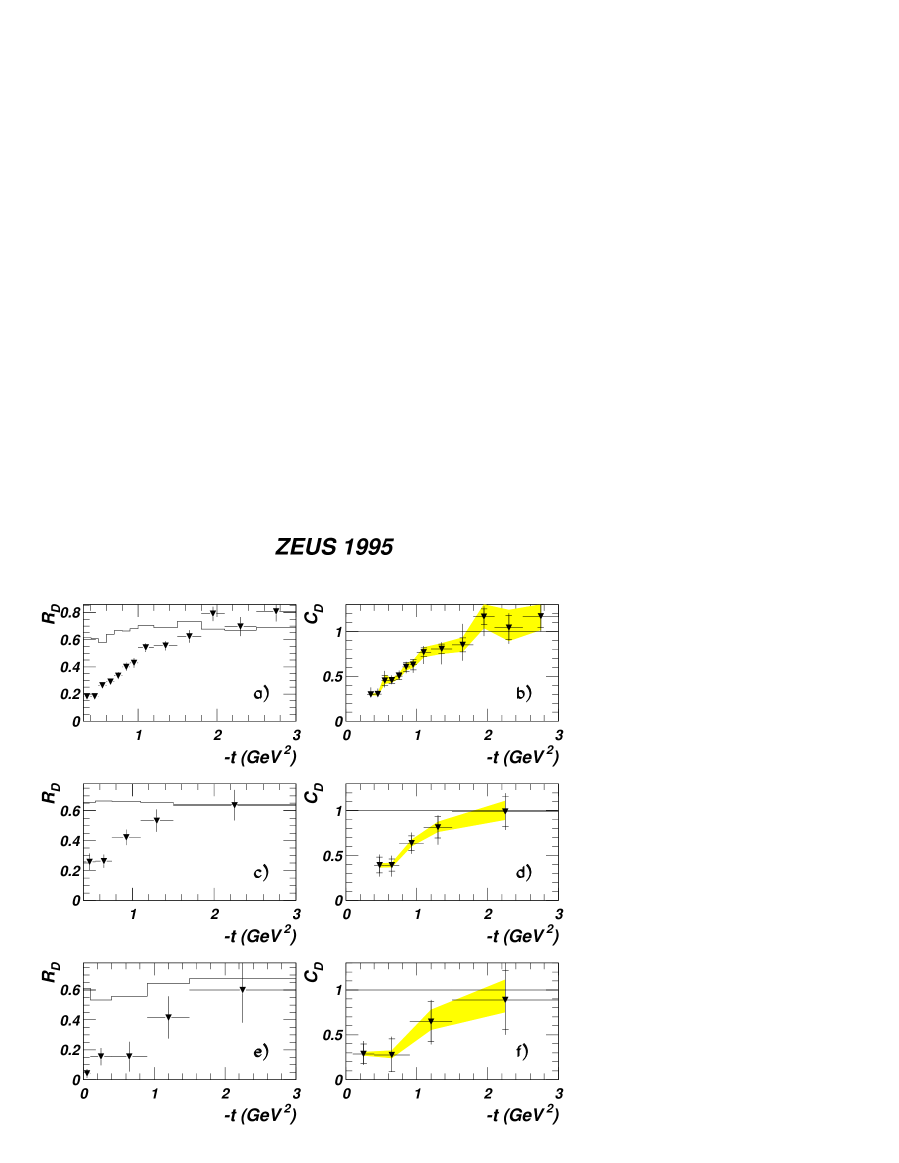
The three spin-density matrix elements are shown in Fig. 11, separately for elastic and proton-dissociative production as a function of . In the range of this analysis, Re tends to be non-zero and positive, while tends to be non-zero and negative. This is an indication for small deviations from SCHC giving rise to non-zero helicity single-flip and double-flip amplitudes. The element is measured to be zero within errors.
The present results are not corrected for the non-resonant production. Hence, strictly speaking, they only apply to the reaction within the quoted range. However, in the previous section it was shown that the non-resonant contribution is small and decreases rapidly with . In order to assess the sensitivity of the data to changes in the selected range, the events with and were analyzed separately. No statistically significant effect was observed. Data at lower (0.1 GeV2) from ZEUS [8] show no evidence for a violation of SCHC. However, lower energy ( GeV) elastic photoproduction data [43], while showing no SCHC violation for GeV2, yield positive values for Re and negative values for for GeV2. Recent HERA measurements, both at low (0.25–0.85 GeV2) [44] and higher (greater than 1 GeV2) [44, 45], also report similar values, at 0.1–0.2 GeV2, although only the low results are significantly non-zero.

10.2 photoproduction
10.2.1 Mass distribution
The invariant mass of the two charged decay products of the is displayed in Fig. 12 for different ranges for two samples of data: for all events and for those that have a signal in PRT1 (proton dissociation). The invariant mass was computed assuming that the two charged particles were kaons. The lines are fits to a Breit-Wigner function, convoluted with a Gaussian resolution function, and a function describing the background. The background, due mainly to diffractive events for which the two pions are assigned the kaon mass, was assumed to have the form , where is a parameter determined by the fit. For the determination of the background contribution in each region, the mass and width of the were fixed to the PDG values. The fit was performed over a broad mass range GeV to give a better estimate of the background. A narrower mass range GeV was then used to select candidates and the background contribution in this range was subtracted. The mass resolution is about 10 MeV, consistent with the Monte Carlo simulations. The background contribution decreases with , from about 23% at to 10% above .

10.2.2 distributions
The differential cross sections for the reactions and () were determined following the separation procedure described in Sect. 8; the results are shown in Fig. 13a. As in the case, both differential cross sections decrease exponentially with increasing . A fit with a function of the form in the range GeV2 yields = 6.3 (stat.) (sys.) (mod.) GeV-2 and = 2.1 (stat.) (sys.) (mod.) GeV-2. These values are the same within errors as those obtained for the . Note that while in the region 0.3 GeV2 [46], in the region 0.4 1.5 GeV2. There are no data at low to make a similar comparison in the case of the proton-dissociative process, but for the larger range, . This indicates that the mass difference between the and the is not important in the large region.
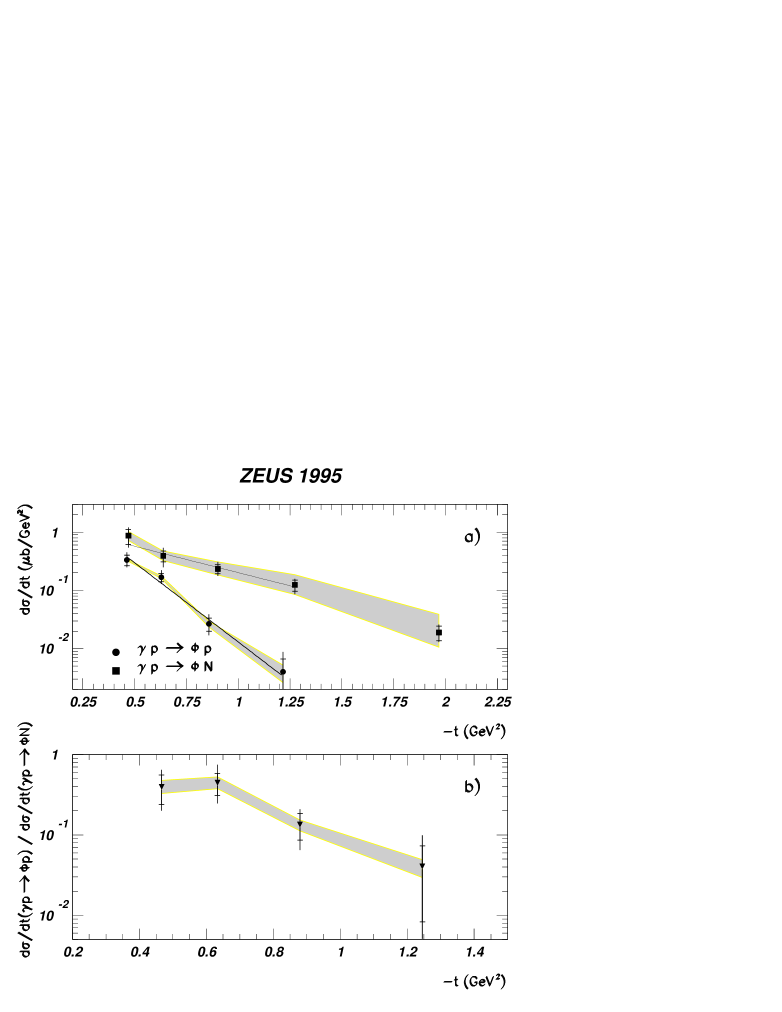
Fig. 13b shows the ratio of the cross sections for the elastic and the proton-dissociative processes in a given interval as function of . The ratio decreases rapidly from unity at 0.5 GeV2 to at 1.3 GeV2, as in the case. A fit to the ratio gives (stat.) (sys.) (mod.) GeV-2. This value is the same within errors as that obtained for the , and is thus independent of the type of the vector meson produced at the photon vertex (see Sect. 11.3).
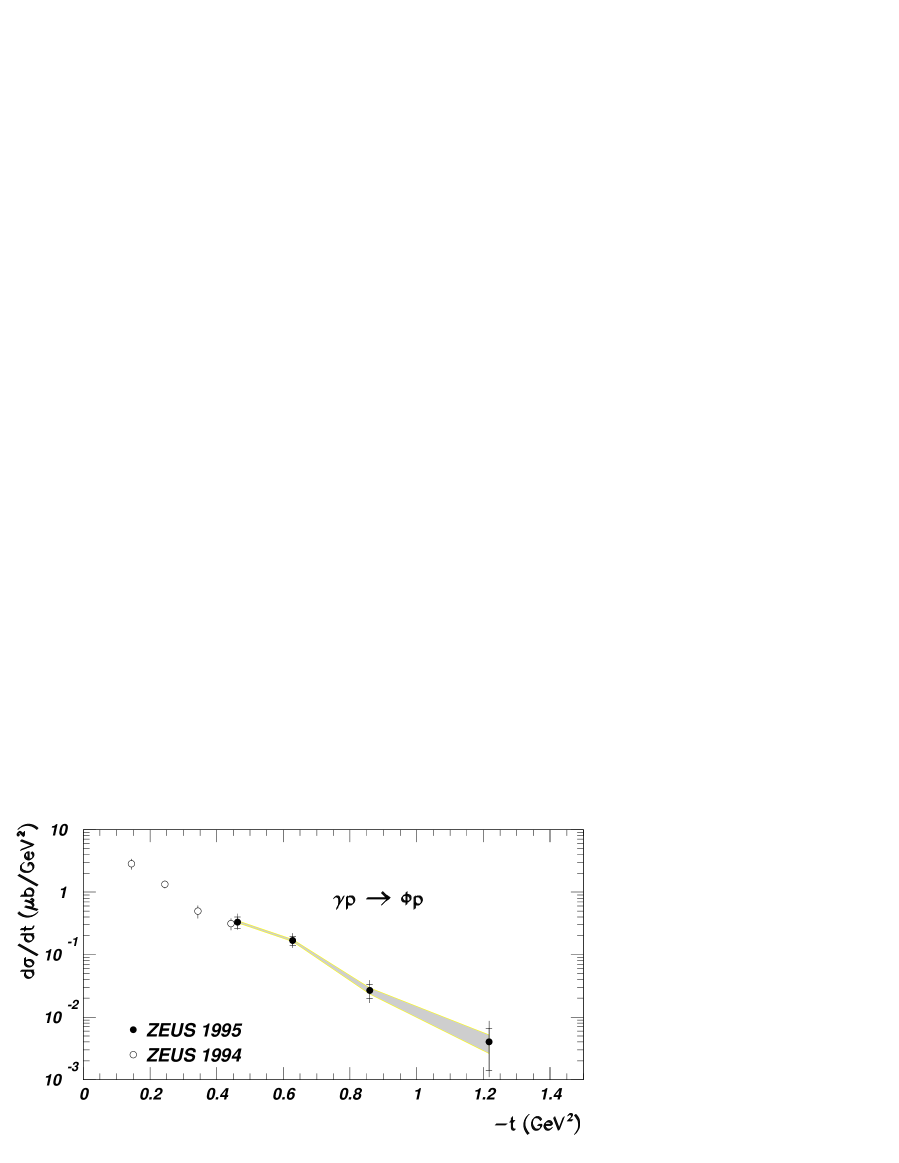
In Fig. 14 the results for for elastic photoproduction are displayed, together with ZEUS measurements at small [46]. The low data have been rescaled to the present value by assuming the Pomeron trajectory as measured in this analysis (see Sect. 11.4); both data sets are plotted with statistical errors only. The results are consistent.
10.3 photoproduction
10.3.1 Mass distribution
Figure 15 shows the two body invariant mass distribution in the region 2.4–3.6 GeV, for the whole sample in two ranges and for the PRT1-tagged sample in one bin. No lepton identification was performed for this sample. Although the events therefore represent a sum of and final states the electron mass was always assumed for each of the two charged particles222Assuming the muon mass does not change any of the results.. A narrow peak is observed around 3.1 GeV. Fits were made to the invariant mass distribution using the sum of a Gaussian (for the case), a Gaussian (modified by the energy loss spectra due to bremsstrahlung in dead material before the CTD for the case), and a background which linearly decreases with mass. Equal numbers of pairs and pairs were assumed. The fitted mass is in good agreement with the PDG value. The background in the mass region (2.87–3.13 GeV) is (20 5)%, independent of in the range under study ( 3 GeV2).

10.3.2 distributions
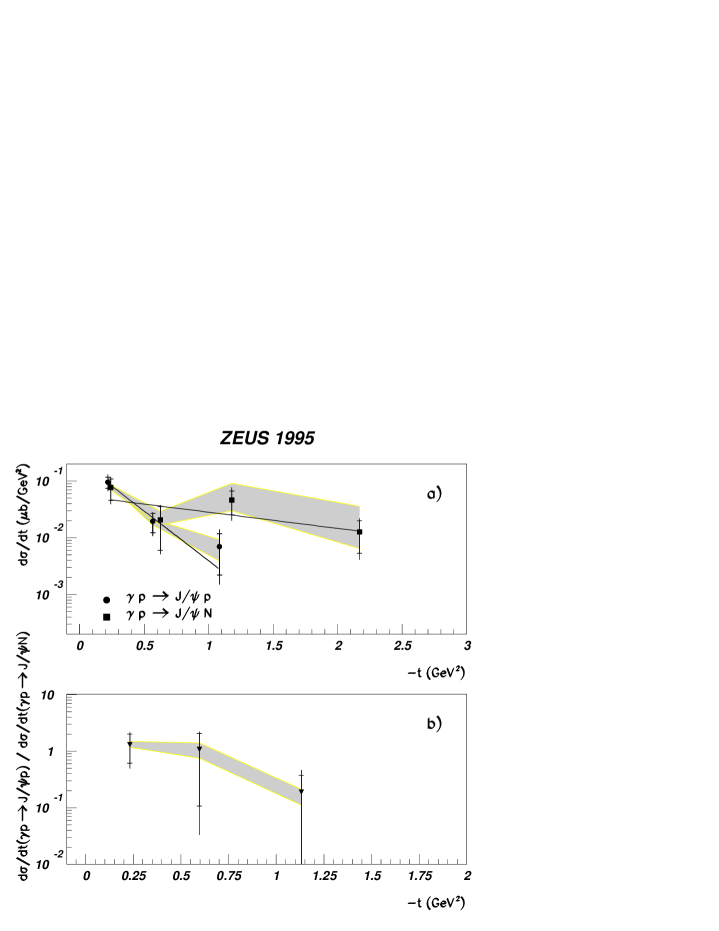
The differential cross sections for the elastic and the proton-dissociative photoproduction reactions are shown in Fig. 16a. In contrast to the and cases, the high mass of the and the resulting large opening angle of the decay particles result in significant acceptance in the low region. However, in the case of the proton-dissociative process, the effect of the minimum kinematically allowed , (see Eq. 6), prevents the measurement of in the low bins. The elastic differential cross section falls exponentially, with = 4.0 (stat.)(sys.)(mod.) GeV-2, while for the proton-dissociative reaction = 0.7 (stat.) (sys.)(mod.) GeV-2. The slope agrees, within errors, with the values for the and .
Fig. 16b shows the ratio of the elastic to the proton-dissociative differential cross sections. This ratio also falls from a value of about 1 at low to a value of about 0.1 for 1 GeV2, similar to the and the cases.
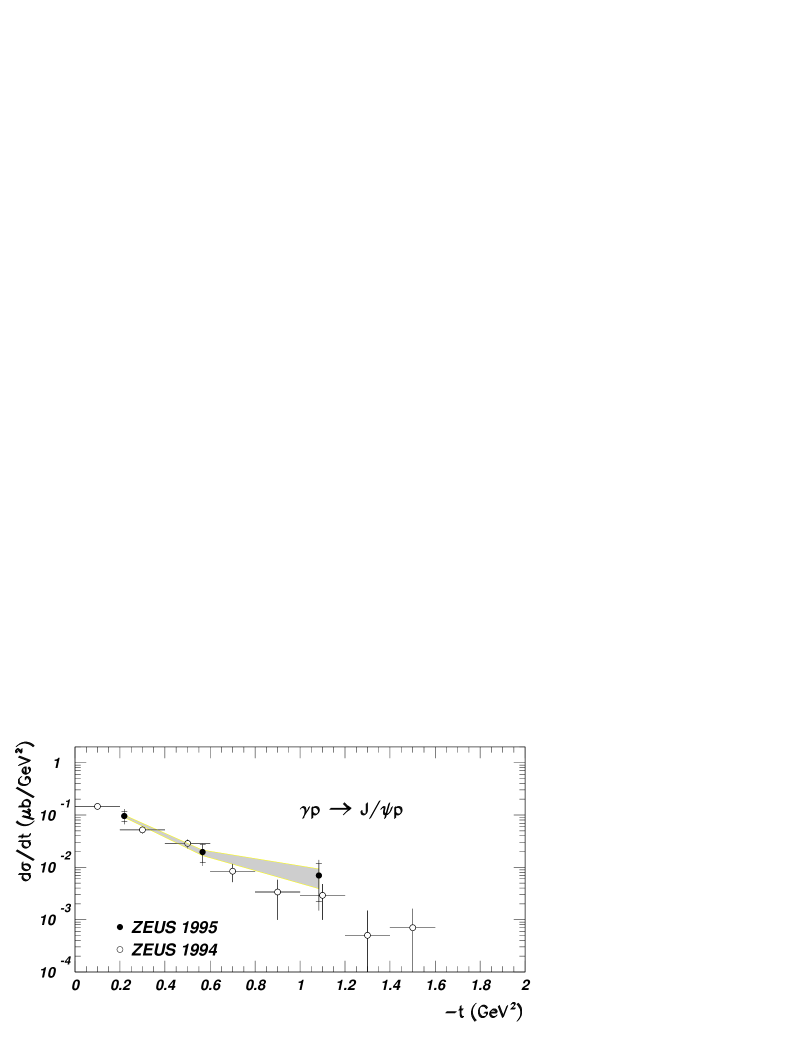
The present measurements of for the reaction are shown in Fig. 17, together with our earlier untagged (i.e. ) photoproduction data [48] ( GeV). The data sets agree within errors.
11 Comparisons of data to models
11.1 Cross section comparisons with the pQCD-based models
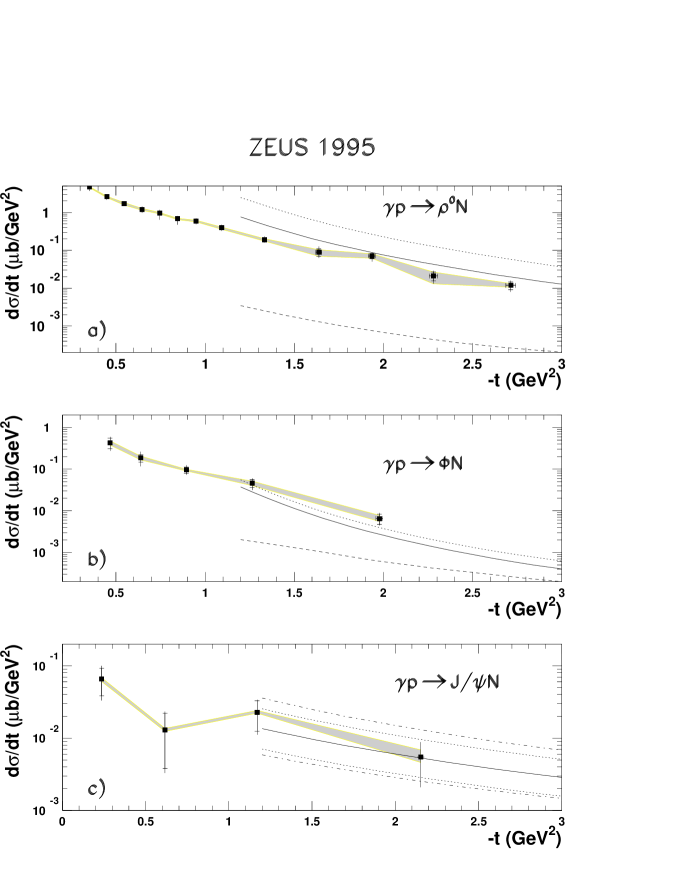
In order to compare the data to pQCD predictions for light [14] and heavy [11] mesons, the cross sections were redetermined in the region of validity of the model calculation, viz. , using the EPSOFT MC simulation. The measured proton-dissociative cross sections for the three vector mesons are shown in Fig. 18.
The calculations [14] for the production of the and mesons were performed at lowest order in . Only helicity non-flip and single-flip amplitudes were taken into account. The non-perturbative effects were simulated by introducing effective quark masses. In Fig. 18a and 18b, the solid (dotted) curves represent results for a quark mass of 300 (200) MeV. For the calculation of the cross-section, the sub-asymptotic wave-function was used, whereas for the production the asymptotic one [14, 12] was employed. The contribution of the perturbative cross section, represented by the dashed lines in Fig. 18a and 18b, is well below the and data. This observation, together with the helicity analysis (see Sect. 10.1.3) in which no significant production of mesons with helicity 0 is observed, implies that these perturbative calculations are not applicable in this regime.
The situation is different in the case. The perturbative QCD prediction in the LLA [11] expansion in terms of (equivalent to ) compares satisfactorily with the data (solid line in Fig. 18c). A value of =0.2 and an energy scale GeV have been used in this calculation. It should be noted, however, that the uncertainties due to the choice of ( – dotted lines) and the scale ( GeV2 – dashed-dotted lines) are significant.
11.2 Ratios of cross sections for vector-meson photoproduction
Flavor independence predicts that the ratio of the production cross sections of : should be 2:9 and that of : should be 8:9. These predictions are in striking disagreement with the previously published low- data: at =70 GeV, the ratios : [47] and : [48] were measured. In contrast, in the DIS kinematic region, for 12 GeV2, the ratios :=0.180.05 [47] and 0.190.04 [49] were obtained at 100 GeV. This analysis gives the ratio : for = 10 GeV2 and 1.30.5 for = 20 GeV2 [50] at 100 GeV. These results suggest that flavor independence may hold at large .
The ratios and of the differential cross sections for elastic reactions from this analysis are plotted in Fig. 19a and 19c as a function of . For both ratios, the point at was obtained by using the ratios of values of the total elastic cross section and rescaling them by the ratios of the corresponding slopes, , of the differential cross sections, using the relation . An increase of the ratio up to 1 GeV2 is observed, approaching the expected 2:9 ratio. Although the ratio increases quickly up to 0.5 GeV2, it remains more than an order of magnitude smaller than the 8:9 expectation. A non-perturbative QCD model [51] successfully describes the ratios for the elastic production at 0.3 GeV2.
The ratios for the proton-dissociative reactions are shown in Fig. 19b and 19d. There are no data at = 0 for this process. Both ratios are consistent with the corresponding elastic results. At GeV2, the ratio is still well below the 8:9 expectation.

11.3 Test of Regge factorization hypothesis
The hypothesis of Regge factorization [52] implies that the ratio of the elastic to proton-dissociative differential cross sections should be independent of the type of vector meson produced at the photon vertex. Furthermore, this ratio should be the same as for hadron-proton elastic and proton-dissociative processes.
Several results discussed in previous sections are consistent with this hypothesis: the decrease in the resonance-shape distortion with increasing is the same for the elastic and proton-dissociation channels; the spin-density matrix elements for both channels agree; and the difference () between the slopes of the -distributions for elastic and proton-dissociation processes is independent of the type of vector meson () produced at the photon vertex.
To test this hypothesis further, the ratios for the three vector mesons are shown in Fig. 20. As can be seen, the ratio agrees within errors for each of the three vector mesons. In the same figure, the ratio at center of mass energies of = 23.4 and 38.3 GeV [30] is also shown. The proton-dissociative reaction is defined for . The ratios for the reactions are in agreement with those of the vector-meson photoproduction. These observations confirm the factorization hypothesis.

In a naive additive quark model [53], the ratio shown in Fig. 20 measures the proton form factor. In such a model, the differential cross sections can be related to the form factor of the hadrons involved in the scattering process. In the framework of the VDM, this relation can also be used for the vector-meson photoproduction reactions discussed above. The elastic and proton-dissociative processes can be expressed as
| (18) |
where is the amplitude describing the constituent interaction, the form factor of the proton is indicated by and that of the vector meson by . Thus, the ratio of the elastic and the proton-dissociative cross sections gives the proton form factor:
| (19) |
where the electromagnetic dipole expression for the proton form factor has been used and and are free parameters.
Equation 19 was fitted to both the photoproduction and data and the result is shown as the curve in Fig. 20. The best fit yielded the parameters = 7.7 0.4 and = 0.47 0.01 GeV2, and gives a fair description of the data. Note that the mass scale parameter obtained by this fit is smaller than the value of 0.71 GeV2 measured from electron–proton elastic scattering.. Fitting only to the ZEUS photoproduction data yields and .
11.4 Determination of the Pomeron trajectory
The measurement of the variation of the energy dependence of the elastic cross section with momentum transfer yields a direct determination of the Pomeron trajectory, as shown in Eq. 3. Such an analysis is presented for elastic and photoproduction.
Since the reaction is dominated by Pomeron exchange only at high energies, measurements at very low cannot be used in this analysis. Therefore, the only fixed target experiment that can be used is the OMEGA experiment (WA4) [54], which measured elastic photoproduction at = 8.2 and 10.1 GeV in the range GeV2. The measurement of the H1 collaboration [55] at =55 GeV, the earlier measurements of the ZEUS collaboration at =71.2 GeV [8] and at =73 GeV [39], and the present data at =94 GeV are also used.
The data used in the determination of are presented in Fig. 21 in 12 bins in the range GeV2. The errors are the statistical and systematic uncertainties combined in quadrature. The line in each bin is the result of a fit of the form , where . The resulting values of are plotted in Fig. 22 as a function of . A linear fit to the data yields
| (20) |
and is plotted as a full line in the figure. The quality of these fits is acceptable. The dashed line is the Pomeron trajectory 1.0808 + 0.25 , as determined by Donnachie and Landshoff (DL) [56]. The resulting intercept, , is in excellent agreement with that of DL; however, the slope, , is smaller in the present determination.


The elastic photoproduction of mesons is a good reaction with which to study the properties of the Pomeron, since this is the only trajectory that can be exchanged [57], assuming the to be a pure state. This allows the use of data at very low .
The data used for the trajectory determination include the following: =2.64–3.60 GeV [58], =2.8 [23], =2.81–4.28 GeV [43], =3.59–4.21 GeV [59], =4.73–5.85 GeV [60], =12.89 GeV [61], =70 GeV [46] and the present measurement at =94 GeV. These data points are displayed in Fig. 23 for 11 values in the range GeV2. The lines are the results of fits of the function to the data.

The resulting values of the trajectory are shown in Fig. 24 as a function of . Assuming a linear trajectory,
| (21) |
is obtained. Again the quality of the fits is generally acceptable. This trajectory is shown as a solid line in the figure and compared with the DL trajectory, which is plotted as a dashed line.

As can be seen from (20) and (21), the intercepts and slopes from this determination are in good agreement with each other. Whereas the intercepts agree very well with DL, the slopes of the present measurement are clearly smaller than that of the DL trajectory, which was determined from elastic scattering data. It would therefore seem that this simple Pomeron trajectory is not universal.
12 Summary
Elastic and proton-dissociative photoproduction of , and mesons have been investigated at an average photon-proton center-of-mass energy of 94 GeV and for values of up to 3 GeV2. The proton-dissociative event sample was limited to values for the mass of the dissociated proton system below 7 GeV. The differential cross section , for each of the vector mesons in each of these two processes, has been measured. The following features are common to these reactions:
-
•
the ratio of the differential cross sections for the elastic and proton-dissociative reactions drops rapidly from a value of about 1 at = 0.4 GeV2 to a value 0.1 for 1 GeV2;
-
•
parameterization of the differential cross section as a single exponential, , for values of exceeding 0.5 GeV2, yields a difference in the exponential slopes, , for the elastic and proton-dissociative reactions of about 3.5 GeV-2 for each of the vector mesons;
-
•
the measured ratio of the elastic and proton-dissociative differential cross sections is similar to that measured in elastic and single-dissociative scattering and is consistent with the hypothesis of Regge factorization.
The analysis of the decay-angle distributions for pion-pair photoproduction in the mass region indicates a small deviation from SCHC giving non-zero single- and double-flip amplitudes.
A comparison of the measured differential cross sections, , for the process with QCD models shows that the perturbative part of the calculations for and production [14] at the values covered in this analysis is well below the data. However, the perturbative QCD prediction [11] compares satisfactorily to the data for values of as low as 1 GeV2.
The ratio : of the elastic cross sections increases with and approaches 2 : 9 at GeV2. The ratio : of the proton-dissociative cross sections increases with , but even at 2.2 GeV2 is still much lower than the value of 8 : 9 expected for a flavor-independent production mechanism.
The Pomeron trajectory was determined using elastic production of and mesons by studying the dependence of at fixed values, together with lower data from other experiments. The resulting trajectories are:
-
•
: ;
-
•
: .
The values obtained for are in good agreement with those of DL [56]. However, the slopes, , are significantly lower than the value found in elastic scattering.
In conclusion, the results presented in this analysis suggest that even for the highest values studied here ( 2–3 GeV2), the variable cannot be consistently treated as a hard scale in perturbative QCD.
Acknowledgments
We thank the DESY Directorate for their strong support and encouragement. The remarkable achievements of the HERA machine group were essential for the successful completion of this work and are gratefully appreciated. We are grateful to J.R. Cudell, D.Yu. Ivanov and M. Wüsthoff for providing the theoretical calculations. It is also a pleasure to thank L. Frankfurt and M. Strikman for useful discussions.
References
- [1] For a recent review see e.g. J.A. Crittenden, Exclusive Production of Neutral Vector Mesons at the Electron-Proton Collider HERA, Springer Tracts in Modern Physics, Volume 140 (Springer, Berlin Heidelberg, 1997).
- [2] See H. Abramowicz and A. Caldwell, DESY 98–192 (1998), accepted by Rev. Mod. Phys, and references therein.
-
[3]
L. Frankfurt and M. Strikman, Phys. Rev. Lett. 63 (1989) 1914;
A.H. Mueller and W-K. Tang, Phys. Lett. B284 (1992) 123. - [4] H. Abramowicz, L. Frankfurt, M. Strikman, Surveys in High Energy Phys. 11 (1997) 51.
-
[5]
J.J.Sakurai, Ann. Phys. (NY) 11 (1960) 1;
J.J Sakurai, Phys. Rev. Lett. 22 (1969) 981. - [6] See e.g. T.H. Bauer et al., Rev. Mod. Phys. 50 (1978) 261; Erratum Rev. Mod. Phys. 51 (1979) 407.
- [7] T.J. Chapin et al., Phys. Rev. D31 (1985) 17.
- [8] ZEUS Collab., J. Breitweg et al., Eur. Phys. J. C2 (1998) 247.
- [9] S.J. Brodsky et al., Phys. Rev. D50 (1994) 3134.
-
[10]
M.G. Ryskin, Zeit. Phys. C57 (1993) 89;
M.G. Ryskin, R.G. Roberts, A.D. Martin and E.M. Levin, Zeit. Phys. C76 (1997) 231. - [11] J. Bartels, J.R. Forshaw, H. Lotter and M. Wüsthoff, Phys. Lett. B375 (1996) 301.
- [12] D.Yu. Ivanov, Phys. Rev. D53 (1996) 3564.
- [13] V.L. Chernyak and A.R. Zhitnitsky, Phys. Rep. 112 (1984) 173.
- [14] I.F. Ginzburg and D.Yu Ivanov, Phys. Rev. D54 (1996) 5523.
- [15] P.D.B. Collins, An Introduction to Regge Theory and High-Energy Physics, Cambridge University Press, Cambridge, England, 1977.
- [16] G.A. Jaroszkiewicz and P.V. Landshoff, Phys. Rev. D10 (1974) 170.
- [17] P.D.B. Collins, F.D. Gault and A. Martin, Nucl. Phys. B80 (1974) 135.
- [18] G. Giacomelli, Phys. Rep. 23C (1976) 123.
- [19] J.P. Burq et al., Phys. Lett. B109 (1982) 124; Nucl. Phys. B217 (1983) 285.
- [20] A. Donnachie and P.V. Landshoff, Nucl. Phys. B231 (1984) 189.
- [21] A. Levy, Phys. Lett. B424 (1998) 191.
- [22] E. Gotsman and A. Levy, Phys. Rev. D13 (1976) 3036.
- [23] D.P. Barber et al., Zeit. Phys. C12 (1982) 1.
- [24] ZEUS Collab., M. Derrick et al., Phys. Lett. B297 (1992) 404; Phys. Lett. B303 (1993) 183; The ZEUS Detector, Status Report 1993, ed. U. Holm.
-
[25]
N. Harnew et al., Nucl. Instr. Meth. A279 (1989) 290;
B. Foster et al., Nucl. Phys. B, Proc-Suppl. B32 (1993) 181;
B. Foster et al., Nucl. Instr. Meth. A338 (1994) 254. -
[26]
A. Andresen et al., Nucl. Instr. Meth. A309 (1991) 101;
A. Caldwell et al., Nucl. Instr. Meth. A321 (1992) 356;
A. Bernstein et al., Nucl. Instr. Meth. A336 (1993) 23. -
[27]
D. Kisielewska et al.,
DESY-HERA 85-25 (1985);
J.Andruszków et al., DESY 92-066 (1992). - [28] M. Arneodo, L. Lamberti, R. Ryskin, Comp. Phys. Commun. 100 (1997) 195.
- [29] M. Kasprzak, PhD thesis, Warsaw University, DESY F35D-96-16(1996).
- [30] CHLM Collab., M. Albrow et al., Nucl. Phys. B108 (1976) 1.
- [31] L. Adamczyk, PhD thesis, Academy of Mining and Metallurgy, Cracow (1999).
- [32] ZEUS Collab., Study of vector meson production at large at HERA and determination of the Pomeron trajectory, paper 788 submitted to ICHEP98, Vancouver, 23-29 July, 1998.
- [33] R.L. Cool et al., Phys. Rev. Lett. 48 (1982) 1451.
- [34] K. Kurek, DESY 96-209 (1996).
- [35] P. Söding, Phys. Lett. 19 (1966) 702.
- [36] M. Ross and L. Stodolsky, Phys. Rev. 149 (1966) 1172.
- [37] Particle Data Group: Review of Particle Properties, Phys. Rev. D50 (1994) 1.
- [38] ZEUS Collab., J. Breitweg et al., Eur. Phys. J. C6 (1999) 603.
- [39] ZEUS Collab., M. Derrick et al., Zeit. Phys. C73 (1997) 253.
- [40] H1 Collab., C. Adloff et al., Zeit. Phys. C75 (1997) 607.
-
[41]
K. Schilling, P. Seyboth and G. Wolf, Nucl. Phys. B15 (1970) 397;
K. Schilling and G. Wolf, Nucl. Phys. B61 (1973) 381. - [42] F.J. Gilman et al., Phys. Lett. 31B (1970) 387.
- [43] J. Ballam et al., Phys. Rev. D7 (1973) 3150.
- [44] ZEUS Collab., J. Breitweg et al., DESY 99-102 (1999).
- [45] H1 Collab., C. Adloff et al., DESY 99-010 (1999).
- [46] ZEUS Collab., M. Derrick et al., Phys. Lett. B377 (1996) 259.
- [47] ZEUS Collab., M. Derrick et al, Phys. Lett. B380 (1996) 220.
- [48] ZEUS Collab., M. Derrick et al., Zeit. Phys. C75 (1997) 215.
- [49] H1 Collab., C. Adloff et al., Zeit. Phys. C75 (1997) 607.
- [50] H1 Collab., S. Aid et al., Nucl. Phys. B468 (1996) 3.
- [51] I. Royen and J.-R. Cudell, Nucl. Phys. B545 (1999) 505.
- [52] V.N. Gribov and L.Ya Pomeranchuk, Phys. Rev. Lett. 8 (1962) 343.
- [53] J.J.J. Kokkedee, The quark model, W.A. Benjamin, Inc., New York, USA, 1969.
- [54] D. Aston et al., Nucl. Phys. B209 (1982) 56.
- [55] H1 Collab., S. Aid et al., Nucl. Phys. B463 (1996) 3.
- [56] A. Donnachie and P.V. Landshoff, Phys. Lett. B296 (1992) 227.
- [57] P.G.O. Freund, Nuovo Cim. 48 (1967) 541.
- [58] H.J. Behrend et al., Nucl. Phys. B144 (1978) 22.
- [59] G. McClellan et al., Phys. Rev. Lett. 26 (1971) 1593.
- [60] R. Anderson et al., Phys. Rev. D1 (1970) 27.
- [61] J. Busenitz et al., Phys. Rev. D40 (1989) 1.
| ZEUS 1995 | |
|---|---|
| (GeV2) | dd(bGeV2) |
| ZEUS 1995 | |
|---|---|
| (GeV2) | dd(bGeV2) |
| ZEUS 1995 | |
|---|---|
| (GeV2) | dddd |
| ZEUS 1995 | ||||
|---|---|---|---|---|
| interval (GeV2) | (GeV2) | |||
| ZEUS 1995 | ||||
|---|---|---|---|---|
| interval (GeV2) | (GeV2) | |||
| ZEUS 1995 | |
|---|---|
| (GeV2) | dd(bGeV2) |
| ZEUS 1995 | |
|---|---|
| (GeV2) | dd(bGeV2) |
| ZEUS 1995 | |
|---|---|
| (GeV2) | dddd |
| ZEUS 1995 | |
|---|---|
| (GeV2) | dd(bGeV2) |
| ZEUS 1995 | |
|---|---|
| (GeV2) | dd(bGeV2) |
| ZEUS 1995 | |
|---|---|
| (GeV2) | dddd |
| ZEUS 1995 | |
|---|---|
| (GeV2) | dd(bGeV2) |
| ZEUS 1995 | |
|---|---|
| (GeV2) | dd(bGeV2) |
| ZEUS 1995 | |
|---|---|
| (GeV2) | dd(bGeV2) |
| ZEUS 1995 | |
|---|---|
| (GeV2) | dddd |
| ZEUS 1995 | |
|---|---|
| (GeV2) | dddd |
| ZEUS 1995 | |
|---|---|
| (GeV2) | dddd |
| ZEUS 1995 | |
|---|---|
| (GeV2) | dddd |