DESY 99-157
October 12, 1999
Electroweak and CP violation physics
at a Linear Collider Z-factory
R. Hawkings
DESY-FLC / Universität Hamburg
K. Mönig
DESY Zeuthen
Abstract
A future linear collider such as TESLA may be able to run on the resonance with very high luminosity and polarised electron and positron beams. The possibilities of measuring electroweak quantities with high precision are investigated. Huge improvements with respect to the present precision can be expected, especially for the asymmetries and where beam polarisation can be exploited. The very large sample of events also allows studies of various CP-violating b decays. The precision achievable on the CKM unitarity triangle angles is comparable to experiments at b factories and future hadron colliders.
1 Introduction
The primary motivation for a next generation linear collider is the study of collisions at centre of mass energies beyond 200 GeV. However, by adding an auxiliary positron source, it may be possible to run with high luminosity () and polarised beams at the peak of the resonance [1]. This luminosity would allow the accumulation of hadronic decays in about 70 days running, opening up the possibility to repeat the electroweak measurements currently performed at LEP and SLD with much higher precision.
A sample of decays represents a gain of about 100 over the LEP1 data sample. However, with the beam polarisation and good b-tagging capability at a linear collider, the more relevant comparison is with SLD, where the gain will be more like a factor of 2000. With beam polarisation, the variable that is most sensitive to the effective weak mixing angle is , the left-right asymmetry in decays. Using , SLD at SLAC was able to measure the weak mixing angle to a better accuracy than any single observable at LEP with less than a tenth of the luminosity [2]. Although the present SLD analysis technique is limited by the precision of the electron polarisation measurement, the availability of positron polarisation at a linear collider allows the polarisation to be measured from cross section asymmetries. Using a scheme first proposed by A. Blondel for LEP [3], external measurements are then only needed for polarisation differences.
This large data sample would also contain about b hadrons, a large enough sample to study rare CP-violating b decays. The linear collider offers a number of advantages over other facilities: the beam polarisation allows a very good initial state tag from the b-quark forward-backward asymmetry, the data sample is larger than that from asymmetric b factories, whilst the environment is much cleaner than that at hadron colliders. Competitive measurements of the angles of the CKM unitarity triangle may thus be possible.
The precision attainable on such electroweak and CP-violation measurements is studied in this paper. The basic assumptions used are described in Section 2, followed by discussions of the lineshape parameters in Section 3 and in Section 4. The measurement of , including the Blondel scheme for the polarisation determination, is described in detail in Section 5, followed by in Section 6. The potential for measurement of the CKM unitarity triangle angles , , and is investigated in detail in Section 7. Finally, the conclusions are given in Section 8.
2 Data sample and assumptions
The TESLA linear collider should be able to deliver a luminosity of at the -pole with the aid of an auxiliary positron source [1]. With this luminosity, the sample of hadronic (corresponding to ) assumed in this paper can be produced in about 70 days running—a small cost to the overall physics program of the collider. The detector, trigger and data acquisition must of course be able to cope with the trigger rate of 200 Hz from hadronic decays.
It will be assumed that the electron and positron beams can be polarised with polarisations of % and %. This corresponds to an equivalent polarisation of . Additionally, the polarisation should be switchable randomly from train to train.
The energies of both the electron and positron beams can be measured with a spectrometer similar to the one currently being installed in LEP [4]. Fast energy scans should be possible, so that the spectrometer can be calibrated relative to from LEP. With this scheme a precision of 1 MeV might be reached. It should be noted that the relevant parameter to correct the electroweak measurements is the difference , so that the error on does not enter when the spectrometer is calibrated relative to the mass.
3 Lineshape parameters
The parameters that are measured at LEP in the scan around the resonance are:
-
•
the mass of the
-
•
the width of the
-
•
the hadronic peak cross section
-
•
the ratio of the hadronic and leptonic partial widths
Since is used to calibrate the spectrometer, its precision clearly cannot be improved at TESLA. With the large data sample, the error on is equal to the error on , so 1 MeV is within reach.
The error on the hadronic peak cross section is dominated by uncertainties coming from the luminosity measurement, mainly from theory. It is possible that with the high luminosity available at TESLA, processes with low cross section but small uncertainties like can be used, but here it will be assumed that no improvement on will be possible.
The partial width ratio receives substantial contributions from systematic uncertainties due to the leptonic and hadronic event selection. The uncertainties from the leptonic event selection, especially for muons, are mainly of a statistical nature, so can be assumed to scale with the luminosity. The uncertainty on the hadronic event selection will be assumed to stay at the best value reached at LEP (0.05%). A more careful study on this subject is in progress [5].
The interesting physics parameters that can be derived from the lineshape parameters are
-
•
the mass of the
-
•
the strong coupling constant at the -mass
-
•
the radiative correction parameter normalising the strength of the -couplings to the fermions
-
•
the number of light neutrino species
The possible improvements in these parameters are summarised in Table 1. It can be seen that an interesting gain can be obtained for and . is completely determined by , so no change is expected if the luminosity determination cannot be improved.
| LEP [2] | TESLA | |
|---|---|---|
4 Measurement of
The fraction of events within the hadronic event sample is closely related to the ratio of partial widths . plays a special role within the electroweak quantities, since in the ratio of widths practically all corrections from the electroweak propagator and QCD effects cancel, so that only measures corrections to the Z vertex. At LEP is limited by systematic errors, mainly from three sources:
-
1.
background from events. This error arises mainly from physics uncertainties in charm production and decay;
-
2.
background from light quark events containing a gluon splitting . This background is to a large extent irreducible and the error is due to the uncertainty in the rate of the gluon splitting process;
-
3.
hemisphere correlations from hard gluon radiation. Hard gluons emitted at large angle take energy from both hemispheres. Since the b-tagging efficiency is a function of the energy of the decaying b hadron, this leads to a correlation between the hemispheres.
The LEP analysis with the smallest error at present is from DELPHI [6], and has about equal statistical and systematic uncertainties. The DELPHI analysis uses a b-tag with an efficiency of 30 % and a purity of 98 %. At TESLA a purity of 99.3 % at the same efficiency seems feasible [7], reducing the statistical error by a factor of 20. At the same time the charm background is reduced by a factor of four. Even assuming no improvements in the understanding of charm production and decay by the time of TESLA, the systematics from this source will still be reduced accordingly.
The rate of gluon splitting into and pairs is measured at LEP. With the large event sample and high quality b-tag there is no doubt that this can be measured much more precisely at TESLA.
Rejection of non backgrounds is accomplished by exploiting the long decay length and high invarient mass of b hadrons. At TESLA, the impact parameter resolution (which determines the resolvablility of secondary vertices) is about a factor of 10 better than at LEP, and the losses of events will be mainly due to the invariant mass cut. Since the invariant mass is a Lorenz invariant quantity the energy dependence of the b-tag should be much less than at LEP, so that for QCD hemisphere correlations a reduction of a factor four to five is also realistic.
In summary a total error of can be expected. This is an improvement of a factor five compared to the present LEP average [2].
5 Measurement of
5.1 The Blondel scheme for the linear collider
In general the cross section for polarised beams can be written as
| (1) |
where and are the longitudinal polarisations of the positrons and electrons measured in the direction of the particle’s velocity. is the unpolarised cross section and the left-right asymmetry.
With the assumption of an absolute electron/positron polarisation of and , and the possible polarisation states and , four statistically independent measurements are possible:
where in the first sign denotes the positron and the second one the electron polarisation.
The left-right asymmetry is then given by
without any need for polarisation measurements.
The statistical error is given as usual by
where the derivatives are given by
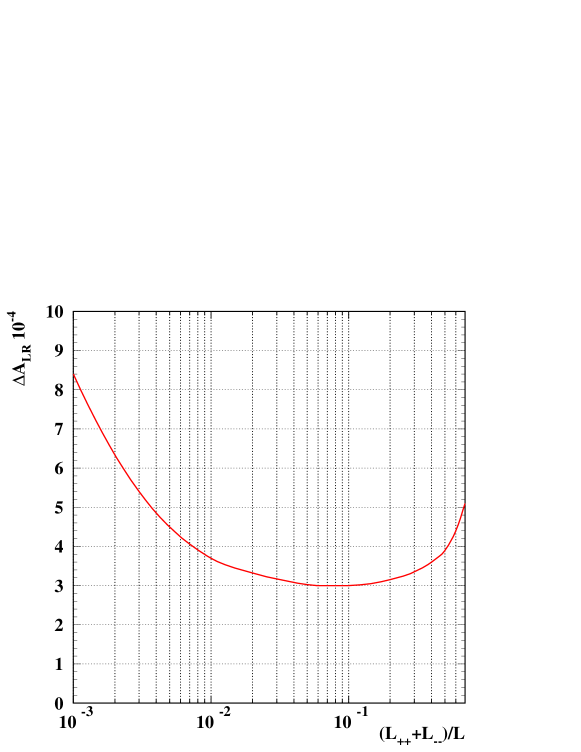
Ignoring the terms proportional to the derivatives for the large cross sections and are proportional to , whereas the ones at the small cross sections and are proportional to . In addition, for equal luminosity, the absolute errors on the large cross sections are larger than on the small ones, so that the optimal distribution of luminosities is around
| (2) |
Taking and the optimum is around 0.1, which means that very little luminosity is needed for the small cross sections and few are lost. Figure 1 shows the statistical error on for these polarisation values as a function of the luminosity spent on the small cross sections using . Since the minimum is very shallow no complicated optimisation procedure will be needed.
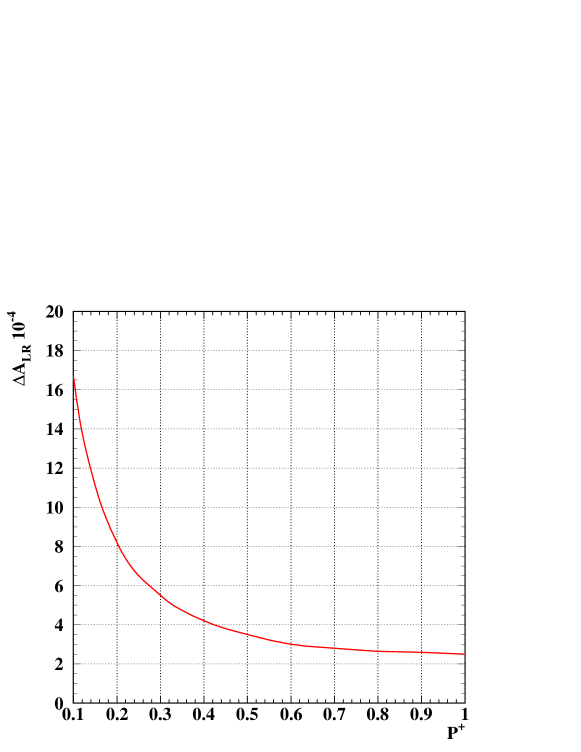
With recorded an error of can be reached. Figure 2 shows the statistical error as a function of the positron polarisation. For high values of the error is nearly constant, so that there is little to gain by increasing much above .
Although no absolute polarisation measurements are needed in this scheme, some relative measurements are still required. In particular the difference between the absolute values of the positive and negative polarisations of the same beam has a significant impact on the determination of . This will be treated in detail in section 5.1.1.
Other possible systematic errors should be well under control:
-
•
The change of with the centre of mass energy close to the peak of the -resonance is about , so the beam energy needs to be controlled to a precision of about 1 MeV.
-
•
Non-resonant backgrounds need to be kept below . This seems feasible from extrapolating the LEP experience.
-
•
To measure the luminosity differences between the different polarisation states a LEP-type luminometer measuring small angle Bhabha scattering is required. Again here only relative measurements need to be done.
-
•
The amount of beamstrahlung expected in the high luminosity running [8] changes by . It thus needs to be known to a precision of a few percent.
5.1.1 Measurement of the polarisation difference
In the scheme proposed here, a possible difference between the absolute values of the positive and negative polarisations of the same beam can only be measured with polarimetry. It will thus be assumed that Compton polarimeters of the same type as that operated at SLD [9] are installed in the electron and positron beams.
In this type of polarimeter the beam is scattered by a highly polarised laser beam. The sign of the laser polarisation is chosen at random and the asymmetry of the scattered electrons is analysed by a detector (Cherenkov in the case of SLD). The possibility of varying the laser polarisation enables the two electron (positron) polarisation states to be measured independently. The polarisation measurement is vulnerable to a possible polarisation dependent asymmetry of the laser currents. This problem can be overcome if, as at SLD, the detector consists of different channels with different analysing power.
With the simultaneous application of the Blondel scheme, the analysing powers of the different detector channels need not be known a priori, but can be obtained from data. The laser polarisation can be measured very precisely, and enters only in a term proportional to the small polarisation difference, so that its error is totally negligible. Assuming analysing powers of 0.4 and 0 for the two detector channels the error on becomes
where is the error on without the contribution from the polarimeter and is the ratio of Compton events in each polarimeter channel to the number of events. A value of , which seems no problem given the SLD experience, would thus increase the statistical error to .
5.1.2 Alternative measurement of the polarisation difference
If, in addition to the positive and negative polarisation, unpolarised beams are also used, nine different polarisation combinations are possible. In this scheme the polarisation of the positive and negative states can be measured separately from the data. The statistical error for this case increases to . However the residual polarisation of the unpolarised beam must be known to better than to get the systematic uncertainty from this source below the statistical error.
5.2 Interpretation of
Taking into account all the errors discussed above, a realistic estimate for the final precision on is . This corresponds to an error of 0.000013 in . At the Born level and enter in the definition of and all give uncertainties on the prediction at least one order of magnitude smaller than the experimental precision of the measurement. However, at this level of precision, the effects of radiative corrections also become important, which is of course the main interest in doing the measurement. Therefore all the parameters of the Standard Model enter into the prediction.
By far the largest correction comes from the running of the fine structure constant to the mass. Using only measurements of the hadronic cross section at low energies, a value of has been obtained [10], which translates into an error on of 0.00023. By imposing QCD for energies above 1.7 GeV the uncertainty was recently reduced by about a factor of four [11, 12, 13], but even this completely dominates over the experimental error. If the hadronic cross section can be measured to a precision of 1% for energies up to about 3.6 GeV, the error can be reduced by a total factor of nine. If it is known to 1% up to the resonance at 9.5 GeV, the total reduction would be a factor of 14 [13]. This would correspond to .
A top mass error of 1 GeV would contribute an uncertainty of 0.000032 to the prediction. At TESLA it should be possible to measure to 120 MeV, so that the top contribution to will be negligible.
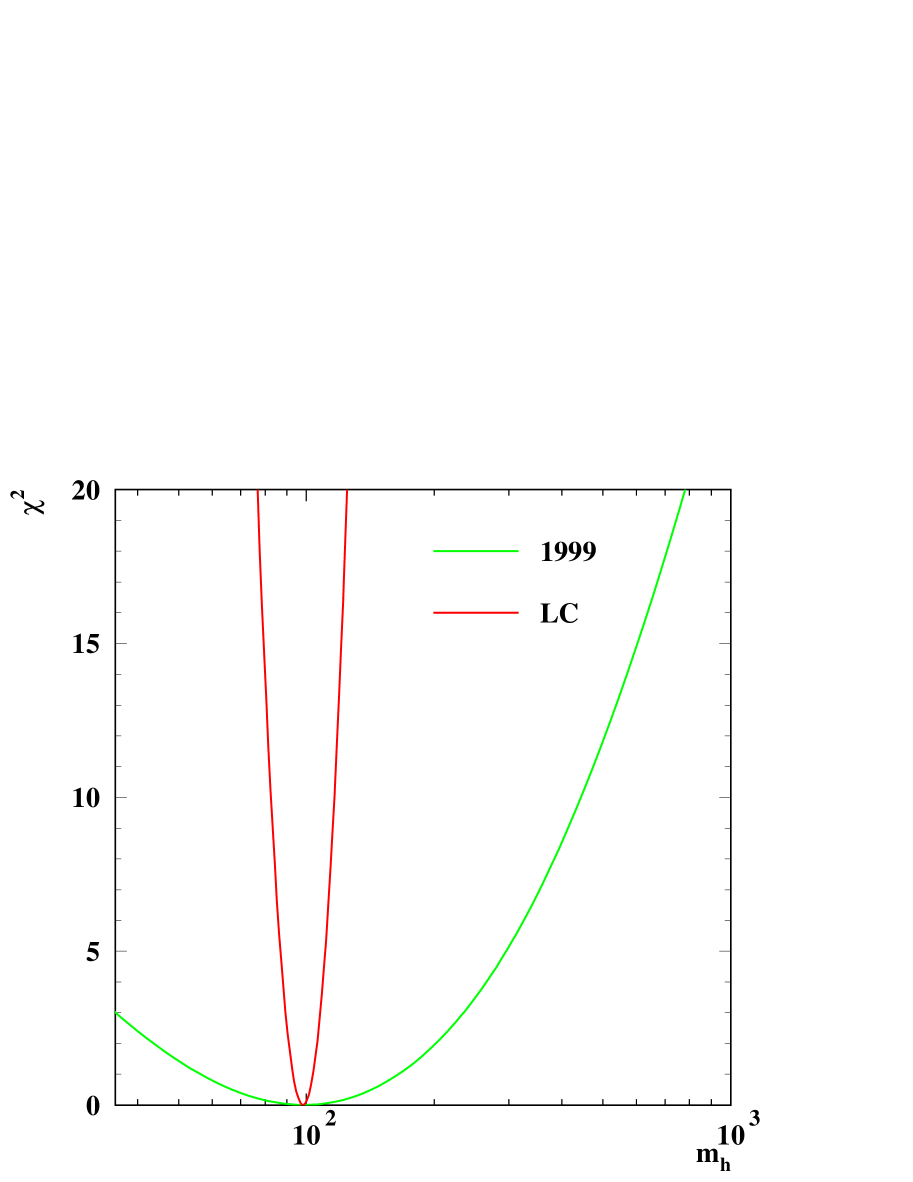
A variation in the Higgs mass changes by 0.000025. If the Higgs is found by the time the measurement is done, its mass can be measured with 200 MeV precision, so that it does not contribute to the uncertainty. If the Higgs is not found, the measurement of can be used to predict its mass to a precision of . To visualise this improvement, Figure 3 shows the fit as a function of the Higgs mass for the present electroweak precision data [2] and for the TESLA expectation.
6 Measurement of
At LEP the forward backward asymmetry for a quark measures the product of the coupling parameters for the initial state electron and the final state quark:
If polarised beams are available the left-right-forward-backward asymmetry is sensitive to the final state coupling only:
Statistically this quantity is a a factor more sensitive to than . However most systematic errors are proportional to the asymmetry, so are not reduced by using instead of .
At LEP two methods are used to measure , leptons with high (transverse momentum with respect to the jet axis) and a jet charge measurement combined with a lifetime b-tag. With the better b-tagging possibilities at a linear collider additional methods like vertex-charge techniques are possible, as has been demonstrated at SLD [14]. However in the following only the extrapolation of the LEP methods will be discussed.
For the lepton measurement the ALEPH analysis [15] is taken as a reference. The statistical error with the assumed number of events will be . With this projected uncertainty the ALEPH analysis would be completely dominated by the systematics from light and especially charm quarks. However, this error can be reduced to the same size as the statistical error using a b-tag with efficiency and a charm rejection of a factor 50, which seems feasible [7].
-mixing introduces a correction to the measured asymmetry () so that must be measured from double lepton events. This introduces an additional statistical error of . If the mixing analysis is done with the same lepton selection as the asymmetry analysis, all uncertainties due to the sample composition of the events cancel. Thus a total error of from the lepton analysis should be possible.
For the jet charge method the recent DELPHI analysis [16] will be extrapolated. The statistical error is expected to become . With the same efficiency for the b-tag as in the DELPHI analysis (75%) the purity will be 99% instead of 92% [7] leading to a systematic error from light quark backgrounds of . Some further optimisation in the efficiency-purity working point is clearly possible.
Another source of uncertainty is hemisphere correlations. With a cut on the thrust of the events (see fig 4 [17]) the correlation can be brought down to the level, so that even taking the full correlation as systematic uncertainty a total error of from the jet charge analysis is possible.

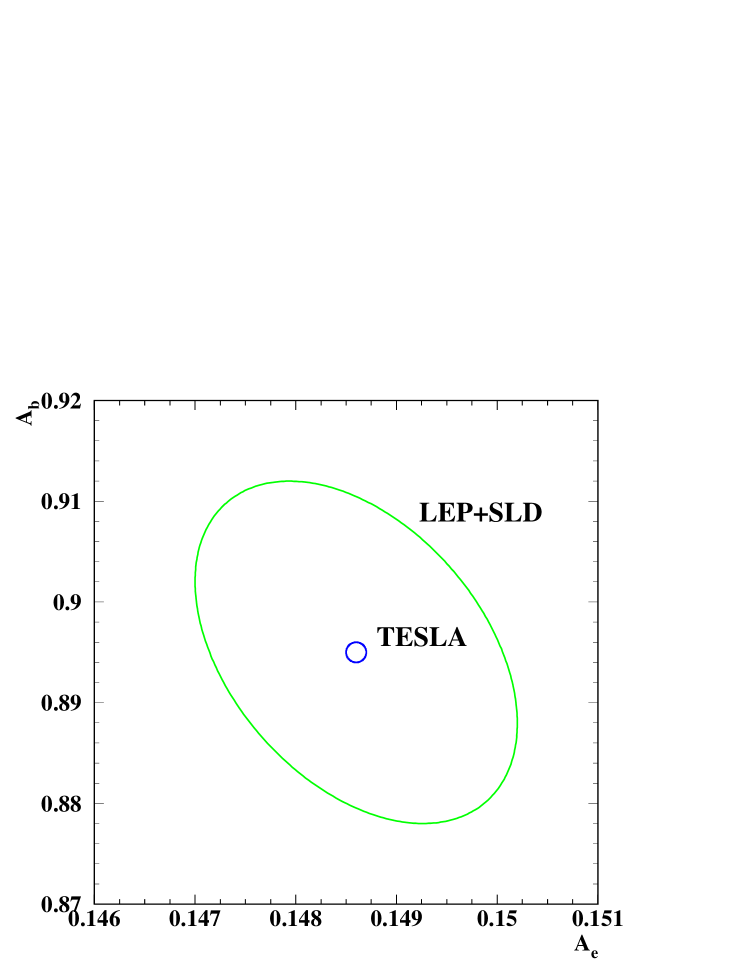
Combining the two asymmetry analyses, a total error of seems realistic. As can be seen from Figure 5, this is an improvement of similar size as that obtainable on .
7 CP violation physics
A data sample of hadronic would include b hadrons, which may allow competitive measurements of the angles of the CKM unitarity triangle. The possibilities of measuring the angles , , and in both and decays is investigated in this section, and the results compared with those achievable at BaBar, CDF, ATLAS and LHC-b (taken as representative also of the results achievable at BELLE, D0, CMS and B-TeV respectively).
Some of the CP violation analyses make stringent demands on the performance of the detector, and considerable advances over LEP detectors in the areas of tracking and vertex reconstruction are required. Where necessary, the ‘reference detector’ described in the TESLA linear collider conceptual design report [18] is assumed. It should be noted that no dedicated particle identification devices (e.g. Cherenkov detectors) have been added, but the use of information in the TPC is explored. The detector performance has been studied using both the fast simulation program SIMDET 3.1 [19] and the full GEANT simulation BRAHMS 1.02 [20]. Both of these simulation tools implement the detector geometry as described in [18].
7.1 Initial state tagging
Most of the CP violation studies of interest involve measuring the time-dependent asymmetry in the decay of and mesons to a CP eigenstate : . The asymmetry takes the form:
| (3) |
where is the mixing parameter. Since the final state is a CP eigenstate (e.g. , ), the initial state ( or ) must be determined (‘tagged’) from information elsewhere in the event. In most experiments, this is done by exploiting the pair production of , and tagging the state (b or ) of the other quark in the event (which in general does not decay to a CP eigenstate). However, both the efficiency and the purity of this procedure is low, leading to a significant ‘mistag’ (events tagged incorrectly).
The use of polarised beams at TESLA, combined with the large forward-backward asymmetry of the b quark coupling to the , allows a different method to be used, as at SLD [21]. With polarised beams, the differential cross section for takes the form:
| (4) |
where and are the fermion couplings to the [22], and is the effective polarisation. This cross section is plotted in Figure 6(a) for the expected polarisation levels of and . The very large asymmetry resulting from the high level of effective polarisation when and have opposite signs is clearly seen.

This asymmetry can be used to tag the initial b quark flavour, by simply assuming (for ) the forward () hemisphere contains the b quark and the backward () contains the antiquark. The resulting mistag rate is 0.5 (equivalent to purely random tag assignment) when , but drops to e.g. only 6 % at . The tagging power can be quantified by means of the ‘separation power’ , defined generally as where is the tagging efficiency and the dilution [23]. The dilution represents the reduction in the size of the measured asymmetry due to the imperfect initial state tagging, and gives the corresponding loss in the total number of events—one imperfectly tagged event is equivalent to perfectly tagged events. With the polarisation tag, the mistag depends strongly on , and the effective separation is given by the integral:
where is the mistag rate at any particular value of . For , and , i.e. assuming a uniform event reconstruction efficiency up to , the separation is . For the 10 % of the luminosity taken with same sign polarisation to minimise the error on , the separation is only , and is not useful. These values should be compared with typical values of in LEP oscillation analyses, at CDF (for the analysis [24]), similar values of about 0.06 for future hadron collider experiments and 0.2–0.3 expected for BaBar at an b factory [23].
It is clear that the initial state tagging with polarised beams offers an important advantage over other facilities, and the tagging can be further improved by combining the polarisation information with all the other tags used at LEP and SLD. A separation of has been used throughout this note, and even higher values may be achievable with appropriate combination of tags.
7.2 Measurement of
The cleanest way to measure the angle is to study the decay mode , where the time dependent asymmetry follows equation 3 with and . The decay is easy to reconstruct with or and , and first results have already been obtained from existing experiments [24, 25]. With and a reconstruction efficiency of 30 % (OPAL achieved 20 % with inferior tracking and mass resolution), a total of 1900 reconstructed events would be expected. The effects of time resolution and combinatorial background should be small, leading to an expected error on of . This should be compared with for BaBar in 1 year of running () [23], for CDF from run II () [26], from ATLAS in 1 year [27] and 0.01–0.02 from LHC-b [28].
It is clear that in this relatively easy decay channel, the huge number of events reconstructed at LHC gives a decisive advantage. However, can also be measured in many other decay modes, for example , , , and . An important part of the b factories’ physics program will be to measure in all these modes, and demonstrate consistent results. Some of these decay modes are difficult at hadron colliders, but should be accessible in the cleaner environment of the linear collider. With the larger number of events and better tagging than at b factories, the linear collider should be able to significantly improve on some of these measurements.
7.3 Measurement of
The measurement of requires the study of a decay with a contribution from . The simplest such decay is , whose asymmetry can be used to measure in the same way as the asymmetry in measures . However, in the decay, there are significant complications resulting from so called ‘penguin’ diagrams, which destroy the simple relationship between and the measured asymmetry [23, 28]. In the absence of penguin contributions, the asymmetry takes the form given by equation 3 with and , but penguin contributions introduce decay amplitudes with different strong phases, leading to and . The measured values of the coefficients and can be used to extract , providing the amount of penguin contribution is known.
Unfortunately, the contribution of penguin decays is now expected to be significant, as the penguin dominated decay has been measured to have an unexpectedly large branching ratio of , whilst only an upper limit of has been set on the branching ratio of [29]. This has two serious implications for the determination of in the channel:
-
1.
The decay has a large background from , which must be cleanly separated, since it is also expected to have a (different) non-trivial CP violating asymmetry.
-
2.
The relative contributions of tree and penguin decays in must be determined, to allow the extraction of from the measured values of and . One promising technique is to use an isospin analysis, which requires measurement of the three branching ratios for the decays , and .
Hence a determination of requires both a measurement of the asymmetry in and measurement of the three branching ratios for the isospin analysis. These measurements are discussed in more detail below.
7.3.1 Asymmetry measurement for
The reconstruction of decays has been studied with the full detector simulation program BRAHMS, but simulating only the tracking detectors. The candidate selection was based on the OPAL search for this decay [30]. After requiring the direction of the thrust axis to satisfy , jets were reconstructed using a cone algorithm with half-angle 0.65 rad and minimum jet energy 5 GeV. All possible opposite-charge pairs of tracks in each jet were then combined as possible candidates, requiring the vertex probability to exceed 1 %, the decay length significance to exceed 3 and the b hadron candidate energy to exceed 25 GeV. Additionally, the opening angle between the two tracks was required to be less than 0.5 and the angle of the in the rest frame of the was required to satisfy [30]. Finally the reconstructed mass of the candidate was required to be in the range 5.258–5.299 GeV. The entire selection is 46 % efficient for and results in about 900 selected events from decays for a branching ratio of , as assumed in [23].

The resulting invariant mass spectrum for and decays is shown in Figure 7(a), assuming equal branching ratios for the two decay modes. The very good tracking resolution of the linear collider detector gives a signal peak with RMS of 11 MeV, and this is enough to largely separate the signal from the background. Within the mass region of 5.258–5.299 GeV, the signal to background ratio is about 10:1. This is in contrast to other experiments, where particle ID has to be used to separate the two decays. By making an additional cut of , exploiting the correlation between the decay angle and the effective reconstructed mass for the decay, the background can be further reduced to a negligible level for a 50 % loss in signal.
The very good mass resolution allows the effective suppression of the background without particle ID. However, the TPC of the proposed detector offers the possibility of also using some information. The performance of this has been estimated to give 1.5–2 separation between pions and kaons in the momentum range of interest (10–30 GeV) [31]. This modest performance allows the signal to noise ratio to be increased to 40:1 for a 50 % loss in signal efficiency, as shown in Figure 7(b), before the application of the cut. Although it is not needed in this particular channel, the information may be useful in other studies (e.g. 3 body decays) where the cut cannot be applied.
Apart from the decay, the main background is expected to be combinatorial in nature. This has been evaluated in two ways (i) with a sample of decays simulated in BRAHMS, and (ii) by making extrapolations from the background seen in the OPAL search for the decay [30], accounting for the better mass resolution of the linear collider detector. Both methods are statistically limited, and lead to an expected signal to noise ratio of 3:1 or better.
The precision to which the parameters and can be measured can be used as a ‘figure of merit’ for the various experiments. Assuming a signal to background level of 3:1, no residual contamination from decays and no CP violation in the combinatorial background, a simple fit to the asymmetry gives and in decays. The latter uncertainty can be interpreted as a statistical error on in the absence of penguin contributions. The equivalent numbers for other experiments are 0.26 for BaBar [23], 0.10 for CDF [26], 0.14 for ATLAS [27] and 0.05 for LHC-b [28], from the same integrated luminosities as discussed in section 7.2. It should be noted that ATLAS has no particle ID and insufficient mass resolution to separate the and final states, so the analysis will be very difficult in the presence of this background. It can be seen that in this measurement the linear collider is very competitive with other experiments, offering comparable precision to LHC-b in a very different environment.
7.3.2 Branching ratio measurements for and
The extraction of the penguin and tree amplitudes in can be achieved by measurement of the three branching ratios , and . The first can be easily be measured as a by product of the asymmetry analysis discussed above, but the other two are more difficult. In particular, is expected to be extremely small, theoretical predictions being of the order and the experimental upper limit [29].
The feasibility of measuring the latter two branching ratios has been studied using the fast simulation SIMDET, which contains a parameterisation of the calorimeter response to overlapping particles derived from the full BRAHMS simulation. The reconstruction is similar to that used for the channel, but requires the explicit reconstruction of mesons in the calorimeter. The have a mean energy of about 15 GeV, at which the two photons from the decay have a typical angular separation of 0.04 rad, corresponding to a spatial separation of 5 cm at the calorimeter front face. Since the granularity of the proposed electromagnetic calorimeter is 0.015 rad [18], many are not clearly resolved into 2 photons but appear as a single wide electromagnetic cluster. Both pairs of identified photons with an invariant mass between 0.1 and 0.2 GeV, and single identified photons were therefore considered as candidates. The photon identification was taken directly from SIMDET, which includes an ‘energy flow’ matching algorithm to identify neutral and charged particles from the reconstructed tracks and calorimeter clusters.
Reconstructed candidates were combined in pairs or with charged hadrons to form and candidates, in both cases requiring the energy of each pion to exceed 8 GeV and that of the b hadron to exceed 25 GeV. The resulting invariant mass spectra in signal events containing or are shown in Figure 8. The invariant mass resolutions are dominated by the reconstruction, and are 160 and 120 MeV respectively, much worse than in the mode. This resolution is dominated by angular rather than energy resolution effects. Large tails to lower masses are also visible in the reconstructed mass distributions, caused by overlapping with other particles (from fragmentation) in the same jet, spoiling the energy measurement.

Due to the lower mass resolution and difficult reconstruction, these channels suffer from very large combinatorial background. This can be reduced by applying a b-tag on the opposite hemisphere of the event—an efficiency of 50 % for events with negligible contribution from other flavours was assumed. The remaining combinatorial background was assessed using a sample of events processed through SIMDET. These studies show that the background is composed mainly of random tracks and clusters from b decays and fragmentation forming the correct invariant mass. It can be reduced by applying a track based anti b-tag in the signal hemisphere (after first removing the candidate track in the case). The number of charged tracks from b decays in selected background hemispheres is shown in Figure 9(a) and (b). Although the b decay multiplicity is lower than average (about 5) in these hemispheres, a veto on any tracks with significant impact parameter can still be used to effectively suppress this background. A rejection factor of 10 (i.e. 90 % of background events rejected) for negligible loss of signal has been assumed.

After applying the anti-b tag in the signal hemisphere, the expected numbers of signal and background events in the mass window 5–5.5 GeV for various different branching ratio assumptions are listed in Table 2. The expected statistical errors on the branching ratio, taking into account the numbers of signal and background events and no uncertainty on the background level, are also given, and compared to those expected from BaBar after 10 years of running at nominal luminosity () [23]. It can be seen that these errors are somewhat larger than those from BaBar, and are in fact similar to those expected after only 5 years of BaBar running.
| Decay | Signal | Background | |||
|---|---|---|---|---|---|
| events | events | LC | BaBar | ||
| 1 | 26 | 107 | 0.44 | 0.29 | |
| 2 | 52 | 107 | 0.24 | 0.17 | |
| 3 | 78 | 107 | 0.17 | - | |
| 5 | 130 | 107 | 0.12 | 0.08 | |
| 2.5 | 95 | 577 | 0.27 | 0.20 | |
| 5 | 190 | 577 | 0.15 | 0.11 | |
| 7.5 | 285 | 577 | 0.10 | 0.08 | |
| 10 | 380 | 577 | 0.08 | 0.06 | |
The expected invariant mass spectra for and are shown in Figure 9(c) and (d). The background histograms are extrapolations from the small number of surviving events, so their shapes are somewhat uncertain. Nevertheless, it is clear that a good understanding of the background shape will be necessary to measure the signal branching ratios, and this may be rather difficult to achieve.
In summary, the measurement of the branching ratios and would be an important contribution to the understanding of CP violation in b decays, since it cannot be performed at hadron colliders. However, it looks rather difficult with the present detector and uncertainties in the level of background. To proceed further probably requires a more realistic calorimeter simulation and a more detailed study of the reconstruction and background rejection.
7.4 Measurement of , and
The study of time dependent asymmetries in decays provides a method of determining the CKM angle and the small angle (which is the ‘tilt’ of the second unitarity triangle formed from the relation ). mesons are not produced at all in decays (so are inaccessible to b factories unless they run at a higher resonance) and are only produced in 10 % of b decays at higher energies. The mixing frequency is also at least 25 times higher than that for mesons, so requiring very good time resolution to see the oscillations and asymmetries. Both of these factors make studies of decays much more challenging experimentally than studies of decays.
7.4.1 Measurements in and
Searches for oscillations at LEP, SLD and the Tevatron have so far been carried out mainly using semi-inclusive modes such as and . In these analyses, the energy of the (which is necessary to calculate the decay proper time) is estimated using reconstructed and missing energy. However, the limit on is now [32], and measuring significantly higher frequencies can only be done with rare fully reconstructed decays. The decay chain , with , provides a suitable decay mode to measure or set a limit on , whilst the similar provides a way of measuring .
These channels have been studied using the full GEANT simulation BRAHMS. The decay chain was fully reconstructed, requiring two oppositely charged tracks to make a candidate with GeV, combined with another track to make a candidate with GeV and a further opposite signed track to make a candidate. The 3 tracks from the were required to make a good vertex, as were the extrapolated track from the and the from the . The latter vertex was used to define the decay length. The energy was additionally required to exceed 20 GeV, but no particle ID () cuts were applied. The resulting mass distribution is shown in Figure 10(a), for signal events, and the same events reconstructed assuming the from the decay to have the kaon mass. The latter distribution, which forms a ‘reflection’ background for the reconstruction of is reasonably separated from the signal, without the need for particle ID. The signal mass resolution is about 8 MeV, without the application of any kinematic fit.

The reconstruction efficiency for this selection is about 20 %, but many of the losses occur in requiring good vertices, which may be improved with better tracking code. Assuming (by analogy with [22]) and [22] gives a total of about 500 reconstructed events in decays.
The proper time of each decay was reconstructed from the measured decay length (between the reconstructed primary vertex and the intersection of the and tracks) and reconstructed energy of each candidate. The energy resolution is extremely good (0.5 %) and the proper time resolution is dominated by the decay length reconstruction. This was simulated separately for each of the vertex detector options available in BRAHMS—CCD vertex detectors surrounding 1 cm and 2 cm radius beampipes, and an APS vertex detector with a 2 cm beampipe. The resulting proper time resolutions are shown in Figure 10(b)–(d), together with the resolutions obtained from a double Gaussian fit to the distribution of reconstructed minus true proper time. The resolution clearly depends strongly on which vertex detector option is chosen.
The sensitivity to oscillations as a function of can be quantified by means of the amplitude method [33]. The amplitude of oscillations at each ‘test’ value of is measured, in a method analogous to Fourier analysis. Oscillations are excluded if the value is excluded by the measurement, whilst exclusion of is required to establish a signal. The significance of the analysis is then quantified by the inverse of the error on , , which must be at least 5 to claim a signal (‘ discovery’), and at least to set a 95%̇ confidence level exclusion. The expected error can be calculated approximately by:
where is the number of events in the sample, the signal purity, the mistag and the proper time resolution. The results of this calculation for and are shown in Figure 11 for each of the vertex detector options. The background to the signal is expected to be combinatorial and very small, due to the very good mass resolution and two intermediate mass constraints ( and ). Hence values of close to one are expected to be realistic, although this has not been studied with simulation. With , it can be seen that oscillations can be discovered between 20 and , depending on the vertex detector options. This is comparable with the reach of CDF and ATLAS, though slightly lower than the expected by LHC-b [28]. The larger reach of LHC-b is due to the much higher numbers of reconstructed events—30000 as opposed to 500 for the linear collider, though the proper time resolutions are similar and the tagging better at the linear collider. However, such high values of should also be visible through their effects on the width difference (), and are currently disfavoured within the framework of the Standard Model.

The decay can be used to measure the CKM angle . However, its branching ratio is expected to be at least an order of magnitude smaller than that for , so only around 50 reconstructed events are expected in decays—not enough to measure the 4 time dependent decay rates necessary for this analysis. LHC-b expects around 2500 events per year in this channel [28] so the linear collider is clearly not competitive, even with the large statistical advantage in tagging power.
7.4.2 Measurements in
The decay is the analogue of the decay, and can be used to measure the CKM angle . This asymmetry is expected to be very small in the Standard Model, so a significant asymmetry would be a sign of new physics. However, as with the other decay modes discussed above, the relatively small number of mesons produced at the linear collider make it uncompetitive with LHC-b, and also with ATLAS and CMS in this decay channel which is easy to trigger on.
7.4.3 Measurements in and decays
Various other strategies, involving the decays of and mesons, have been proposed to extract or constrain . Some of these have been studied for BaBar [23] and LHC-b [28]. One method is to use rare and decays, however the combined branching ratios are so small that only a few events per year are expected at BaBar, and a few tens of events at LHC-b. In the linear collider should collect similar numbers to LHC-b, so if these analyses are possible at all, the linear collider should be able to make a useful contribution. However, these channels have not yet been studied in detail.
Another proposed method is to make use of flavour symmetries in and decays. The feasibility of reconstructing two body B decays has been discussed in Section 7.3. The reconstruction of has not yet been studied but should present no major problems. Again, if this analysis is possible, the linear collider should be able to make a useful contribution. However, the measurement of is also required, and if the penguin decay is also important, the linear collider will be at a disadvantage in not having particle ID—the mass resolution cannot be used effectively in final states containing reconstructed .
8 Summary and Conclusions
The possibilities for doing electroweak and CP violation physics using a sample of hadronic decays collected at a linear collider factory with polarised beams have been investigated. Huge improvements in the measurements of the coupling parameters and will be possible. can be measured to a precision on and to a precision of , corresponding to an error in of . However, to make this measurement useful the hadronic cross section below the needs to be measured to about 1% precision, in order to calculate the running of the fine structure constant up to the mass. If the Higgs has already been found, a stringent test of the Standard Model will be possible, and if not the Higgs mass can be predicted with 5% precision. Some interesting predictions in other models, such as the MSSM, can also be made [34]. However, the partial width measurements cannot be improved very much due to systematic error limitations. For a factor five may be possible, while for and only a factor two is possible.
For the CP violation studies, whilst no ‘golden’ measurements have been found that can be performed better than at any other facility, many useful measurements can be made that are complementary, and of a competitive precision, to those at b factories, the Tevatron and LHC. These measurements can be made with the standard linear collider detector optimised for high energy running, and do not require dedicated particle identification detectors. Useful contributions can be made to the study of the CKM angles and in a variety of decay modes. However, the study of , which mainly requires meson decays, does not appear to be competitive with the LHC, due to the much larger numbers of b decays produced at the latter machine.
In summary, with relatively little investment in time and money a large improvement in the electroweak precision observables can be achieved, and some competitive and complimentary CP violation measurements can be performed. The factory option is thus an attractive supplement to the already rich linear collider physics program.
Acknowledgements
The authors would like to thank R. Heuer, F. Jegerlehner, T. Mannel, T. Ohl, P. Rowson, M. Winter and M. Woods for useful discussions.
References
-
[1]
N. Walker TESLA luminosity at low centre of mass,
talk presented at the
DESY/ECFA workshop Frascati, 8 - 10 November, 1998.
http://wwwsis.lnf.infn.it/ecfadesy/index.htm - [2] The LEP collaborations, A Combination of Preliminary Electroweak Measurements and Constraints on the Standard Model, CERN-EP/99-15.
- [3] A. Blondel, Phys. Lett. B202 (1988) 145.
- [4] E. Torrence, Determination of the LEP centre-of-mass energy, talk presented at the EPS99 conference, Tampere, Finland, 15–21 July 1999, to appear in the conference proceedings.
- [5] M. Winter, private communication
- [6] DELPHI Collaboration, P.Abreu et al., A precise measurement of the partial decay width ratio CERN-EP/98-180, submited to Eur. Phys. J.
-
[7]
G. Borisov, Flavour tagging at LC,
talk presented at the
DESY/ECFA workshop Oxford, 20-23 March 1999
http://hepnts1.rl.ac.uk/ECFA_DESY_OXFORD/scans/0088_borisov.pdf - [8] T. Ohl, private communication.
- [9] M. Woods The scanning Compton polarimeter for the SLD experiment SLAC-PUB-7319 (1996).
- [10] S. Eidelmann and F. Jegerlehner, Z. Phys. C67 (1995) 585.
- [11] M. Davier and A. Höcker, Phys. Lett. B435 (1998) 427.
- [12] J. H. Kühn and M. Steinhauser, Phys. Lett. B437 (1998) 425.
-
[13]
F. Jegerlehner , Sigma Hadronic and Precision Tests of the SM,
Talk presented at the LNF spring school and EURODANE Collaboration
Meeting, Frascati 12.-17. April 99
http://www.ifh.de/~fjeger/Frascati99.ps.gz - [14] N. de Groot, Electroweak results from SLD, talk presented at XXXIVth Rencontres de Moriond, Electroweak Interactions and Unified Theories, Les Arcs, March 13-20 1999.
- [15] ALEPH Collaboration, D. Buskulic et al., Phys. Lett. B384 (1996) 414.
- [16] DELPHI Collaboration, P. Abreu et al., Eur. Phys. J. C9 (1999) 367.
- [17] Britta Schwering, private communication
- [18] Conceptual Design of a 500 GeV Linear Collider with Integrated X-ray Laser Facility, ed. R. Brinkman, G. Materlik, J. Rossbach and A. Wagner, DESY 1997-048, ECFA 1997-182.
- [19] SIMDET version 3, A Parametric Monte Carlo for a TESLA Detector, M. Pohl, H.J. Schreiber, DESY 99-030.
- [20] BRAHMS version 1.02, A Monte Carlo for a Detector at a 500/800 GeV Linear Collider, T. Behnke, G. Blair, M. Elsing, K. Mönig, M. Pohl, for a detailed description see http:///www.hep.ph.rhbnc.ac.uk/ blair/detsim/brahms/summary.ps.
- [21] See for example SLD collaboration, ‘Time Dependent Mixing using Inclusive and Semileptonic b decays at SLD’, SLAC-PUB-7885, paper 181 submitted to ICHEP-98 Vancouver.
- [22] Particle Data Group, C. Caso et al., Eur. Phys. J. C3 (1998) 1.
- [23] BaBar Collaboration, Report of the BaBar Physics Workshop, SLAC-R-504.
-
[24]
CDF collaboration, F. Abe et al., Phys. Rev. Lett. 81 (1998) 5513;
CDF collaboration, CDF/PUB/BOTTOM/CDF/4855. - [25] OPAL collaboration, K. Ackerstaff et al., Eur. Phys. J. C5 (1998) 379.
- [26] M. Paulini, B Lifetimes, Mixing and CP Violation at CDF, hep-ex/9903002.
- [27] P. Eerola, B physics potential of ATLAS, talk presented at LHCC open meeting, March 3, 1998.
- [28] LHC-b Collaboration, Technical Proposal, 20th February 1998.
-
[29]
CLEO collaboration, R. Godang et al., Phys. Rev. Lett. 80 (1998) 3456;
S. Stone, talk presented at Weak Interactions and Neutrinos 99, January 24–30, 1999, Cape Town, South Africa. - [30] OPAL collaboration, R. Akers et al., Phys. Lett. B337 (94) 393.
- [31] M. Hauschild, talk presented at the January 11th meeting of the ECFA/DESY linear collider workshop detector subgroup meeting.
- [32] Combined Results on oscillations: results for summer 1998 conferences, LEP b oscillations working group, LEPBOSC 98/3, September 4th, 1998, for further details see http://www.cern.ch/LEPBOSC/combined_results/vancouver_1998/.
- [33] H.-G. Moser and A. Roussarie, Nucl. Instrum. Methods A384 (1997) 491.
- [34] S. Heinemeyer, T. Mannel, G. Weiglein, Implications of results from Z- and WW-threshold running, DESY-99-117, hep-ph/9909538.