Production of mesons in collisions at 530 and 800 GeV/
pacs:
PACS numbers 13.85.Ni, 12.38.Qk, 25.40.VeAbstract
We report on the production of mesons in 530 and 800 GeV/ collisions in the Feynman- range 0.00.6. The mesons were detected via decays into . Differential distributions for production have been measured as functions of , , and cosine of the Gottfried-Jackson decay angle. These distributions are compared with results on production obtained in 515 GeV/ collisions, measured by the same experiment, as well as with results from other experiments using incident protons.
I Introduction
Studies of charmonium production in hadron collisions provide important information on both perturbative and non-perturbative QCD. Recent advances in the understanding of quarkonium production have been stimulated by the unexpectedly large cross sections observed for direct and production at large measured at the Fermilab Tevatron [1]. These observations have led to renewed interest in this field and to an improved theoretical understanding of production mechanisms. In particular, a new model has been developed to explain the CDF results: the color-octet mechanism [2, 3]. In the original color-singlet model [4], charmonium mesons retain the quantum numbers of the pairs produced in the hard scatters, and thus each state can only be directly produced via the corresponding hard scattering color-singlet sub-processes. The color-octet mechanism extends the color-singlet approach by taking into account the production of pairs in a color-octet configuration accompanied by a gluon. The color-octet state evolves into a color-singlet state via emission of a soft gluon.
Another recent analysis of photo- and hadro-production data [5] resurrects the twenty-year-old color evaporation approach. This approach differs from Ref. [2, 3] in the way the pair exchanges color with the underlying event. It assumes multiple exchanges of soft gluons, whereas such interactions are suppressed in the color octet model by powers of , the relative velocity of the heavy quarks within the system. These multiple soft gluon exchanges destroy the initial polarization of the heavy quark pair. Therefore, polarization measurements may provide the best tool to distinguish between these phenomenological models.
In addition to the Tevatron collider data, a number of new results have become available at fixed-target energies [6, 7, 8, 9, 10]. These measurements provide further tests for the color octet and color evaporation models [3].
In this paper, we report on differential distributions for production in 530 GeV/ and 800 GeV/ collisions, and compare these distributions with our published results based upon studies of 515 GeV/ collisions [6]. The pion and proton data samples were collected during the 1990 and 1991 Tevatron fixed-target runs, respectively, using essentially the same apparatus. In addition, during the 1991 fixed-target run we recorded a lower statistics sample of data using a 515 GeV/ negative pion beam to verify the consistency of data samples from the two runs.
We also compare the distributions from the 800 GeV/ incident proton data with the recently published results from Fermilab experiments E789 [8, 9] and E771 [10] obtained at the same energy. The range covered by this analysis (0.00.6) complements the ranges studied in Ref. [8] (0.30.95), in Ref. [9] (-0.0350.135), and in Ref. [10] (-0.050.25).
II Apparatus
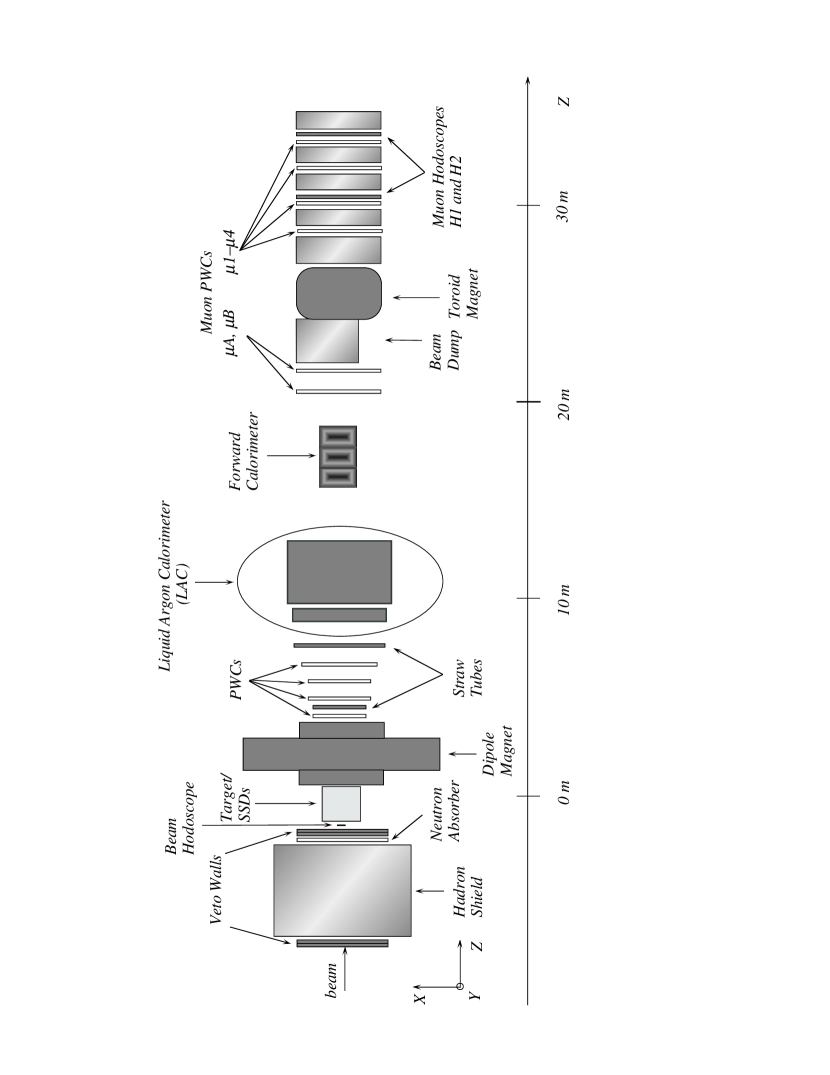
The experiment was performed in the Fermilab Meson West beam line using a large-aperture, open-geometry spectrometer with the capability of triggering on the presence of high-mass muon pairs [6, 11]. The layout of the experiment is shown in Fig. 1. A brief description of the essential elements of the Meson West apparatus as implemented during the 1991 fixed-target run is presented below.
The beam line included a 42-m-long differential Cerenkov counter capable of tagging incident beam particles. The unseparated positive secondary beam at 530 GeV/ was composed primarily of protons with a small admixture (3%) of pions [12]. The 800 GeV/ beam was a collimated primary proton beam extracted from the Tevatron. The beam intensity varied during the run, and at its maximum was 2 protons per 23-second-long spill (at 57 second intervals).
A hadron shield consisting of 5 m of iron was located upstream of the target to reduce background from off-axis hadrons and soft muons. Two scintillator veto walls were placed upstream of the hadron shield, and two others were located downstream of the shield. These veto walls were used to identify high energy muons that penetrated the iron. An on-line veto in the dimuon trigger rejected events containing coincidences between signals from either of the upstream veto walls and either of the downstream veto walls.
The incident beam was defined via a three plane (X, Y, and U) beam hodoscope with millimeter-scale resolution, combined with a beam halo (BH) system of four scintillation counters located upstream of the target. A beam particle was identified by at least a two-fold coincidence from the beam hodoscope in the absence of any signal from the BH system. The BH counters formed a rectangle with a 1 cm diameter hole centered on the beam. Signals from the beam hodoscope were also employed to reject events containing more than one spatially isolated incident beam particle.
The target consisted of two copper pieces, each 0.8 mm thick, followed by a 15-cm-long liquid hydrogen target with 0.25 cm and 0.28 cm thick beryllium windows upstream and downstream of the hydrogen target, respectively. A 2.54 cm thick beryllium piece was located immediately downstream of the second window. The total thickness of the target material corresponded to 11% of a proton interaction length.
Three X-Y modules of silicon-strip detectors (SSDs) were located upstream of the target to measure the trajectories of incident beam particles. Each module consisted of two single-sided planes. Five more X-Y SSD modules were located downstream of the target. These modules were used to measure the trajectories of charged particles produced in the target and to reconstruct primary and secondary vertices. The SSDs in the first downstream module had a 25-m-pitch inner region and a 50-m-pitch outer region; the SSDs in the other modules had 50 m pitch throughout.
A dipole magnet, producing a impulse of 0.45 GeV/, was located downstream of the SSDs. Four proportional wire chamber (PWC) modules were located downstream of the dipole magnet. Each module contained four wire planes to provide X, Y, U, and V measurements. (The U and V coordinates were a pair of orthogonal coordinates rotated by relative to the X and Y coordinates.) The wires in each plane had 2.54 mm pitch. An area of from 6 to 26 cm2 in the center of each plane had reduced sensitivity to provide protection against beam particles. Two stations of straw tube drift chambers, each with four planes in the X and four planes in the Y directions, were located adjacent to the outside PWC modules. In the analysis reported here, momentum measurements for charged tracks employed all applicable tracking devices: the SSDs, the dipole magnet, the PWCs, and the straw tubes, yielding a momentum resolution of = 0.02% . In addition, the muon track candidates were constrained to come from the primary vertex. (The straw tube data were not used in the results reported in Ref. [6].)
Interactions were detected by pairs of scintillation counters located upstream and downstream of the dipole magnet. An interaction was defined by signals from at least two of these four counters in coincidence with a valid beam particle. The interaction rate was generally less than 1 MHz.
A liquid-argon calorimeter (LAC) was located downstream of the magnetic spectrometer. The LAC contained both electromagnetic and hadronic sections. The outer radius of the electromagnetic section was 165 cm; the inner radius was 20 cm. A helium-gas-filled beam pipe was inserted along the axis of the LAC to minimize interactions of beam particles. The total LAC material corresponded to more than 10 absorption lengths.
An iron and scintillator forward calorimeter was located downstream of the LAC to detect particles passing through the beam pipe. The forward calorimeter had an outer diameter of 1 m with a 3 cm diameter axial beam hole, and represented 10 absorption lengths of material.
The muon detector was located 20 m downstream of the target and extended for 16 m. The detector contained, in sequence, two muon PWC stations (A, B) with four planes each (X, Y, U, and V), a beam dump consisting of tungsten and steel imbedded in concrete, an iron toroid magnet producing an average impulse of 1.3 GeV/, and four more PWCs, (), each with three planes (X, U, and V). In these PWCs, the U and V coordinates were at angles of above and below the horizontal, respectively. Iron, lead, and concrete shielding was interspersed between chambers through . Two muon hodoscope planes, H1 and H2 (each with sixteen petal-shaped scintillation counters), were also located in this region. The outer radius of the muon chambers and muon hodoscopes was 135 cm. The acceptance of the muon spectrometer was limited by tapered axial holes, ranging from 13 cm to 20 cm in radius, through the toroid magnet, the muon chambers, and the muon hodoscopes. The hole in the toroid was filled with lead absorber.
The muon detector elements H1, H2, and through were shielded from hadrons by the material in the LAC, the forward calorimeter, the beam dump, the toroid, and the concrete shielding. Muons produced at the target with energies larger than 15 GeV penetrated this material, and all particles reaching the muon hodoscopes were assumed to be muons. Two or more hits in each of the muon hodoscopes were required as part of the dimuon pretrigger; the average hit multiplicity in dimuon triggered events was 2.3 per hodoscope plane. In addition to the muon hodoscope requirement, the upstream veto wall requirements completed the pretrigger conditions. The pretrigger rate was 1.2 and 2 per live interaction, for 530 GeV/ and 800 GeV/ incident protons, respectively. No radial dependence of the pretrigger counter efficiencies was observed.
Events satisfying the dimuon pretrigger were evaluated by the dimuon trigger processor (DMTP), which reconstructed space points in PWCs and , formed muon tracks (requiring an additional hit in either or along the projected track trajectory), measured muon momenta from the estimated bend in the toroid (assuming that the tracks originated in the target), and calculated the dimuon invariant mass. Trajectories of muon tracks reconstructed in the downstream muon PWCs were projected to the center of the target. The processor accepted only muon tracks with at least three hits within roads around the projected trajectory in both the A and B chambers. A dimuon trigger resulted if any of the calculated dimuon masses was above a preset threshold. A mass threshold of 1.0 GeV/ resulted in a trigger rate of to per live interaction. The average DMTP processing time was 10 s per pretrigger, which included 5 s to decode the muon chamber data. The mass resolution of the DMTP was 550 MeV/.
The toroid polarity was reversed several times during the run. In addition, part of the data was recorded without the A and B hit requirement in the trigger.
III Data
Table I lists the numbers of dimuon triggers and approximate integrated luminosities per nucleon on recorded during the 1991 fixed-target run for the different incident beams employed. For each dimuon-triggered event, the reconstructed muon tracks were linked through the entire detector. Only events with at least two fully-linked muons were processed further. The remaining track segments in the SSDs and upstream PWCs were used in the reconstruction of other tracks and event vertices. The distribution of the reconstructed primary vertices along the nominal beam direction , for events containing reconstructed dimuons in the mass range 2.8 GeV/ to 3.4 GeV/, is shown in Fig. 2.
Dimuons contributing to this analysis came from events with primary vertices in the beryllium targets, and had dimuon Feynman- ( = 2/) in the range 0.00.6 (0.0 0.8 for data). Data from other targets are used to investigate nuclear effects. Figure 3 shows the reconstructed opposite-sign dimuon invariant mass distributions in the mass region for the various data samples. The full width at half maximum (FWHM) for the signals varied from 120 to 135 MeV/. Fits were performed on the dimuon mass spectra in the mass range 1.5 to 5.0 GeV/. These fits employed the sum of two exponentials for the continuum background, and resolution functions for the and resonances determined via Monte Carlo simulations. The masses resulting from the fits are within 1 MeV/ of the Particle Data Group (PDG) value [13]. The mass was fixed at the PDG value. The numbers of s and s obtained from these fits are listed in Table I. The systematic uncertainties in the number of and combinations take into account variations in the shapes assumed for the signal and background distributions.
To evaluate reconstruction efficiencies and acceptances, Monte Carlo events containing s were generated. The and distributions of the generated Monte Carlo s were based on our previous measurements [6, 14]. We assumed that the s decay isotropically (consistent with observations to be described in the next section). These Monte Carlo events also contained additional charged tracks with an average multiplicity consistent with the data. The dimuons and associated particles were propagated through a GEANT simulation of the Meson West spectrometer, which incorporated measured spectrometer chamber efficiencies and instrumental noise determined from our data. The dimuon events were then reconstructed using the same tracking programs used for reconstruction of the data. We have evaluated the reconstruction efficiency and geometrical acceptance as a function of three variables: (i) , the Feynman-; (ii) , the square of the transverse momentum; and (iii) , the cosine of the Gottfried-Jackson decay angle between the and the beam axis in the rest frame. The products of acceptance and reconstruction efficiency, , were evaluated as one-dimensional distributions averaged over the other variable using an iterative technique (see Fig. 4). For a given iteration, the input Monte Carlo and distributions were weighted to match those of the data corrected by the acceptance and the reconstruction efficiencies determined in the previous iteration. The iterations were halted once stability was achieved. In preparing Ref. [6] we demonstrated that this method of evaluating acceptance and efficiency yielded cross section results consistent with a more sophisticated method based on a two-dimensional acceptance surface over the and plane. The resulting and acceptances and efficiencies are almost independent of the toroid polarity. But the product of acceptance and efficiency as a function of , integrated over the and spectra, shown in Fig. 4, exhibits a significant dependence on the toroid polarity. This is a result of the difference in acceptance as muons are either “bent in” or “bent out” by the toroid magnet in the muon detector.
IV differential distributions
candidates consisted of opposite sign dimuons with invariant mass between 2.8 GeV/ and 3.4 GeV/ originating from the primary vertex. Fits to the dimuon mass spectra outside the resonance band, similar to the ones described in Section III and shown in Fig. 3, for different regions of , , and indicate significant variations in the background contribution as a function of kinematic variables (for the 800 GeV/ proton data). Therefore, in contrast to our previous analysis [6], we have not carried out a two-constraint kinematic fit for each candidate to improve the muon momentum resolution. Instead, we performed a bin-by-bin background subtraction to measure the differential distributions. The distributions were measured separately for the positive and negative toroid polarities, and averaged as independent measurements. The effects of experimental resolution were taken into account in the acceptance corrections.
The distributions for the incident proton data at 530 GeV/ include corrections for the 2.8% incident contamination [12]. However, the Cerenkov counter information was not available for the entire data set. In addition, the Cerenkov tag for protons that results in 99.6% protons among the selected tagged particles also results in 25% reduction in the available luminosity. Therefore, rather than use the beam Cerenkov counter information on an event-by-event basis, we applied iterative statistical corrections to individual bins. The corrections were based on the measured integrated cross sections per nucleon times branching ratio for 0 of 9.2 2.0 nb [14] and 12.9 1.6 nb [6] for incident protons and pions, respectively. The shape of the distribution for incident pions was taken from Ref. [6]. The size of the correction varied from 1% at =0.0 to 22% at = 0.55. For a given bin, the systematic uncertainties due to this correction are much smaller than the corresponding statistical uncertainties. The effects of beam contamination are negligible for the , and distributions, which are similar for incident pions and protons.
The differential distributions are shown in Figs. 5 through 7, and tabulated in Tables II and III. Data points were corrected for the geometrical acceptances and reconstruction efficiencies discussed in the previous section. The quoted uncertainties represent statistical and systematic uncertainties added in quadrature. The systematic uncertainties include contributions due to uncertainties in the background estimates, as well as pion contamination for the 530 GeV/ incident proton data sample. Additional systematic uncertainties, due to the trigger and off-line reconstruction acceptance and efficiency calculations, were estimated from the variation of our results for data subsamples taken under different running conditions. These contributions are included only in the systematic uncertainties of the parameters of empirical fits employed to describe the data. Results of these empirical fits are summarized in Tables IV through VI.
We used the parameterization:
| (1) |
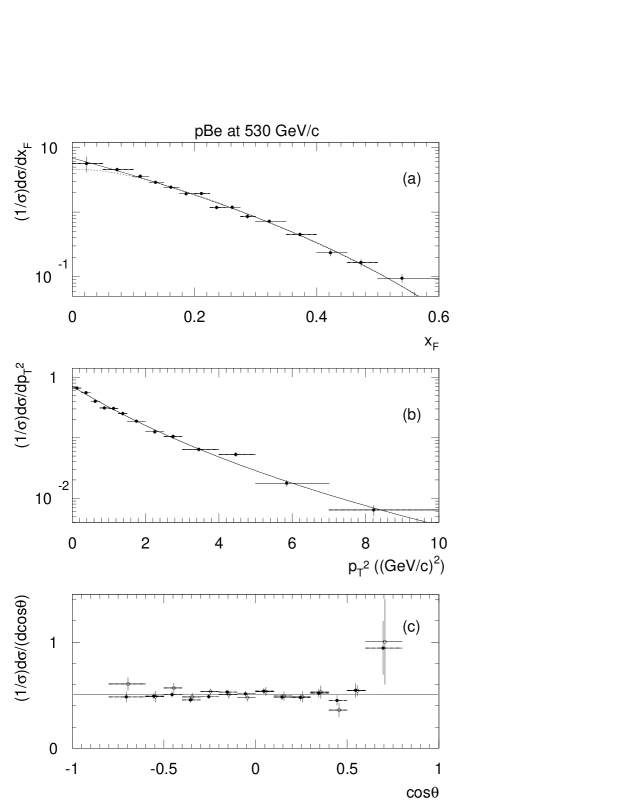
to describe the distribution for the proton-induced collisions [see Figs. 5(a) and 6(a)]. The fit value of parameter increases from = 5.89 0.14 () 0.11 () at 530 GeV/ to = 6.18 0.12 () 0.11 () at 800 GeV/. Our results are consistent with the general trend of increasing as the center-of-mass energy increases (see Fig. 8). However, the values of parameter for the incident beam momentum of 800 GeV/, quoted by other experiments, are 6.380.24 for a silicon target [10] and 4.910.18 for a gold target [9]. (The silicon target data is restricted to the range -0.050.25, while the gold target data is restricted to -0.0350.135). In Fig. 9(a), we directly compare the distributions from the three experiments, normalized to the integral over the 00.135 range. Our results agree very well with those of Ref. [10], whereas the data of Ref. [9] exhibit a harder dependence. Quantatively, when a fit of the distribution for our 800 GeV/ data is restricted to the 00.15 range, that fit yields = 5.94 0.43 with a per degree of freedom, = 6.6/7. Previous studies of the nuclear dependence of production have exhibited little nuclear dependence at small [15]. Comparisons of distributions from our data using and targets, presented in Fig. 10, do not show any significant dependence on the target nucleus. A difference of one unit in the value of the parameter implies a relative yield change between = 0.0 and = 0.25 by a factor of 0.75. The data show that the ratios of the normalized distributions for different nuclear targets are consistent with unity (within 25%) over the entire measured range. Our observation of weak dependence for nuclear effects (within our large statistical uncertainties) is consistent with results for and collisions (0.3) reported in Ref. [8]. The distributions from Ref. [8] are compared to our measurements in Fig. 9(b). Reasonable agreement is exhibited in the overlapping region. We suspect that the discrepancy observed in the small region (discussed above) is due either to a large statistical fluctuation or neglected experimental effects in some of the data sets.
We have also used the parameterization proposed in Ref. [16] to describe :
| (2) |
where
| (3) |
and = . Here, represents the beam parton fractional momentum and the target parton fractional momentum. The values for the parameter obtained from the fit are 4.95 0.17 () 0.12 () at 530 GeV/ and 4.95 0.16 () 0.12 () at 800 GeV/. The corresponding are 24/13 and 30/13. A similar fit to the induced data at 515 GeV/ [6], with the factor replaced by , gave =1.69 0.04 with = 50/33. According to Ref. [16], if gluon fusion is the dominant mechanism responsible for production via incident protons, then the expected values of the parameter are 5 for s produced predominantly through states decays, and 6 for direct production. For incident pions, the gluon fusion mechanism results in values of 3 and 4 for the indirect and direct production, respectively. The annihilation mechanism results in values of smaller by one unit. Our data indicate a larger difference between production by incident protons and pions than predicted by simple counting rules.
Gupta and Sridhar [3] made a detailed comparison of the color-octet model predictions with measured distributions from several fixed-target experiments, including our previous measurements described in Refs. [6, 14]. All values of the required non-perturbative matrix elements were derived from other experiments, primarily from charmonium photoproduction data and from production data from the Tevatron. In general, the parameter-free predictions of the model for -distributions agree with the proton and pion induced data both in magnitude and shape. However, uncertainties in the model predictions due to scale uncertainties, the various parton density sets, and non-perturbative matrix elements are still larger than the experimental uncertainties.
The spectra (Figs. 5b and 6b) were fit using the empirical form [17]
| (4) |
with parameters = [2.66 0.04 () 0.03 ()] GeV/ and [2.81 0.03 () 0.03 ()] GeV/ for the 530 GeV/ and 800 GeV/ data, respectively. The corresponding, -integrated average transverse momenta, , are: [1.15 0.02 ()] GeV/ and [1.22 0.01 ()] GeV/. As shown in Fig. 11, the value of grows slowly with center-of-mass energy. The comparison of distributions for the and targets, presented in Fig. 12, does not show any significant dependence on the target nucleus.
Fits to the distribution in the range 0.8 [Figs. 5(c) and 6(c)] using the functional form
| (5) |
yield = 0.01 0.12 () 0.09 () and = -0.11 0.12 () 0.09 () at 530 GeV/ and 800 GeV/, respectively. Figures 5(c) and 6(c) show the data for each toroid magnet polarity separately, and the results are similar. As illustrated in Fig. 4, the acceptance and efficiency as a function of are sensitive to the toroid polarity. Nevertheless, all data sets are consistent with unpolarized production. The E771 Collaboration reported = -0.090.12 [10] in interactions at 800 GeV/. Our measurement of for production from the high-statistic incident data sample gave = -0.010.08 [6]. These results confirm some of the earlier observations which reported small values of [18], and are consistent with expectations from the color evaporation model [5]. These results for are in disagreement with expectations from the color octet model [3], which predicts a sizeable transverse polarization, with mild energy dependence (e.g. 0.31 at = 15.3 GeV).
The differential distributions for production via incident 515 GeV/ beams are shown in Fig. 7. The new, lower statistics results, obtained during the same run as the proton data, are in a good agreement with our published high-statistics results [6]. The only substantial differences between the differential distributions from the pion and proton induced data samples are in the distributions. These differences are attributed to the harder distribution of gluons within the incident pion as compared to an incident proton.
V Summary
We have studied the production of mesons in the Feynman- range 0.00.6 in 530 GeV/ and 800 GeV/ collisions. We have parametrized the differential distributions and measured their dependence on center-of-mass energy. The distributions of production become more central as increases. For incident 800 GeV/ protons, the distribution observed in our data ( target) is similar to the distribution reported by E771 ( target)[10], and differs from the distribution reported by E789 ( target)[9]. Based upon studies of data from and targets, we are inclined to believe that this difference is not likely to be explained by nuclear effects. The distribution for production in interactions is less central than the corresponding distribution for e interactions at a similar beam energy. The data are consistent with unpolarized production as anticipated in the color evaporation model, but are in disagreement with expectations from the color octet model.
We thank the staffs of all participating institutions, especially those of Fermilab and the Institute for High Energy Physics (IHEP) at Protvino. This work was supported by the U. S. Department of Energy, the National Science Foundation, and the Russian Ministries of Science and Atomic Energy.
Table I. Data sets and number of and combinations from interactions on the targets during the 1991 fixed-target run.
| Beam | Momentum | Integrated | Dimuon | ||
| Luminosity | triggers | ||||
| (GeV/) | (pb-1) | ||||
| 515 | 1.4 | 902 | 806 | 18 | |
| 530 | 6.4 | 2434 | 3607 | 100 | |
| 800 | 7.3 | 6400 | 6540 | 214 |
Table II. Differential distributions for production in 530 GeV/ interactions. The quoted uncertainties represent statistical and systematic uncertainties added in quadrature. The systematic uncertainties include contributions due to uncertainties in the background estimates and pion contamination.
| (GeV/c)2 | 1/(GeV/)2 | ||||
|---|---|---|---|---|---|
| – | – | – | |||
| – | – | – | |||
| – | – | – | |||
| – | – | – | |||
| – | – | – | |||
| – | – | – | |||
| – | – | – | |||
| – | – | – | |||
| – | – | – | |||
| – | – | – | |||
| – | – | – | |||
| – | – | – | |||
| – | – | – | |||
| – | – | ||||
| – |
Table III. Differential distributions for production in 800 GeV/ interactions. The quoted uncertainties represent statistical uncertainties and systematic uncertainties in the background estimates added in quadrature.
| (GeV/)2 | 1/(GeV/)2 | ||||
|---|---|---|---|---|---|
| – | – | – | |||
| – | – | – | |||
| – | – | – | |||
| – | – | – | |||
| – | – | – | |||
| – | – | – | |||
| – | – | – | |||
| – | – | – | |||
| – | – | – | |||
| – | – | – | |||
| – | – | – | |||
| – | – | – | |||
| – | – | – | |||
| – | – | – | |||
| – |
Table IV. Results of fits to the distributions for production.
| Beam | Momentum (GeV/) | ||||
|---|---|---|---|---|---|
| 515 [6] | |||||
| 530 | 4.950.17 0.12 | 24/13 | |||
| 800 | 4.950.160.12 | 30/13 |
Table V. Results of fits to the distributions for production.
| Beam | Momentum (GeV/) | (GeV/) | ||
|---|---|---|---|---|
| [6] | 515 | |||
| 530 | ||||
| 800 |
Table VI. Results of fits to the distributions for production.
| Beam | Momentum (GeV/) | ||
|---|---|---|---|
| [6] | 515 | ||
| 530 | |||
| 800 |
REFERENCES
- [1] F. Abe et al., Phys. Rev. Lett. 79, 572 (1997); S. Abachi et al., Phys. Lett. B370, 239 (1996).
- [2] E. Braaten and S. Fleming, Phys. Rev. Lett. 74, 3327 (1995); M. Cacciari et al., Phys. Lett. B356, 553 (1995); W. Tang and M. Vanttinen, Phys. Rev. D 53, 4851 (1996); P. Cho and A. K. Leibovich, Phys. Rev. D 53, 150 and 6203 (1996).
- [3] S. Gupta and K. Sridhar, Phys. Rev. D 54, 5545 (1996); 55, 2650 (1997); M. Beneke and I. Z. Rothstein, Phys. Rev. D 54, 2005 (1996); 54, 7082 (E) (1996).
- [4] R. Baier and R. Ruckl, Z. Phys. C 19, 251 (1983); M. Vanttinen et al., Phys. Rev. D 51, 3332 (1995).
- [5] J. F. Amundson et al., Phys. Lett. B390, 323 (1997);
- [6] A. Gribushin et al., Phys. Rev. D 53, 4723 (1996).
- [7] V. Koreshev et al., Phys. Rev. Lett. 77, 4294 (1996).
- [8] M. S. Kowitt et al., Phys. Rev. Lett. 72, 1318 (1994).
- [9] M. H. Schub et al., Phys. Rev. D 52, 1307 (1995); Phys. Rev. D 53, 570 (E) (1996).
- [10] T. Alexopoulos et al., Phys. Rev. D 55, 3927 (1997).
- [11] L. Apanasevich et al., Phys. Rev. D 56, 1391 (1997).
- [12] D. Striley, Ph.D. Thesis, University of Missouri-Columbia, 1996 (unpublished).
- [13] Particle Data Group, Eur. Phys. J. C 3, 1 (1998).
- [14] V. Abramov et al., “Properties of Production in and Collisions at 530 GeV/”, FERMILAB-Pub-91/62-E 1991 (unpublished). The cross sections quoted in this preprint must be increased by a factor 1.2 to account for a correction omitted in the luminosity calculations.
- [15] D. M. Alde et al., Phys. Rev. Lett. 66, 133 (1991); M. J. Leitch et al., Phys. Rev. D 52, 4251 (1995); M. J. Leitch, Proceedings of the Quark Matter ’99 Conf., May 1999 - in press.
- [16] V. G. Kartvelishvili and A. K. Likhoded, Sov. J. Nucl. Phys. 39, 298 (1984).
- [17] D. M. Kaplan et al., Phys. Rev. Lett. 40, 435 (1978).
- [18] C. Akerlof et al., Phys. Rev. D 48, 5057 (1993) and references therein.
- [19] J. Badier et al., Z. Phys. C 20, 101 (1983).
- [20] J. G. Branson et al., Phys. Rev. Lett. 38, 1331 (1977).
- [21] K. J. Anderson et al., Phys. Rev. Lett. 37, 799 (1976).
- [22] K. J. Anderson et al., Phys. Rev. Lett. 42, 944 (1979).
- [23] M. Binkley et al., Phys. Rev. Lett. 37, 574 (1976).
- [24] E. J. Siskind et al., Phys. Rev. D 21, 628 (1980).
- [25] E. Nagy et al., Phys. Lett. 60B, 96 (1975).
- [26] C. Kourkomelis et al., Phys. Lett. 91B, 481 (1980).
- [27] C. Antoniazzi et al., Phys. Rev. D 46, 4828 (1992).
- [28] C. Morel et al., Phys. Lett. B 252, 505 (1990).
FIGURE CAPTIONS.
-
Figure 1. Plan view of the Fermilab Meson West spectrometer as configured for the 1991 fixed-target run.
-
Figure 2. Primary vertex Z-coordinate distribution for events containing dimuons with reconstructed masses in the mass range. Unmarked spikes in the distribution upstream of the target and downstream of the target are due to interactions in the silicon-strip detectors.
-
Figure 3. The invariant mass distributions of pairs for: (a) 530 GeV/ incident protons, (b) 800 GeV/ incident protons, and (c) 515 GeV/ incident . The solid curve in each plot is a fit to the data; the dashed curve shows the background contribution.
-
Figure 4. Product of geometrical acceptance and reconstruction efficiency for detection of as a function of: (a,b) , (c,d) , and (e,f) for 530 GeV/ (left column) and 800 GeV/ (right column) incident protons. The solid and dashed curves represent the results for the positive and negative toroid polarity, respectively.
-
Figure 5. Differential distributions for production as functions of: (a) , (b) ((GeV/), and (c) for interactions at 530 GeV/. The distributions are shown separately for each toroid magnet polarity. The integrals of the distributions in (a) and (b) are normalized to unity. The integrals of the distributions within the -0.6 range are normalized to 0.6. The solid and dashed curves in (a) represent empirical fits to the data using Eqs. (4.1) and (4.2), respectively. The solid curves in (b) and (c) represent fits using the functions shown in Eqs. (4.4) and (4.5), respectively.
-
Figure 6. Differential distributions for production as functions of: (a) , (b) ((GeV/), and (c) for interactions at 800 GeV/. The distributions are shown separately for each toroid magnet polarity. The integrals of the distributions in (a) and (b) are normalized to unity. The integrals of the distributions within the -0.60.6 range are normalized to 0.6. The solid and dashed curves in (a) represent empirical fits to the data using Eqs. (4.1) and (4.2), respectively. The solid curves in (b) and (c) represent fits using the functions shown in Eqs. (4.4) and (4.5), respectively.
-
Figure 7. Differential distributions for production as functions of: (a) , (b) ((GeV/), and (c) for interactions at 515 GeV/. The integrals of the distributions in (a) and (b) are normalized to unity. The integral of the distribution within the -0.6 0.6 range is normalized to 0.6. The data of Ref. [6] are shown for comparison.
-
Figure 8. Center-of-mass energy dependence of the exponent in the parametrization of the distributions for production in nucleon-nucleus interactions. The distributions for Refs. [20,21,22] were converted into the d/d form from the quoted Lorentz invariant cross sections /d using the average value of the transverse momentum at a given center-of-mass energy.
-
Figure 9. Differential distribution for production in 800 GeV/ interactions as a function of compared with: (a) the E771 () [10] and E789 () [9] results (each data sample is normalized by an integral of the distribution over the range); (b) the E789 () and () [8] results (each data sample is normalized by an integral of the distribution over the range).
-
Figure 10. Ratios of differential distributions as functions of for production in: (a) and interactions, and (b) and interactions. The open and full circles represent the 530 GeV/ and 800 GeV/ data, respectively. The integrals of the input distributions are normalized to unity.
-
Figure 11. Center-of-mass energy dependence of the average transverse momentum for nucleon-nucleus interactions.
-
Figure 12. Ratios of differential distributions as functions of for production in: (a) and interactions, and (b) and interactions. The open and full circles represent the 530 GeV/ and 800 GeV/ data, respectively. The integrals of the input distributions are normalized to unity.