12 March, 2000
Inelastic diffraction data
and the effective omeron trajectory
Samim Erhan111samim.erhan@cern.ch and Peter Schlein222peter.schlein@cern.ch
University of California333Supported by U.S. National Science Foundation Grant PHY94–23142, Los Angeles, California 90095, USA.
A further analysis of inelastic diffraction data at the ISR and SPS-Collider confirms the relatively flat –independent omeron trajectory in the high– domain, GeV2, reported earlier by the UA8 Collaboration. At GeV2, is in agreement with the trajectories found in diffractive photoproduction of vector mesons at HERA. This suggests a universal fixed omeron trajectory at high–. We also show that a triple–Regge omeron–exchange parametrization fit to the data requires an –dependent (effective) omeron trajectory intercept, , which decreases with increasing , as expected from unitarization (multi–omeron–exchange) calculations. = 1.10 at the lowest ISR energy, 1.03 at the SPS–Collider and perhaps smaller at the Tevatron.
in press: Physics Letters B
1 Introduction
Single diffraction, or the inclusive inelastic production of beam-like particles with momenta within a few percent of the associated incident beam momentum, as in:
| (1) |
has been studied for more than 30 years. The chief characteristic of data from these processes is the existence of a pronounced enhancement at Feynman- of near unity, with the absence of other particles nearby in rapidity (“rapidity gap”). This is interpreted using Regge phenomenology[1–6] as evidence for the dominance of color-singlet omeron–exchange (see Fig. 1). The observed spectrum reflects the distribution of the exchanged omeron’s momentum fraction in the proton444We use the symbol for this variable in view of its simplicity and its increasing use in the literature., .
A relatively recent idea[7, 8, 9] underlying the phenomenology is that, although the omeron’s existence in the proton is due to non-perturbative QCD, once the omeron exists, perturbative QCD processes can occur in proton-omeron and -omeron interactions. Ref. [7] proposed the study of such hard processes in order to determine the omeron structure. First “hard diffraction” results were obtained by the UA8 collaboration[10] using React. 1, and by the H1[11] and ZEUS[12] collaborations using interactions. Hard diffraction results on React. 1 also exist from the CDF[13] and D0[14] collaborations at the Tevatron.
Factorization of omeron emission and interaction in the inclusive React. 1 is expressed by writing the single-diffractive differential cross section as a product of a “Flux Factor” of the omeron in the proton, , and a proton-omeron total cross section (see Sect. 2):
| (2) |
is the squared invariant mass of the system and, to good approximation, is given by: . is the omeron’s four–momentum transfer. There are many examples in the literature of the validity of factorization (see for example Refs. [10, 11, 12, 15, 16]), and our working assumption in the present paper is that Eq. 2 is a good approximation. There is, however, a long–standing unitarity problem with the omeron–exchange prediction for React. 1 which deserves re–examination.
The rising total cross sections observed at Serpukhov () and the ISR () in the early 1970s led to the conclusion[17, 18, 19] that the effective omeron Regge trajectory intercept at = 0, , was larger than unity555The fit result for the trajectory in Ref. [17] was 1.06 + 0.25; the latest refined fits[20, 21, 22] to the –dependences of all total cross sections yield . . Although this violates the Froissart-Martin unitarity bound[23, 24] for total cross sections, it presents no difficulty at present and forseeable collider energies. However, this is not the case for partial cross sections such as diffraction. This is easily seen by examining the dominant –dependent Regge factor in Eq. 2 at small– and small–:
| (3) |
Kinematically, has a minimum value in React. 1, , which decreases with increasing energy, such that the rise in at small becomes more and more pronounced. With = 0.10, this leads to a rapidly increasing predicted total single diffractive cross section, , with , shown as the solid curve in Fig. 2 [25]. Of course, the observed does not display this behavior, but rises much more modestly666For reasons explained below in Sect. 3.1, we tend to discount the smaller of the two values at = 546 GeV[26]. with .
This discrepency between the predictions and the observed should be understandable in the framework of Gribov’s Reggeon calculus[27] through multi–omeron–exchange effects (Regge cuts), described variously in the literature as screening, shadowing, absorption or damping [28, 29, 30, 31]. Eq. 2, traditionally used with the obtained from fitting to the –dependence of total cross section data, does not take these effects into account.
It is expected that multi–omeron–exchange effects increase with . This corresponds to a decreasing effective [29] which will suppress corresponding to the observed behavior. To the best of our knowledge, effective values have never been directly extracted from data on React. 1, although Schuler and Sjöstrand[32] have developed a model of hadronic diffractive cross sections in which they use as a reasonable approximation at the highest energies.
It was also suggested [33, 34, 35] that the observation in interactions at HERA, of an -dependent effective omeron intercept [36, 37, 38] could be the result of the decrease of screening with increasing .
In the present paper we use the measured values to determine the effective values as a function of energy. We then fit to the –dependence of () at the ISR and SPS–Collider to obtain more reliable values of as well as the slope, at = 0. These latter fits also provide confirming evidence of the relatively flat –independent trajectory in the higher– region, 1.0–2.0 GeV2, which was previously reported by the UA8 Collaboration[15]. The value of this trajectory at GeV2 is consistent with the trajectory obtained from photoproduction of vector mesons at HERA.
We note that a decreasing effective intercept has the effect of suppressing the event yield at small– and small–, as suggested by the data[25]. In Ref. [25], we introduced an ad hoc Damping Factor to account for the observed suppression of the total diffractive cross section. However, since it was observed that the damping effects extend to larger at the largest Tevatron energy, our fixed Damping Factor had limited applicability. In the present paper, we show that the –dependent effective intercept, as a manifestation of multi–omeron–exchange, offers a physics explanation for the effect and seems to be applicable up the the highest available energies.
Sect. 2 summarizes the analysis by the UA8 collaboration[15], in which they fit Eq. 2 to ISR and SPS data; they obtain parametrizations of and which embody features not previously known and specify the omeron trajectory at high–. Sect. 3 shows how the effective omeron intercept depends on interaction energy in React. 1 and how predictions at = 1800 GeV agree with the CDF collaboration’s results[26]. The analysis in Sect. 4 yields a new omeron trajectory which depends on only at low–. Finally, Sect. 5 contains our conclusions and a discussion of some consequences.
2 UA8 Triple–Regge fits and the omeron trajectory at high–
The UA8[15] collaboration analyzed data from their experiment at the CERN SPS–Collider ( = 630 GeV) in the –range, 0.90–2.00 GeV2, and from the CHLM experiment at the CERN ISR[39] ( = 23–62 GeV) in the –range, 0.15–2.35 GeV2.
Eq. 2 was fit to the data, using the dominant two terms in the Mueller–Regge expansion [1, 2, 4], and (see Fig. 1), for the differential cross section of React. 1. These correspond, respectively, to omeron exchange and the exchange of other non–leading, C=+ eggeon trajectories (e.g., ) in the proton–omeron interaction777In reality, the terms have the form with GeV2.),
| (4) |
Comparing with Eq. 2, the left–hand bracket is the omeron flux factor, , and the right–hand bracket (together with ) is the proton–omeron total cross section, . Because this expression for is identical to that used in the fits to real particle cross sections[20, 21] (where , and are found - the latter for exchange) and the value of found in the UA8 fits () is similar to the values found in the fits to real particle cross sections, we take as a working assumption that is like a real particle cross section (as is done in predicting hard diffractive cross sections[7]). Thus, and are fixed at the above values.
In Eq. 4, is the standard Donnachie–Landshoff[40] form–factor888 which is multiplied by a possible correction at high–, . Thus, the product, , carries the –dependence of and in the Mueller-Regge expansion and is assumed to be the same in both. Physically, this means that the omeron has the same flux factor in the proton, irrespective of whether the proton–omeron interaction proceeds via omeron–exchange or eggeon–exchange. The products, , and .
The omeron trajectory, in , was assumed to have the usual linear form with a quadratic term added to allow for a flattening of the trajectory at high–, as required by the data:
| (5) |
was fixed at 0.10 in the fits. Although we show in the next section that the effective intercept decreases with , the only low– data used in the UA8 fits was that from the lower ISR energies, where 0.10 is a good approximation. We return to this point in Sec. 4.
To avoid difficulties with differing experimental resolutions in the combined ISR–UA8 data sample, simultaneous fits of Eq. 4 were first made to data in the range and GeV2, assuming zero non–omeron–exchange background; then fits were made to the entire region, , including a background term of the form . All fits gave self–consistent results. The fit values[15, 25] of the four free parameters in Eq. 4 were:
| = | mb GeV-2 | ||
| = | GeV-4 | ||
| = | GeV-2 | ||
| = |
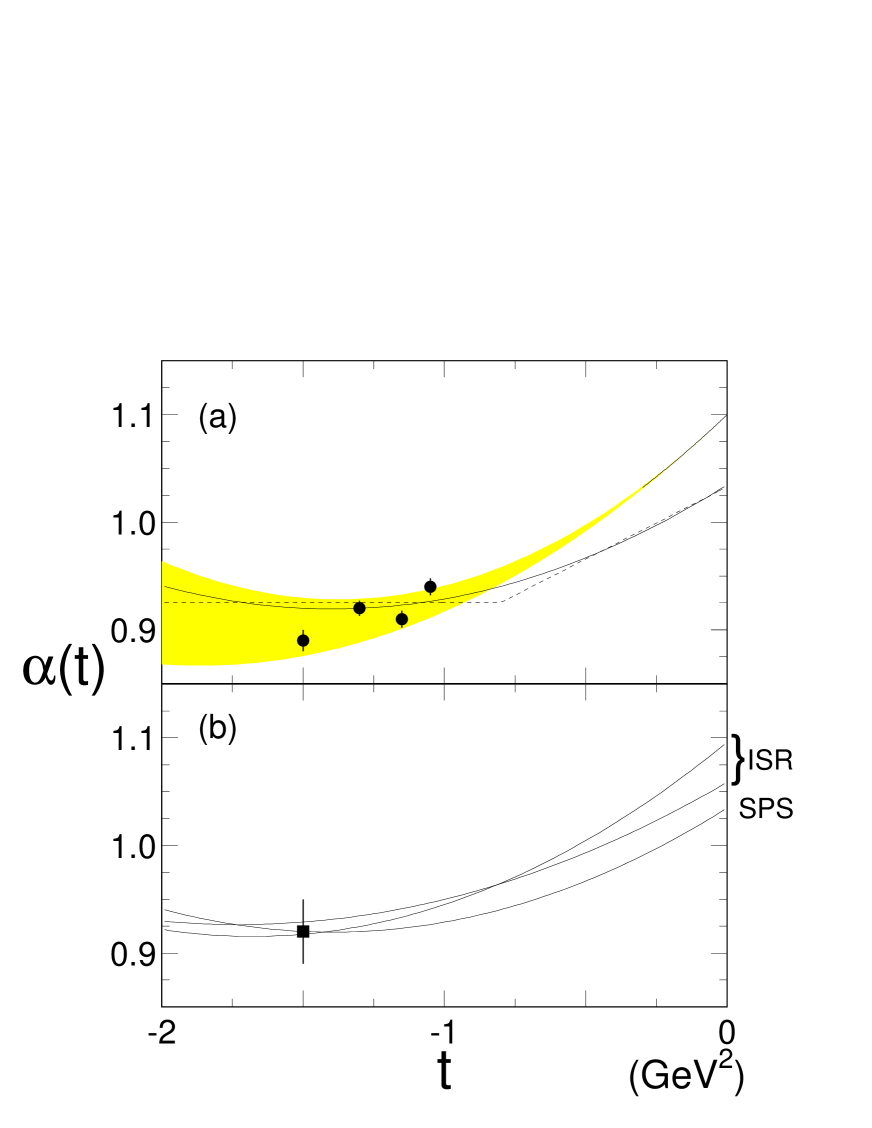
The fitted omeron trajectory, Eq. 5 with , is shown as the shaded band in Fig. 3. The band edges correspond to error limits on .
Independent confirmation of the values at high– seen in Fig. 3 was obtained by fitting (resolution–smeared) Eq. 4 to the –dependence of the UA8 data at fixed– in the different –region, , where non–omeron–exchange background could be ignored. Although, in Eq. 4, the dominant –dependence is in and has the form , there are the additional (weaker) dependences in the and terms of , both of which must be included in the fit. Because the () term is more sharply peaked at small values of than is the term, leaving it out of the fit999Note that this would mean assuming , which is in blatant disagreement with the value, , quoted above. causes a systematic upward shift in the resultant .
The solid points in Fig. 3 show the fit values[15] of at four -values, when both and terms in Eq. 4 are used in the fit (with ). The solid points and the band in the figure are in good agreement. The two different, but self–consistent, fits to the data in the high– region give confidence in the value of the overall normalization constant, , and in the –dependence, .
3 An -dependent effective intercept
As explained above, a prediction depends sensitively on the value of used in the Flux Factor. For each of the ISR, SPS and Tevatron6 points in Fig. 2, we have therefore found the value of the effective which yields the measured . Eq. 4 is integrated over and all , with the following assumptions:
-
•
We assume that screening only effects the Flux Factor, , and therefore only allow the which appears therein to change. As stated above, our working assumption is that the proton–omeron total cross section, with , is like a real–particle total cross section and hence has fixed parametrization.
-
•
, , and are fixed at the UA8 fit values given in Sect. 2. Although using these fixed values is not self-consistent with allowing to vary, any corrections are of order and do not obscure the essential results.
Fig. 4 shows the resulting values vs. ; their errors only reflect the measurement errors in the points. Starting with at the lowest end of the ISR region, the points display a pronounced downward trend with , reaching at the SPS–Collider and at the Tevatron. From the fits in Sect. 4, also decreases with decreasing (this is not surprising since the trajectory has to match up with its –independent part at higher ). Since = 0.15 is preferred at SPS and Tevatron energies, the dashed line in Fig. 4 is a fit to the solid points ( = 0.25) at the ISR and the open points at SPS-Tevatron ( = 0.15). The solid line shows vs. which results from the fits to the ISR data in Sect. 4. The difference between solid points and the solid line is that is not fixed at the arbitrary value of 0.25 GeV-2 in the latter.
3.1 Predictions for the Tevatron
Fig. 5 shows Eq. 4 ploted vs. at = 1800 GeV and small momentum transfer, GeV2, for several different values101010 is used for these curves; however, the results are almost identical for . of . The figure also shows the results of the CDF experiment[26], which they give in the form of a function which, after convoluting with their experimental resolution and geometric acceptance, was fit to their observed differential cross section111111For reasons explained in Sects. 5.2 and 5.3 of Ref. [15], we add the CDF “signal” and “background” as a good representation of their corrected differential cross section at small (after unfolding experimental resolution).. The CDF function (solid curve) in Fig. 5 is seen to agree in both absolute magnitude and shape to a prediction with . Similar results are found for the CDF function at = 546 GeV (not shown here).
We have integrated these same CDF functions for , to obtain at both 546 and 1800 GeV. At Gev2, both CDF values agree with UA4[41, 42]. However, the CDF -slope at 546 GeV is much steeper ( GeV-2) than are all other ISR, SPS and Tevatron (1800 GeV) measurements. Since its magnitude is sufficient to account for the difference between UA4 and CDF at 546 GeV, we have therefore ignored that CDF point in preparing Fig. 4.
4 The omeron trajectory
From the results in Sect. 3 at low–, we have an -dependent effective omeron intercept which reflects multi–omeron–exchange effects. However, as already mentioned, at high– ( GeV2) the trajectory[15] shows no signs of an –dependence[25], since the triple–Regge formalism describes the data between ISR and SPS with no apparent need of damping.
In order to parametrise the full omeron trajectory, we resort to a somewhat unorthodox procedure and fit the integral of Eq. 4 (with free parameters to describe the effective omeron trajectory), to the –dependence of the total differential cross section, (). This method relies on our knowledge of the remaining –dependence, in , which we believe is reliable since the results from our fits yield a omeron trajectory at high– which agrees with values obtained in the UA8 fits[15] to the shape of vs. at fixed values.
There is only one set of data above ISR energies which covers the complete range from 0–2 GeV2. Fig. 6 shows the measurements at the SPS-Collider by the UA4 collaboration[41, 42] (open points) and by the UA8 collaboration[15] (solid points). The UA4 data cover most of the –range because they come from independent high– and low– runs at the SPS. The UA8 data only cover the high– part of the range, but they are in good agreement with the UA4 points where they overlap121212We ignore the small () difference in between the two values, 546 and 630 GeV.. Although the poor resolution of the low– run precludes use of the data for fits to the –dependence, the distribution is hardly influenced.
The solid and dashed curves in Fig. 6 are fits (row 3 in Table 1) of the integrated version131313In the fits, , and are fixed at the UA8 values given above. of Eq. 4 to the data points in the figure. They correspond to the two different, but similar, parametrizations of shown in Fig. 3(a) (those with lower intercepts). One is the quadratic trajectory (solid), , with three free parameters (, GeV-2 and GeV-4, respectively). The dashed trajectory consists of two straight lines, and also has three free parameters, the intercept, slope and the value at which the trajectory continues horizontally to larger– values (, GeV-2 and GeV2, respectively). The two fitted trajectories are nearly identical. Remarkably, they are seen to agree with the two previous independent determinations[15] of in the high– region with .
Encouraged by this result, we turn to the corresponding ISR measurements[43, 44] of (see Fig. 7). The solid curves in Fig. 7 are the result of a single 6–parameter fit (/DF = 1.4) of the integrated version of Eq. 4 to all data points shown, using . The 6 parameters arise from assuming that , and each has an –dependence of the type, . At Gev2, the fit parameters, , and are, respectively, , GeV-2 and GeV-4. agrees perfectly with the value obtained from fitting to the –dependence of total cross sections141414This justifies its use in the fits of Ref. [15]. [20, 21] , while is smaller than the conventional 0.25.
The fit also yields the energy dependence parameter, “”, for each of , and : , and , respectively. This allows us to plot the fitted vs in Fig. 4 (solid line) over the ISR energy range. The curve is more reliable than the points obtained in Sect. 3 from values, because is not fixed at the arbitrary value, 0.25. The areas under the fitted curves in Figs. 6 and 7 are in good agreement with the published values.
The effective trajectories corresponding to the fits in Fig. 7 are plotted in Fig. 3(b) at the lowest ( GeV2) and highest ( GeV2) ISR energies. Also shown is the same SPS-Collider trajectory as in Fig. 3(a). At GeV2, all trajectory values agree to within about . We therefore refit the ISR data of Fig. 7, constraining all ISR trajectories to have the same value at GeV2. With /DF = 1.4, we find ( and do not change significantly). When the uncertainty in is taken into account, the error enlarges to , shown as the square point in Fig. 3(b).
5 Discussion
Using Refs. [15, 25] and the work in the present paper, we have seen that the triple–Regge formula with both and terms describes all available inclusive single–diffractive data from ISR to Tevatron, provided that the effective omeron Regge trajectory intercept, , is –dependent and decreases from a value, 1.10, at low energies to a value about 1.03 at the SPS-Collider and perhaps smaller at the Tevatron. The data also require[15] a “flattening” of the omeron trajectory[15] at , for momentum transfer, GeV2. Together, these two characteristics specify a new effective omeron trajectory in inelastic diffraction, which is in disagreement with the “traditional” soft omeron trajectory obtained from fits to the energy dependence of hadronic total cross sections. An -dependent effective intercept which decreases with increasing energy is expected from multi–omeron–exchange (screening/damping) calculations.
We find it remarkable that, despite the presence of multi–omeron–exchange contributions, Eq. 2 and the factorization of omeron emission and interaction seem to retain a high degree of validity. This suggests that multi–omeron–exchange effects behave in an approximately factorizable way[45].
It is also remarkable that single–omeron–exchange with a fixed trajectory describes inelastic diffraction so well in the higher– domain, when it is known that high– elastic scattering has multiple exchange contributions[40] there. It will be useful to elaborate the evidence for a dominant fixed omeron trajectory at high– in inelastic diffraction:
(a) First, we note that elastic and inelastic diffraction are very different. There is no evidence in inelastic diffraction (see Figs. 6 and 7) for the characteristic presence of the –dependent dip (and break) seen in elastic scattering and very differently in elastic scattering. Indeed, we have a self–consistent set of single–omeron–exchange fits to the data at the ISR (Fig. 7) and to the data at the SPS–Collider (Fig. 6)
(b) The (or ) distribution in React. 1 shows similar peaking at high– ( GeV2) as at low– (see Ref. [15]), which is a signature for the flattening of the omeron trajectory at high–. It is extremely interesting to note that the trajectory value we obtain, at = 1.5 GeV2, is consistent with the omeron trajectory obtained at high– in and photoproduction by the ZEUS collaboration[46] and in photoproduction by the H1 Collaboration[47]. This suggests a universal fixed omeron trajectory in the high– domain.
(c) The fits of Eq. 4 with its embedded Regge factor, , to the entire set of differential cross section data and their –dependences are highly overconstrained and yield good results. Thus, additional complications are not required by the data. It is particularly impressive that the three different and independent ways of determining (see Table 1) for GeV2 in Fig. 3 all give the same result. In one case, the fits[15] are to all data points at ISR and SPS-Collider with (including non–omeron–exchange background). Secondly, there are fits[15] to the shapes of vs. with at fixed–. And, in the present paper, we fit to all available with over the entire range of at both ISR and SPS-Collider.
(d) An additional argument in favor of one–omeron–exchange at high– is that, in Ref. [48], the extracted omeron–omeron total cross section, , agrees with factorization expectations above the few–GeV mass region.
(e) Finally, the UA8 results on hard scattering[10] at high– yield essentially the same picture of the omeron’s partonic structure as do the low– experiments at HERA and Tevatron.
On another point, we understand that, naively, screening effects are expected to increase with . This appears to contradict our observations. Indeed, the flattening of the omeron trajectory at high–, as well as the apparent absence of damping there[25] (damping effects are seen to “fade away” as increases from 0.5 to 1.0 GeV2) suggests that the trajectory is entering the perturbative domain. For example, this change in dynamics at high– from the simple eikonal approximation could arise from the dominance of “small–size configurations” in the recoil nucleon[49]. It is, in any case, an intriguing situation which should be given further attention.
One hopes that future calculations of multi–omeron–exchange effects will account for the effective intercept and slope at = 0 which we have presented, as well as preserve the high degree of factorization exhibited by the data. An additional factor which should be taken into account in multi–omeron–exchange calculations can be inferred from a recent result of the UA8 Collaboration on the analysis[48] of double–omeron–exchange data, where both final state observed and are in the momentum transfer range, GeV2. The extracted omeron–omeron total cross section agrees with factorization expectations in the invariant mass range, GeV. However, at smaller masses, there is a pronounced enhancement of the omeron–omeron cross section, peaking in the few–GeV mass region, with about a factor of ten larger cross section than expected from factorization. Although, with a mass resolution about GeV, it is impossible to observe structure in the omeron–omeron spectrum, this result implies that there is at least a strong interaction in the low–mass omeron–omeron system, which can have a significant, and perhaps simplifying, impact on the nature of multiple omeron exchange.
Acknowledgements
We have benefited greatly from discussions with Alexei Kaidalov, Uri Maor and Mark Strikman on issues of damping and screening. Helpful discussions with John Dainton are also appreciated. We also wish to thank the CERN laboratory, where much of this work was done, for their long hospitality.
| Results | Type of | Cross | SPS | ISR | ||
| in Fig. 3 | fit to data | section | low– | high– | low– | high– |
| used ? | ||||||
| Points | Fits to | NO | ||||
| at fixed- () | ||||||
| Shaded | Fits to | YES | ||||
| Band | () | |||||
| Curves | Fit to () | YES | ||||
| Curves | Fit to () | YES | ||||
References
- [1] A.H. Mueller, Phys. Rev. D 2 (1970) 2963; D 4 (1971) 150.
- [2] S.D. Ellis and A.I. Sanda, Phys. Rev. D 6 (1972) 1347.
-
[3]
A.B. Kaidalov et al., JETP Lett. 17 (1973) 440;
A. Capella, Phys. Rev. D 8 (1973) 2047;
-
[4]
R.D. Field and G.C. Fox, Nucl. Phys. B 80 (1974) 367;
D.P. Roy and R.G. Roberts, Nucl. Phys. B 77 (1974) 240;
- [5] see: P.D.B. Collins, “An Introduction to Regge Theory & High Energy Physics”, Cambridge University Press (1977), and references therein.
- [6] A.B. Kaidalov, Phys. Reports 50 (1979) 157.
- [7] G. Ingelman and P.E. Schlein, Phys. Lett. B 152 (1985) 256.
- [8] E.L. Berger, J.C. Collins, D.E. Soper and G. Sterman, Nucl. Phys. B 286 (1987) 704.
- [9] A. Donnachie & P.V. Landshoff, Phys. Lett. 191 (1987) 309; Nucl. Phys. B 303 (1988) 634; Phys. Lett. B 285 (1992) 172.
-
[10]
R. Bonino et al. (UA8 Collaboration), Phys. Lett. B 211 (1988) 239;
A. Brandt et al. (UA8 Collaboration), Phys. Lett. B 297 (1992) 417;
A. Brandt et al. (UA8 Collaboration), Phys. Lett. B 421 (1998) 395. -
[11]
T. Ahmed et al. (H1 Collaboration), Nucl. Phys. B 429 (1994) 477;
C. Adloff et al. (H1 Collaboration), Zeit. f. Phys. C 76 (1997) 613;
C. Adloff et al. (H1 Collaboration), Europhys. Journal C 6 (1999) 421. -
[12]
M. Derrick et al. (ZEUS Collaboration), Phys. Lett. B 315 (1993) 481;
J. Breitweg et al. (ZEUS Collaboration), Eur. Phys. J. C1 (1998) 81;
J. Breitweg et al. (ZEUS Collaboration), Eur. Phys. J. C6( 1999) 43. - [13] F. Abe et al. (CDF Collaboration), Phys. Rev. Lett. 78 (1997) 2698; 70 (1997) 2636.
- [14] B. Abbott et al. (D0 Collaboration), Fermilab PUB-99/375-E (hep-ex/9912061)
- [15] A. Brandt et al. (UA8 Collaboration), Nucl. Phys. B 514 (1998) 3.
- [16] R.L. Cool et al., Phys. Rev. Lett. 47 (1981) 701.
- [17] P.D.P. Collins, F.D. Gault and A. Martin, Phys. Lett. B 47 (1973) 171; Nucl. Phys. B 80 (1974) 135.
- [18] A. Capella and J. Kaplan, Phys. Lett. B 52 (1974) 448.
- [19] H. Cheng, J.K. Walker and T.T. Wu, Phys. Lett. B 44 (1973) 97.
- [20] J.R. Cudell, K. Kang and S.K. Kim, Phys. Lett. B395 (1997) 311; see also: Cudell et al., “High energy forward scattering and the omeron: simple pole vs. unitarized models”, hep-ph/9908218.
- [21] R.J.M. Covolan, J. Montanha & K. Goulianos, Phys. Lett. B389 (1996) 176.
- [22] A. Donnachie & P.V. Landshoff, Phys. Lett. B 296 (1992) 227.
- [23] M. Froissart, Phys. Rev 123 (1961) 1053.
- [24] A. Martin, Phys. Rev. 129 (1963) 1432.
- [25] Samim Erhan and Peter E. Schlein, Phys. Lett. B 427 (1998) 389; due to a publisher’s misprint of Figs. 4 and 7, they were reprinted correctly in: Phys. Lett. B 445 (1999) 455.
- [26] F. Abe et al. (CDF Collaboration), Phys. Rev. D 50 (1994) 5535.
- [27] V.N. Gribov, Sov. Phys. JETP 26 (1968) 414.
- [28] A. Capella, J. Kaplan and J. Tran Thanh Van, Nucl. Phys. B 105 (1976) 333.
- [29] A.B. Kaidalov. L.A. Ponomarev and K.A. Ter-Martirosyan, Sov. Journal of Nucl. Phys. 44 (1986) 468.
- [30] V.A. Abramovsky and R.G. Betman, Sov. J. Nucl. Phys. 49 (1989) 747.
- [31] E. Gotsman, E.M. Levin and U. Maor, Phys. Lett. B 309 (1993); Phys. Rev. D 49 (1994) 4321; the authors have informed us that, although single-channel screening (only elastic rescattering) yields insufficient suppression at the ISR, this is much improved when they also include diffractive rescattering in a multi-channel model.
- [32] G.A. Schuler and T. Sjöstrand, Phys. Rev. D 49 (1994) 2257.
- [33] A. Capella, A. Kaidalov, C. Merino and J. Tran Thanh Van, Phys. Lett B 337 (1994) 358; Phys. Lett B 343 (1995) 403.
- [34] M. Bertini, M. Giffon and E. Predazzi, Phys. Lett. B 349 (1995) 561.
- [35] E. Gotsman, E.M. Levin and U. Maor, Eur. Phys. J. C 5 (1998) 303.
- [36] S. Aid et al. (H1 Collaboration), Nucl. Phys. B 470 (1996) 3; “Precision measurement of the inclusive deep inelastic ep scattering cross section at low at HERA”, Abstract 534, ICHEP–98 (Vancouver, July 1998).
- [37] J. Breitweg et al. (Zeus Collaboration), Eur. Phys. Journal C 7 (1999) 609.
- [38] H. Abramowicz, E.M. Levin, A. Levy and U. Maor, Phys. Lett. B 269 (1991) 465; H. Abramowicz and A. Levy, “The ALLM parametrization of , an update”, DESY 97-251.
- [39] M.G. Albrow et al. (CHLM Collaboration), Nucl. Phys. B 54 (1973) 6; Nucl. Phys. B72 (1974) 376.
- [40] A. Donnachie & P.V. Landshoff, Nucl. Phys. B 231 (1984) 189; Nucl. Phys. B 267 (1986) 690.
- [41] M. Bozzo et al. (UA4 Collaboration), Phys. Lett. B 136 (1984) 217.
- [42] D. Bernard et al. (UA4 Collaboration), Phys. Lett. B 186 (1987) 227.
- [43] M.G. Albrow et al., Nucl. Phys. B 108 (1976) 1.
- [44] J.C.M. Armitage et al., Nucl. Phys. B 194 (1982) 365.
- [45] J. Pumplin and G.L. Kane, Phys. Rev. Lett. 32 (1974) 963.
- [46] J. Breitweg et al. (ZEUS Collaboration), “Measurement of Diffractive Photoproduction of Vector Mesons at Large Momentum Transfer at HERA”, DESY 99–160 and hep–ex/9910038.
- [47] C. Adloff et al. (H1 Collaboration), “Elastic Photoproduction of and Mesons at HERA”, DESY 00–037 and hep–ex/0003020, submited to Phys. Lett. B.
- [48] “The omeron–omeron Total Cross Section”: S. Erhan (UA8 Collaboration), Proceedings of 4th Workshop on Small– and Diffractive Physics (Fermilab, 17-20 September, 1998) 385; also, to be published (2000)
- [49] L. Frankfurt and M. Strikman, Phys. Rev. Letters 63 (1989) 1914; 64 (1990) 815. The authors have informed us that this is a candidate explanation for our observations.