UCSB HEP 99-09 Search for Mixing
Abstract
We report on a search for mixing made by a study of the ‘wrong-sign’ process . The data come from an integrated luminosity of collisions at GeV consisting of 9.0 fb-1, recorded with the CLEO-II.V detector. We measure the time-integrated rate of the ‘wrong-sign’ process , relative to that of the Cabibbo-favored process , to be . We study that rate as a function of the decay time of the , to distinguish the rate of direct doubly-Cabibbo-suppressed decay from mixing. The amplitudes that describe mixing, and , are consistent with zero. The one-dimensional limits, at the 95% C.L., that we determine are , and . All results are preliminary.
Studies of the evolution of a or into the respective anti-particle, a or , have guided the form and content of the Standard Model, and permitted useful estimates of the masses of the charm and top quark masses, prior to direct observation of those quarks. In this paper, we present the results of a search for the evolution of the into the , where the principal motivation is to glimpse new physics outside the Standard Model, prior to direct observation of that physics at the high energy frontier.
A can evolve into a through on-shell intermediate states, such as with , or through off-shell intermediate states, such those that might be present due to ‘new physics’. We denote the amplitude through the former (latter) states by (), in units of [1], and we neglect all types of CP violation.
For comparison, in the system the analogous and are both near unity [2, 3]. The prediction that an initial will decay with two lifetimes, as described by the non-zero , was famously made by Gell-Mann and Pais [4]. In the system theory firmly predicts that is negligible, and experiments have not yet sought out. For the system, is likely to receive significant contributions from the Standard Model [5]. It may even be that dominates the amplitude.
It has been , for both the and systems, that has provided information about the charm and top quark masses. A report of the first measurement in 1961 of for the system noted ‘We cannot compare our experimental value for with any theoretical calculation’ [6]. By 1974, theory had caught up, and exploited for the system to predict the charm quark mass [7], just before that quark was discovered. The tiny, CP violating for the is sensitive to the value of the top quark mass. The large value for the of (now [2]) indicated that the top quark is very massive [8], in distinction to contemporaneous data from the high energy frontier [9].
Many predictions for in the amplitude have been made [10]. The Standard Model contributions are suppressed down to at least because decay is Cabibbo-favored; the GIM [11] cancellation could suppress down to . Many non-Standard Models, particularly those that address patterns of quark flavor, predict or greater. Contributions to at this level can result from the presence of new particles with masses as high as 100 TeV [12]. Decisive signatures of such particles might include , or CP-violating interference between a substantial imaginary component of and either , or a direct decay amplitude. In order to accurately assess the origin of a mixing signal, the effects described by must be distinguished from those that are described by .
We report here on a study of the process . We use the charge of the ‘slow’ pion, , from the decay to deduce production of the , and then we seek the rare ‘wrong-sign’ final state (WS), in addition to the more frequent ‘right-sign’ final state, (RS). The wrong-sign process, , can proceed either through direct doubly-Cabibbo-suppressed decay (DCSD), or through mixing followed by the Cabibbo-favored decay (CFD), . Both processes contribute to the time integrated ‘wrong-sign’ rate, :
To disentangle the two processes that could contribute to , we study the distribution of wrong-sign final states as a function of the proper decay time, , of the . The proper decay time is in units of the mean lifetime, fs [2]. The differential ‘wrong-sign’ rate, relative to , is [13, 14]:
| (1) |
where the modified mixing amplitudes and in Eqn. 1 are given by:
and is a possible strong phase between DCSD and CFD amplitudes:
The symbol represents the DCSD rate, relative to the CFD rate. There are plausible theoretical arguments that is small [15, 16]. If both and exclusively populate the amplitude of , then would be zero. For the CFD, , the amplitude is indeed disfavored, with [17]. A non-zero could develop if populates the amplitude differently than the CFD does. Crudely, one might guess . The size of could be settled by measurements of the DCSD contributions to , , and , which are now feasible with our data set.
For decays to wrong-sign final states other than , such as , or , there will be distinct strong phases. Moreover, the broad resonances that mediate those multibody hadronic decays, such as the , , etc., modulate those phases as a function of position on the Dalitz plot. Thus, multibody hadronic wrong-sign decays might afford an opportunity to distinguish and from and .
An important aspect of the expression Eqn. 1 for the two-body decay is that the dependence on and is distinguishable due to the interference with the direct decay amplitude, which induces the term linear in . Such behavior is complementary to the differential decay rate to CP eigenstates such as , which is sensitive to alone, or that of , which is sensitive to alone.
Our data was accumulated between Jan. 1996 and Feb. 1999 from an integrated luminosity of collisions at GeV consisting of 9.0 fb-1, provided by the Cornell Electron Storage Rings (CESR). The data were taken with CLEO-II multipurpose detector [18], upgraded in 1995 when a silicon vertex detector (SVX) was installed [19] and the drift chamber gas was changed from argon-ethane to helium-propane. The upgraded configuration is named CLEO-II.V, where the ‘V’ is short for Vertex.
We reconstruct candidates for the decay sequences , followed by either (wrong-sign) or (right-sign). The sign of the slow charged pion tags the charm state at as either or . The broad features of the reconstruction are similar to those employed in the recent CLEO-II.V measurement of the meson lifetimes [20]. The following points are important in understanding how we have improved our sensitivity to , relative to earlier CLEO work [21, 22]:
-
1.
The SVX allows substantially more precise measurement of charged particle trajectories in the dimension parallel to the colliding beam axis. When combined with improvements in track-fitting, the CLEO-II.V resolution for , where is the mass of the system, is KeV, compared with the earlier value of KeV [21].
-
2.
The use of helium-propane, in addition to improvements in track-fitting, have reduced the CLEO-II.V resolution for to MeV, compared with the earlier value of MeV [21].
-
3.
Improved mass resolution, as well as rejections based on the momentum asymmetry of the two charged tracks, allow clean separation of the signal from , , and , and from multibody decays of the , at a cost of about 35% of the signal acceptance. We use the modest separation provided by measurement of in the CLEO-II.V drift chamber primarily for systematic studies. Addition of a new device with perfect identification and acceptance might enable the recovery of the 35% acceptance loss.
Multiple scattering on the field wires, which constitute 70% of the material, as measured in radiation lengths, in the CLEO-II.V drift chamber, appears to dominate the current and . Should the track-fitting be altered to treat scattering on the field wires as discrete and localized, both and might improve by as much as a factor of 2.
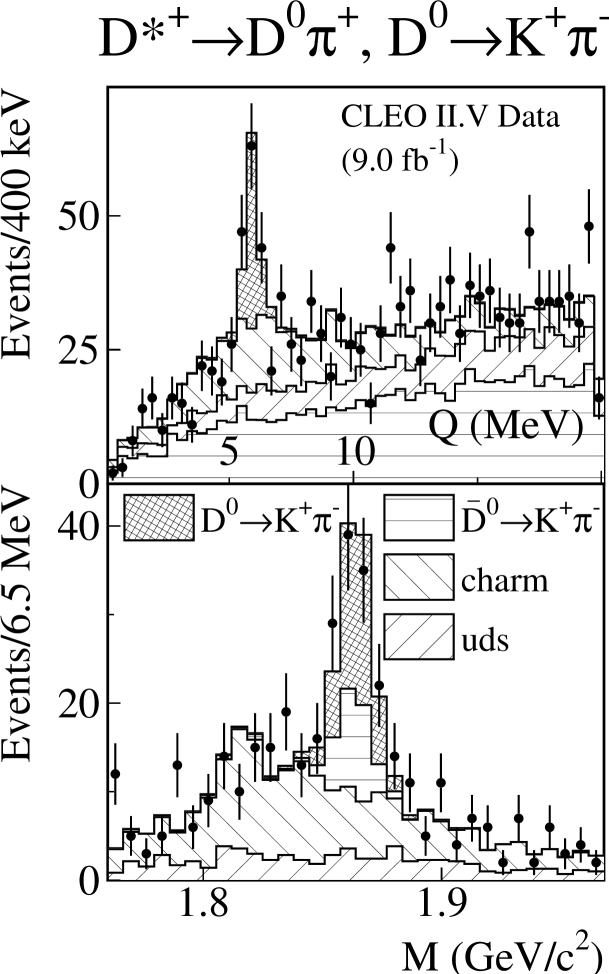
Our signal for the wrong-sign process is shown in Fig. 1. We determine the background levels by performing a fit to the plane of MeV versus GeV, which has an area about 150 times larger than our signal region. Event samples generated by the Monte-Carlo method and fully simulated in our detector, corresponding to fb-1 of integrated luminosity, are used to estimate the background shapes in the plane. The shapes are allowed to float in a fit to the data; the results of the fit are displayed in Fig 1. The excess of events in the signal region is prominent.
We describe the signal shape with the right-sign data that is within of the nominal CFD value in the plane. The results of the fit to the wrong-sign data are summarized in Table I.
No acceptance corrections are needed to compute from Table I. The dominant systematic errors all stem from the potentially inaccurate modeling of the initial and acceptance-corrected shapes of the background contributions in the - plane. We assess these systematic errors by substantial variation of the fit regions, criteria, and kinematic criteria; the total systematic error we assess is .
Our complete result for is summarized in Table II. As we describe later, our data are consistent with an absence of mixing, so our best estimate for the relative DCSD rate, , is that it equals .
There are two directly comparable measurements of : one is from CLEO-II [21], which used a data set independent of that used here; the second is from Aleph [23], ; comparison of our result and these are marginally consistent with for 2 DoF, for a C.L. of 5.0%.
We have split our sample into candidates for and . There is no evidence for a CP-violating time-integrated asymmetry. From Table I, it is straightforward to estimate the statistical error on the CP violating time-integrated asymmetry as .
TABLE I. Event yields in a signal region of centered on the nominal and values. The total number of candidates is 107. The bottom row describes the normalization sample.
| Component | # Events |
|---|---|
| (WS Signal) | |
| random | |
| Pseudoscalar-Vector | |
| (RS Normalization) |
TABLE II. Result for . For the branching ratio we take the absolute branching ratio . The third error results from the uncertainty in this absolute branching ratio. As discussed in the text, our best estimate is that .
| Quantity | Result |
|---|---|
Given the absence of a significant time-integrated CP asymmetry, we undertake a study of the decay time dependence wrong-sign rate based upon Eqn. 1. We reconstruct the proper decay time primarily from the vertical displacement of the vertex from the collision ‘ribbon,’ which is infinitesimal in its vertical extent. We require a well-reconstructed vertex in 3-dimensions, which causes a loss of about 12% of the candidates described in Table I. Our resolution, in units of the mean life, is about 1/2. Study of the plentiful right-sign sample allows us to fix our detailed resolution function, and shows that biases in the reconstruction of the proper decay time contribute negligibly to the wrong-sign results.
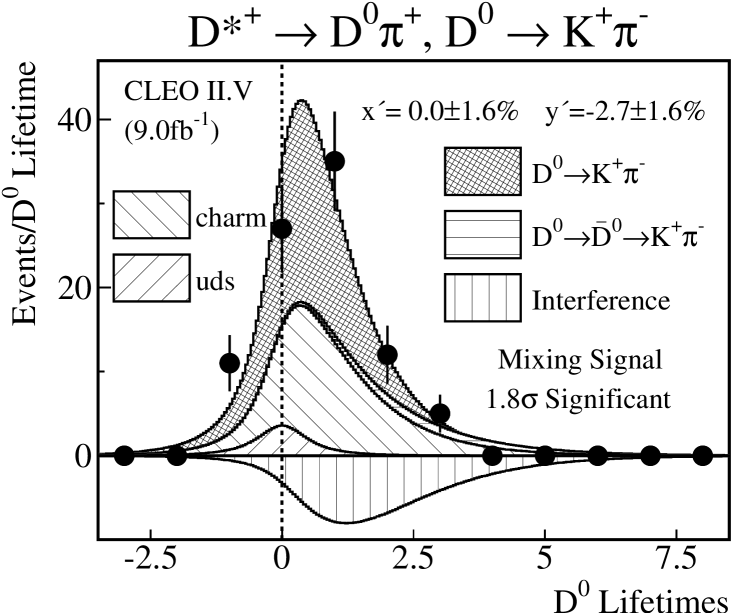
The distribution of proper decay times, , for wrong-sign candidates that are within of the nominal CFD value in the plane is shown in Fig. 2. Maximum-likelihood fits are made to those data. The backgrounds are described by levels and shapes deduced from the fit to the plane, and from study of the simulated data sample. The wrong-sign signal is described by Eqn. 1, folded with our resolution function.
For the benchmark fit to the wrong-sign data, and are constrained to be zero. This fit has a confidence level of , indicating a good fit.
The mixing amplitudes and are then allowed to freely vary, and the best fit values are shown in Fig. 2 and in Table III. The fit improves slightly when and are allowed to float to the values that maximize the likelihood. However, the small value of the likelihood change (including systematic errors) does not permit us to eliminate the possibility that the improvement is due to a statistical fluctuation.
Therefore, our principal results concerning mixing are the one-dimensional intervals, which correspond to a 95% confidence level, that are given in the second column of Table III.
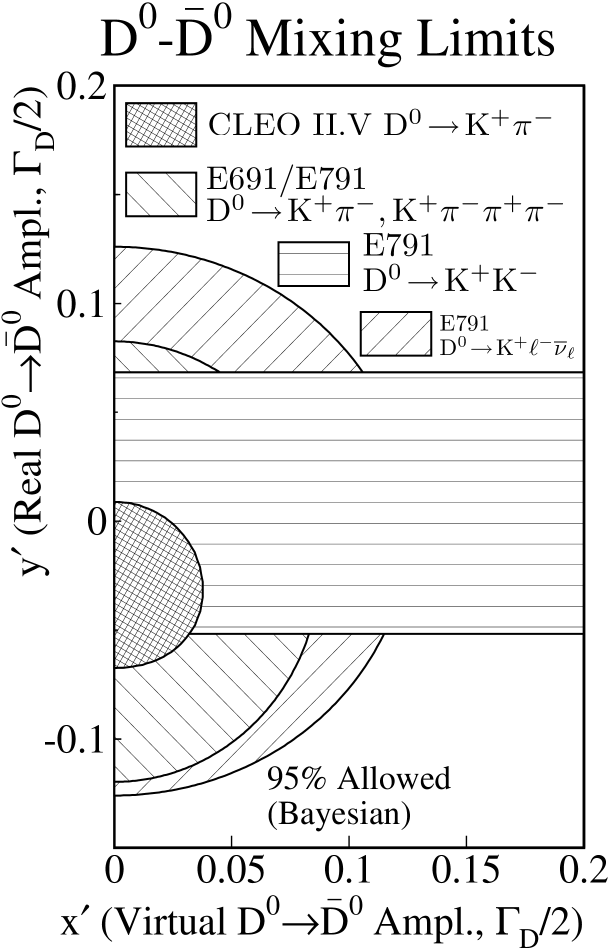
Additionally, we evaluate a contour in the two-dimensional plane of versus which, at 95% confidence level, contains the true value of and . To do so, we determine the contour around our best fit values where the has increased by 3.0 units. All other fit variables, including the DCSD rate and background contributions, are allowed to float to distinct, best fit values at each point on the contour. The interior of the contour is shown, as the small, dark, cross-hatched region near the origin of Fig. 3. On the axes of and , this contour falls slightly outside the one-dimensional intervals listed in Table III, as expected.
TABLE III. Results of the fit, where and are free to float, to the distribution of candidates in . The data and the fit components are shown in Fig. 2.
| Parameter | Best Fit | 95% C.L. |
|---|---|---|
We have evaluated the allowed regions of other experiments [24, 25, 26, 27] at 95% C.L., and shown those regions in Fig. 3.
All results described here are preliminary.
If we assume that is small, which is plausible [15, 16] then and we can indicate the impact of our work in limiting predictions of mixing from extensions to the Standard Model. Eighteen of the predictions recently tabulated [10] have some inconsistency with our limit. Among those predictions, some authors have made common assumptions, however.
Because our data is consistent with an absence of mixing, our best information on the DCSD rate, , is that it equals , as summarized in Table II.
We will soon complete studies where we allow various types of CP violation to modify Eqn. 1. Also, the decay modes , , , , , , and are under active investigation, using the CLEO-II.V data. The resonance bands in permit investigation of , with sensitivity heightened by coherent interference that is modulated by resonant phases.
The entire CLEO-II.V data set, suitably exploited, could be used to observe mixing if either or exceed approximately .
I gratefully acknowledge the efforts of the CLEO Collaboration, the CESR staff, and the staff members of CLEO institutions. This work is David Asner’s Ph.D. Dissertation topic, and he made the principal contributions to this study, and Tony Hill has made important contributions. Rolly Morrison and Mike Witherell provided intellectual guidance.
I thank the hosts of Kaon ‘99, particularly Y. Wah and B. Winstein, for running a hospitable and stimulating conference. I thank J. Rosner for help with this manuscript.
This work was supported by the Department of Energy under contract DE-AC03-76SF00098.
References
- [1] T.D. Lee, R. Oehme and C.N. Yang, Phys. Rev. 106, 340 (1957); A. Pais and S. B. Treiman, Phys. Rev. D 12, 2744 (1975).
- [2] C. Caso, et al. European Physical Journal C 3, 1 (1998).
- [3] Specifically, from the previous reference, for the system , and . In our convention is bounded by , and signed by the CP eigenvalue of the dominant real intermediate state(s), which is (to which we assign CP=+1) for . For there are real intermediate states that are not CP eigenstates, such as , but the convention is straightforward to generalize. Then, we define as proportional to the mass difference between the eigenstate that decays preferentially to CP= final states and the other eigenstate, that decays preferentially to CP= states. The study reported here is sensitive (when ) to the magnitude for the amplitude and to the magnitude, and sign, of for the amplitude.
- [4] M. Gell-Mann and A. Pais, Phys. Rev. 97, 1387 (1955).
- [5] E. Golowich and A. A. Petrov, Phys. Lett. B 427, 172 (1998).
- [6] R.H. Good et al., Phys. Rev. 124, 1223 (1961).
- [7] M. K. Gaillard, B. W. Lee, and J. Rosner, Rev. Mod. Phys. 47, 277 (1975).
- [8] J. L. Rosner, in proceedings of Hadron 87 (2nd Int. Conf. on Hadron Spectroscopy) Tsukuba, Japan, April 16-18, 1987, edited by Y. Oyanagi, K. Takamatsu, and T. Tsuru, KEK, 1987, p. 395.
- [9] G. Arnison et al., Phys. Lett. B 147, 493 (1984).
- [10] H. N. Nelson, hep-ex/9908021, submitted to the 1999 Lepton-Photon Symposium (unpublished).
- [11] S. L. Glashow, J. Illiopolous, and L. Maiani, Phys. Rev. D 2, 1285 (1970); R. L. Kingsley, S. B. Treiman, F. Wilczek, and A. Zee, Phys. Rev. D 11, 1919 (1975).
- [12] M. Leurer, Y. Nir, and N. Seiberg, Nucl. Phys. B 420, 468 (1994).
- [13] S. B. Treiman and R. G. Sachs, Phys. Rev. 103, 1545 (1956).
- [14] G. Blaylock, A. Seiden, and Y. Nir, Phys. Lett. B 355, 555 (1995).
- [15] L. Wolfenstein, Phys. Rev. Lett. 75, 2460 (1995).
- [16] T. E. Browder and S. Pakvasa, Phys. Lett. B 383, 475 (1996).
- [17] M. S. Witherell, in Proceedings of the International Symposium on Lepton Photon Interactions at High Energies, Ithaca, 1993, edited by P. S. Drell and D. L. Rubin, Amer. Inst. Physics, 1994, p. 198.
- [18] Y. Kubota, Nucl. Instrum. Meth. A 320, 66 (1992).
- [19] T. S. Hill, Nucl. Instrum. Meth. A 418, 32 (1998).
- [20] G. Bonvicini et al., Phys. Rev. Lett. 82, 4586 (1999).
- [21] D. Cinabro et al., Phys. Rev. Lett. 72, 1406 (1994).
- [22] More detailed descriptions of the study can be found in M. Artuso et al., hep-ex/9908040, submitted to the 1999 Lepton-Photon Symposium (unpublished).
- [23] R. Barate et al., Phys. Lett. B 436, 211 (1998).
- [24] E. M. Aitala et al., Phys. Rev. D 57, 13 (1998).
- [25] J. C. Anjos et al., Phys. Rev. Lett. 60, 1239 (1988).
- [26] E. M. Aitala et al., Phys. Rev. Lett. 77, 2384 (1996).
- [27] E. M. Aitala et al., Phys. Rev. Lett. 83, 32 (1999).