Study of QED processes with the SND detector at VEPP-2M
Abstract
Results of the SND experiment at the VEPP-2M collider on the QED processes and with production at large angles are presented. Energy and angular distributions of the final particles were studied. No deviations from QED with an accuracy of 3.8% for the first process and 10.3% for the second were found.
1 Introduction
Quantum electrodynamics (QED) describes electromagnetic interactions between electrons and photons with high accuracy. QED is usually tested in different types of experiments, for example:
-
•
high accuracy () experiments where high order QED corrections at small momentum transfer are tested, for example, anomalous magnetic moments of leptons, Lamb shift, etc.;
-
•
experiments with colliding beams where QED is tested at large momentum transfer, for example:
-
•
,
-
•
,
-
•
,
-
•
.
-
•
This work is devoted to the study of the following QED processes with large angles between all particles :
| (1) |
| (2) |
This study is important for several reasons. First, to check QED as the cross sections and differential distributions can be precisely calculated and compared with observed ones. Second, possible hypothetical leptons, for example heavy (or excited) electron gipel ( the existence of such particle is ruled out by recent LEP measurements: GeVPDG ), can manifest themselves in the invariant mass spectra of the final particles. Third, these processes could be a source of background for the vector meson decays with electrons and photons in the final state. For example, process (2) is the background in the study of decays of and , . And finally, it is necessary to take into account process (1) for the luminosity measurements with accuracy .
2 Detector, experiment
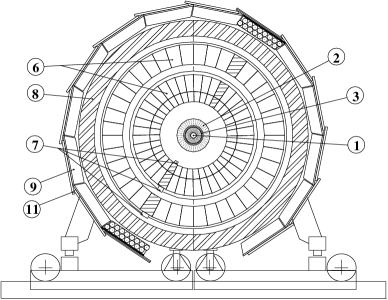
The experiment Prep.96 ; pr97 was carried out with the SND detector (Fig.1) at the VEPP-2M colliderVEPP2M in the energy region of the -meson resonance GeV. The SNDSND detector is a general purpose nonmagnetic detector with solid angle coverage of . It consists of a spherical 3 layer calorimeter based on NaI(Tl) crystals, two drift chambers and a muon system. The list of the SND main parameters is shown in Table2. The data were recorded in six successive scans at 14 different values of the beam energy with the integrated luminosity . The accuracy of the luminosity determinationpr97 is estimated to be 3%.

| Calorimeter: | |
|---|---|
| Total number of NaI(Tl) counters | 1632 |
| Angular size of the counter | |
| Readout | vacuum |
| phototriodes | |
| Noise per one counter | 0.3 MeV |
| Energy deposition from ’s | |
| ( MeV) | |
| Energy resolution for ’scalibr | |
| Angular resolution for ’s | |
| Minimal spatial angle for two photons | |
| separation | |
| Drift chambers : | |
| Spatial resolution for tracks | , |
| (P=300 MeV/c) | |
| Minimal azimuth angle for charged | |
| particles separation | |
| Amount of material before the chamber | 0.27 |
| Probability of -conversion before | 0.57% |
| the chamber |
3 Simulation
Monte Carlo simulation was used for comparison of the experimental results with theoretical predictions. Full simulation of the detector was made on the base of UNIMOD2 program UNIMOD2 . The process (1) was simulated according to formulae of the order from Ref.Baier . The details of the implementation of these formulae into event generator program are described in Ref.TDUM .
For the process (2) formulae of the order of differential cross section, calculated with the method of helicity amplitudes TDEEGG were used. These formulae are valid when all angles between final particles are large. So the simulation was performed under a condition that all angles are larger than .
The radiative correction for process (1) was calculated using formulae from Ref.Kuraev . The corrected cross section can be written as: , where is an Born cross section and - calculated radiative correction. The radiation of virtual and soft photons as well as hard photon emission close to the direction of motion of one of the initial or final charged particles were taken into account. These formulae were integrated over phase space as close as possible to the experimental acceptance. The decrease in the registration efficiency due to lost radiative photon was taken into account in calculations of contribution from hard photon radiation. As a result was obtained. The error originates from two main sources: the formula for differential cross section of virtual and soft photon radiation corrections is incomplete ( ), estimation of the efficiency dependence due to the loss of radiative photon ().
4 Data Analysis
At the first stage of data analysis the following selection criteria, common for both processes, were applied:
-
•
number of charged particles
-
•
number of photons
-
•
both tracks originate from the interaction region: distance between tracks and beam axis in plane cm, Z coordinate of the closest to the beam axis point on the track cm
-
•
polar angles of all particles
-
•
acollinearity angle of charged particles in the plane transverse to the beam axis
-
•
normalized total energy deposition
-
•
normalized total momentum
-
•
minimal energy of charged particle MeV
-
•
minimal energy of photon MeV
-
•
no hits in muon system
Nearly 90000 events passed these cuts for use in further analysis.
4.1 Process
For the selection of events from process (1) a kinematic fit imposing 4-momentum conservation was applied. The parameter , describing the degree of energy-momentum balance in the event, was calculated. For the selection of events from the process an additional cut was imposed:
-
•
The number of thus selected events in experiment and simulation of process (1) as well as for some background processes are shown in the Table 3.
| Number | Detection | Visible | |
|---|---|---|---|
| Process | of | efficiency | cross |
| events | (%) | section | |
| (Exp) | 73692 | 17.90.1 nb | |
| (MC) | 6081 | 59.81.0 | 19.7 0.3 nb |
| (MC) | 1 | 0.0033 | 0.0003 nb |
| (MC) | 556 | 0.19 | 0.02 nb |
| (MC) | 8 | 0.08 | 0.05 nb |
The corresponding energy, angular and invariant mass distributions after kinematic fit are shown in Fig.2,3. The statistical errors in these figures are comparable with the marker size. The peaks in Fig.2a,b,c originate from quasi-elastic events of process (1) with radiation of a soft photon with energy . There is good agreement between experimental data and MC simulation. There are no traces of heavy lepton in the invariant mass spectrum in Fig.3c. Some minor differences in the spectra (Fig.2d, 3a) could be attributed to imprecise simulation of angular differential nonlinearity for photons caused by granularity of the calorimeter.
The estimated detection efficiency for the described selection criteria is equal to (error is statistical). It was defined with respect to simulation under following the conditions: polar angle of final particles , azimuth acollinearity angle , spatial angle between final particles is minimal energies for charged particles and photons are equal to 10 and 20 MeV respectively. The systematic error on the measured cross section is determined by normalization uncertainty (3%), limited MC statistics (1.7%) and uncertainties in the selection efficiency (1.5%). In total it is equal to 3.8%.
The energy dependence of the cross section of process (1) is shown in Fig.4. The measurements were fitted using the following function:
| (3) |
where the first term has the energy dependence typical of QED processes and the second corresponds to a contribution from -meson decays with cross section . The fitting parameters are — the cross section at the energy MeV and determines resonance background contribution. The main part of this background for process 1 comes from decay.
Fitting gives no peak from -meson decays (fig.4). The fitted experimental cross section is nb and the expected QED cross section with radiative corrections is nb. The observed difference ( 1%) is within the systematic error.
4.2 Process
For the selection of events from the process , the following additional cuts were imposed:
-
•
number of photons ,
-
•
,
-
•
to suppress the contribution from region MeV was excluded,
-
•
minimal energy of photons MeV.
Here - is the kinematic fit parameter obtained under the assumption that events come from process (2). The number of events which passed these selection criteria in the experiment and Monte Carlo simulation of process (2) and background processes are shown in Table 4.
| Number | Detection | Visible | |
|---|---|---|---|
| Process | of | efficiency | cross |
| events | (%) | section(nb) | |
| (Exp.) | 698 | 0.153 0.013 | |
| (MC) | 647 | 33.6 1.5 | 0.151 0.006 |
| (MC) | 3 | 0.01 | 0.001 |
| (MC) | 16 | 0.006 | 0.0006 |
| (MC) | 1 | 0.001 | 0.001 |
Energy, angular and invariant mass distributions after kinematic fit are shown in Fig.5,6. Similar to process (1) the peaks are seen from quasi-elastic scattering with emission of soft photons (Fig.5a,b,c). The peak in photon energy spectra (Fig.5b) near corresponds to the recoil photon energy in radiative decays: , . Some enhancement in the two photon invariant mass spectrum (Fig.6b) near the -mass appears from the decay . There are also no visible traces of heavy lepton production in the spectrum (Fig.6d).
The detection efficiency was determined from simulation in nearly the same conditions as for process (1) : polar angle of final particles , azimuth acollinearity angle , spatial angle between final particles , minimal energies for charged particles and photons are equal to 10 and 50 MeV respectively, The value of detection efficiency was found to be 33.6 1.5%.
The fitting of the energy dependence of the cross section of process (2) was done using formula (3). The result is shown in Fig.7. The contribution from decays is seen as a peak at the mass. The significance of the peak is 1.5 of standard deviation. The processes and , mentioned above, constitute the main contribution to the peak.
The fitted value of experimental cross section nb was found in good agreement with the calculated QED cross section nb. The systematic error included into is determined by normalization uncertainty (3%), limited MC statistics (4.5%) and uncertainties on the selection efficiency (2.%). In total it is equal to 5.8%.
5 Conclusions
In the experiment with the SND detector at the VEPP-2M collider the and QED processes with particles produced at large angles were studied. A total of 73692 events of the process was observed. For the process 698 events were observed where 649 events are from the QED process (2). Number of events observed in different energy points for both processes are shown in tables 5,6. The cross sections and differential distributions of produced particles were compared with MC simulation. No significant deviations from QED were found within limits of measurement errors, which are equal to 3.8% and 10.3% for processes (1) and (2) respectively.
| (MeV) | N.events | Experimental |
|---|---|---|
| cr.section(nb) | ||
| 985.4 | 3827 | 19.26 |
| 1004.9 | 3545 | 18.71 |
| 1010.7 | 4616 | 18.27 |
| 1015.8 | 2150 | 18.06 |
| 1016.6 | 5811 | 18.54 |
| 1017.5 | 5506 | 18.27 |
| 1018.6 | 7492 | 18.03 |
| 1019.5 | 19049 | 17.71 |
| 1020.3 | 7395 | 17.93 |
| 1021.2 | 4550 | 17.31 |
| 1022.3 | 4138 | 18.24 |
| 1028.0 | 3436 | 17.13 |
| 1033.7 | 2792 | 17.67 |
| 1039.1 | 410 | 17.03 |
| (MeV) | N.events | Experimental |
|---|---|---|
| cr.section(pb) | ||
| 985.4 | 28 | 141. |
| 1004.9 | 40 | 210. |
| 1010.7 | 40 | 156. |
| 1015.8 | 17 | 144. |
| 1016.6 | 48 | 153. |
| 1017.5 | 42 | 139. |
| 1018.6 | 68 | 163. |
| 1019.5 | 156 | 145. |
| 1020.3 | 70 | 169. |
| 1021.2 | 48 | 182. |
| 1022.3 | 39 | 170. |
| 1028.0 | 32 | 159. |
| 1033.7 | 16 | 101. |
| 1039.1 | 5 | 208. |
Acknowledgements.
Acknowledgements. This work was supported in part by Russian Foundation of Basic Researches (grant No.96-15-96327); and STP “Integration” (Grant No 274).References
- (1) F.E.Low , Phys.Rev.Lett. 14, (1965) 238.
- (2) C.Caso et al., Eur. Phys. J. C3, (1998) p.775.
- (3) A.D.Bukin et al., Sov.J.Nucl.Phys. 35, (1982) p.844.
- (4) C.Bacci et al., Phys.Lett. B 71, (1977) 227.
- (5) H.-J.Behrend et al., Phys.Lett. B 158, (1985) 536.
- (6) B.Naroska et al., Phys.Rep. 148, (1987) 67.
- (7) S.I.Dolinsky et al., Phys. Rep. 202, (1991) 99.
- (8) M.N.Achasov et al., Preprint Budker INP 96-47, Novosibirsk, 1996.
- (9) M.N.Achasov et al., Preprint Budker INP 97-78, Novosibirsk, 1997; hep-ex/9710017, October, 1997.
- (10) M.N.Achasov et al., Nucl.Instrum.Meth. A411 (1998) 337.
- (11) G.M.Tumaikin, in Proceedings of the 10-th International Conference on High Energy Particle Accelerators, Protvino, v.1 (1977) p.443.
- (12) V.M.Aulchenko et al.,in Proceedings of the Workshop on Physics and Detectors for DANE, ( INFN, Frascati, Italy, 1991), p.605.
- (13) A.D.Bukin et al., Preprint BINP 90-93, 1992, Novosibirsk; in Proceedings of the Workshop on Detector and Event Simulation in High Energy Physics, (NIKNEF, Amsterdam, The Netherlands, 1991), p.79.
- (14) A.D.Bukin, Preprint BINP 85-124, 1985, Novosibirsk.
- (15) V.N.Baier et al., Phys. Rep. 78, (1981) 293.
- (16) A.B.Arbuzov, E.A.Kuraev, B.G.Shaikhatdenov, hep-ph/9805308, August 1998.
- (17) E.A.Kuraev, A.N.Peryshkin, Sov.J.Nucl.Phys. 42 (1985) 756.