Atmospheric Neutrino Physics with the MACRO detector
Abstract
We present the measurement of the the flux and angular distribution of atmospheric using the MACRO detector. Three different event topologies are detected in two different energy ranges. High energy neutrinos () via the identification of upward throughgoing muons. Lower energy neutrinos () via the upgoing stopping and partially contained downgoing muons (ID+UGS), or via the partially contained upgoing muons (IU). The measured flux is reduced with respect to the predictions. For the high energy sample, globally the flux reduction is ; the reduction varies with the zenith angle. The ratio of measured to expected events is almost constant with the zenith angle for the low energy events, and is for the IU sample, and for the (ID+UGS). All the data sets are consistent within a scenario of neutrino oscillations, with maximum mixing and .
1 INTRODUCTION
The interest on the atmospheric neutrinos has grown up in the last year, after the Neutrino ’98 Conference in Takayama, Japan. New, higher statistic data have been presented there by the Soudan 2 [1], MACRO [2], and SuperKamiokande (SK) [3] collaborations. The measured flux of muons induced by atmospheric shows a reduction with respect to the expectation, which depends on the neutrino energy and direction. For induced electrons there is no strong deviation from the prediction. The three experiments explain the reduction in terms of neutrino oscillations, with maximum mixing and few times , confirming the early results. In fact, in the simplest scenario of two flavor oscillations, the survival probability of a pure beam is:
| (1) |
is the mass difference of the two neutrino mass states, is the mixing angle, the neutrino energy and the path length from the production point to the detector. can be estimated through the neutrino arrival direction . For upgoing neutrinos, as the zenith angle changes, ( is the Earth radius), while is only few tens of kilometers for downgoing neutrinos.
Atmospheric neutrinos are detected in the SK water Cherenkov detector via their interaction with water nuclei. Three different classes of events are defined (with increasing average energy of the parent neutrino): fully contained events (FC), partially contained events (PC) and upward-going muons. Electron neutrinos are also identified in the FC sample. The ratio of muons to electrons normalized to the respective Monte Carlo predictions enhances the anomaly.
The Soudan 2 results support the oscillation hypothesis by measuring atmospheric and interactions in the (roughly) same energy region of SK. A different detection technique (drift chamber calorimeter) is used in this case.
Here we present the MACRO results on the measurement of the atmospheric neutrino flux in the energy region from a few GeV up to a few TeV. In this case, a completely different experimental technique is used. The flux of is inferred from the measurements of upward throughgoing muons produced via charged current interactions in a large rock volume below the detector. The muon can travel up to the apparatus, and if the residual energy is at least 1 GeV, it is detected as an upgoing muon. The average energy of the parent neutrino for these events is , one or two order of magnitude larger than that of FC and PC Superkamiokande events. The muon can be detected in MACRO as an upgoing stopping particle, if its residual energy is between . In this case, neutrino interaction happens few meters below the apparatus, and the average parent neutrino energy is of the order of few GeV. In addition to the stopping muons, MACRO measures the flux of lower energy () neutrinos through the detection of (mainly) interactions inside the apparatus.
2 MACRO AS DETECTOR

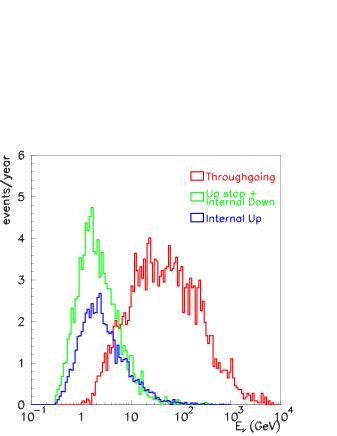
The MACRO detector is a large rectangular box (76.6 m 12 m 9.3 m) whose active detection elements are planes of limited streamer tubes for tracking and liquid scintillation counters for fast timing. It is located at the Gran Sasso Laboratory, with a minimum rock overburden of . The lower half of the detector is filled with trays of crushed rock absorber alternating with streamer tube planes, while the upper part is open. The angular resolution for muons achieved by the streamer tube system is better than . The time resolution of each liquid scintillation counter is about . Fig. 1 displays the different kinds of measured neutrino events. The up throughgoing muons come from interactions in the rock below the detector. The muon crosses the whole detector and the flight direction is determined by time-of-flight (t.o.f.) measurement. The flux of lower energy is studied by the detection of interactions inside the apparatus; the partially contained upgoing events (IU) are tagged with t.o.f.. The partially contained downgoing events (ID) and upward going stopping muons (UGS) are identified via topological constraints. Fig. 2 shows the distribution of the parent neutrino energy for the three event topologies detected by MACRO. The data presented here come mainly from the running period with the full MACRO detector (which started acquisition in April 1994), up to February 1999, corresponding to an effective live-time of .
3 UP THROUGHGOING MUONS
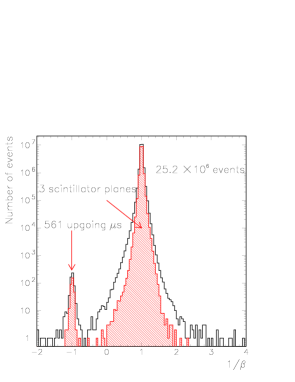
At the depth of the Gran Sasso Laboratory, we expect downgoing atmospheric muons for each neutrino-induced (for which we expect an up/down symmetry). For this reason, the identification of neutrino-induced ’s relies on the measurement of the direction that muons travel through MACRO. For each detected muon the experimental parameter is evaluated. is the time measured in the lower (higher) scintillation counter and the path length between the counters. The downgoing muons are expected in the 1/ region near +1, while upgoing muons at 1/ near -1. To remove accidental background events, the position along the scintillator counter must agree within 70 cm with the position indicated by the streamer tube track. Fig. 3 shows the distribution of for muons collected from April 1994. There are 561 upgoing muons in the range . We combine these data with additional 81 events collected before 1994, for a total of 642 upgoing events. In the total data set there are: estimated background events due to misidentification of downgoing muons; background events from upgoing charged particles produced by downgoing muons in the rock near MACRO [4]; internal events from interactions of neutrinos in the very bottom layer of MACRO scintillator. Removing the background and the internal events, the number of upward throughgoing muons is 607.
3.1 Monte Carlo expectation
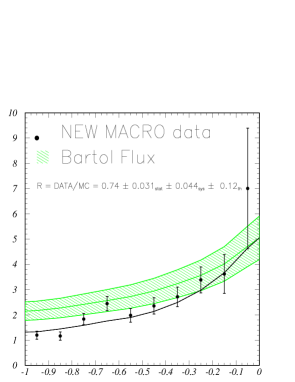
For the simulation, we have used the Bartol neutrino flux [5] and the DIS parton distribution set [6] for the neutrino cross-sections. The propagation of muons to the detector has been done using the energy loss calculation [7] for standard rock. The total uncertainty on the expected flux of muons adding in quadrature the errors from neutrino flux, cross-section and muon propagation is . This theoretical error in the prediction is mainly a scale factor that doesn’t change the shape of the angular distribution. The number of expected events is 824.6, giving a ratio of the observed number of events to the expectation of . Fig. 4 shows the zenith angle distribution of the measured flux of up throughgoing muons (all MACRO data), compared to Monte Carlo expectation.
3.2 Interpretation of the result
We interpreted the reduction on the detected number of events and the deformation of the zenith angle distribution as a consequence of disappearance. In the scenario described by eq. 1, relatively fewer events are expected near the vertical than near the horizontal , due to the longer path length of neutrinos from production to observation. The shape of the angular distribution has been tested with the hypothesis of no-oscillation. We found a , or a probability of 0.35%. To test the oscillation hypothesis, we evaluate the independent probability for obtaining the number of observed events and the angular distribution for various oscillation parameters. The maximum of the probability in the physical region of the oscillation parameters is 36.6%, corresponding to and maximum mixing. Fig. 5 shows the confidence regions at the 90% and 99% C.L. in the parameter space for oscillations, based on application of the Monte Carlo prescription of [8]. The effect of oscillations (using the best fit point values) is also shown in Fig. 4. The angular distribution of events vs. strongly disfavours the hypothesis of no-oscillations; however, there is a structure (near ) which is unexpected also in the case of oscillations. The excess of events in this bin is still consistent with a statistical fluctuation, but it could be a hint for a more complex scenario.

3.3 Checks on systematics
Possible systematic effects have been studied and have been shown to be too small to explain the observed anomalous shape in the zenith angle distribution. The detector acceptance is well understood (from a large sample of downgoing muons), in particular near the vertical direction where the largest deviation compared to the Monte Carlo expectation without oscillations is observed.
An important check has been performed using the system designed for the detection of bursts of neutrinos from stellar collapse. This system has a completely separated acquisition system and redout electronics. An analysis has been done using the TDC’s of such system and the events having three scintillation counters. With three counters is possible to achieve a good rejection of downgoing muons using only the information from this TDC system and without tracking. The angular distribution of the up throughgoing event sample identified in this way (presented in Fig. 6) confirms the main feature of Fig. 4. In the figure some events collected when the stellar collapse system was on and the main system off are included. During the period of common activity, only one event has escaped from the detection of the standard analysis, while we expect to miss 0.6 events due to dead time of the the streamer tube/liquid scintillation systems used by the standard analysis.

4 EVENTS FROM LOWER ENERGY
4.1 Partially contained upgoing (IU)
The detection methods for the IU are similar to that of throughgoing ’s (time-of-flight measurement, plus a track reconstructed in the streamer tubes system), and on topological criteria for the identification of a interaction vertex inside the apparatus. To reject fake semi-contained events entering from a detector crack, the extrapolation of the track in the lower part of the detector must cross and not fire at least three streamer tube planes and one scintillation counter. The above conditions, tuned on the Monte Carlo simulated events, account for detector inefficiencies and reduce the contribution from upward throughgoing muons which appear like semi-contained to less than . We evaluated that events are due to an uncorrelated background. After the background subtraction, events are classified as events.
4.2 Partially contained downgoing and up stopping events (ID)
The ID+UGS events cross only one liquid scintillator layer and are identified by means of topological criteria. The lack of timing information prevents to distinguish between the two sub samples. From MC (sec. 4.3.), an almost equal number of and events are expected. A software selection rejects throughgoing events, and searches for a contained track crossing the bottom layer of the scintillation counters. The selection conditions for the event vertex (or stop point) in the detector are symmetrical to those for the search. 879 events are accepted by the selection. Some of them are wrongly tracked or bending atmospheric muons which entered from a detector crack. To reject fake events, a visual scan was performed. Two physicists scanned twice the real data randomly merged with the simulated events. At the end of the scan procedure, 200 real events are accepted as ID or UGS, with 95% of the Monte Carlo simulated events. The main background source are upward going charged pions induced by interactions of atmospheric muons in the rock around the detector. background events have been evaluated using a full simulation which is based on our measurement [4].
4.3 Monte Carlo
Also the expected low energy event rates have been evaluated with a full Monte Carlo simulation. The interaction of atmospheric and [5] were simulated in a large volume (with total mass), including the experimental hall and the detector. Because of the lower energies, the cross sections from [9] are used, which include the contribution of the exclusive channels of quasi-elastic scattering and single- production. The total theoretical uncertainty on flux and cross section at these energies is . The detector response has been simulated using a GEANT based program, and events are processed in the same analysis chain as the real data. The parameters of the streamer tube and scintillator systems have been chosen to reproduce the real average efficiencies. A 10% systematic error is evaluated from the simulation of detector response, data taking conditions, analysis algorithm efficiency, mass and acceptance of the detector. As shown in Fig. 2, the energy spectra of parent neutrinos for the IU and ID+UGS events are similar, with equal average energy. 87% of IU and (ID+UGS) detected events are induced by -CC interactions. The remaining 13%, from -CC and NC interactions (with different percentage for the two data sets).
4.4 Results from the low energy events
Fig. 7 shows the zenith angle distribution of the and data samples, with the Monte Carlo predictions. The data are within errors consistent with a constant deficit in all bins with respect to the Monte Carlo expectations. The ratios of the number of observed to expected events are and .
If the event deficit is due to an overall theoretical overestimate of the neutrino flux and/or cross sections, it is expected . The theoretical and systematic errors are largely reduced (to 4% and 5%, respectively) if the ratio of ratios is considered. The partial uncertainty cancelation comes from the fact that the energy spectra of the two topologies are alike, and because of the symmetry in the detector acceptance. We measured ; the statistical error is the dominant one in this quantity. The probability to obtain a ratio so different from the expected one is 5% (taking into account the non-gaussian shape of the uncertainty), no matter which neutrino flux and neutrino cross sections are used for the predictions.
The alternative hypothesis for such a reduction is oscillations with maximum mixing and . In this interval the number of muons induced by the interaction of upgoing neutrinos (i.e. IU and UGS events, for which ) is reduced by a factor of two, while almost no reduction is expected for ID events (= few ). The expected (ID+UGS) event rate is 3/4 of the no-oscillations expectation (neglecting the contribution of and NC interactions). For larger , also the ID events are reduced, so both the (ID+UGS) and IU event rates are 1/2 of the no-oscillations expectation. For smaller , the bins of the zenith distributions (Fig. 7) are differently affected by the oscillations. As the low-energy events are not particularly sensitive to the interval as a test point in Fig. 7 we used the best fit values from the high energy sample.
Finally, the hypothesis simply explain the different reduction on the total number of events observed in the (ID+UGS) and IU data sets. In case of disappearance, for the (ID+UGS) the reduction with respect to the case of no-oscillations is 0.76, to be compared with the measured value of . For the IU events, it is 0.57, to be compared with
We estimated the most likely values on a grid using a comparison of data and Monte Carlo, based on the prescription of [8]. The data were binned in 4 zenith angle bins for the IU events, 4 zenith angles for the ID+UGS events, the ratio and the overall normalization. The maximum of the probability (97%) occurs at (inside the physical region); this value of the probability is almost constant in the interval . Fig. 5 shows the contour 90% confidence level for the low energy events; the allowed region is consistent with that obtained using the higher energy sample of neutrino-induced upward throughgoing muons.

5 CONCLUSIONS
MACRO measures three different data sample of events induced by atmospheric neutrinos. All the data sets show a deficit of the measured number of events with respect to the predictions based on the Bartol flux and the absence of neutrino oscillations.
For the upward throughgoing sample, apart from the reduction in number, the shape of the angular distribution is modified as expected in case of disappearance. There is however an unexpected structure near ), which is still consistent as a a statistical fluctuation in the scenario of neutrino oscillations.
For the low energy neutrinos, two samples are measured. The IU events are induced by upgoing neutrinos, while the ID+UGS events are 50% from neutrino from above (ID). The measured number of events is below the expectations, but the reduction is different for the two data set. Because the parent neutrinos for the IU and the ID+UGS events have a quite similar energy spectrum, an overall reduction of the number of neutrino-induced muons has a low probability (5%) to explain the two observed different deficit. This effect is explained with larger probability ( 97%) by the hypothesis of muon neutrino oscillations with maximum mixing and .
In Table 1 is presented a summary of the number of detected events, the number of the expected ones in case of no-oscillation and for oscillations with maximum mixing and . The up throughgoing sample has the higher sensitivity to the oscillation parameters. For this sample, the detection technique and the average energy of the parent neutrino are completely different from the SK and Soudan 2 ones. However, the allowed region in the oscillation parameter space largely overlap that of SK and Soudan 2, and also the best fit parameters are similar to the SK one.
| Data | MC (Bartol flux) | ||
|---|---|---|---|
| No osci | With osci | ||
| - Bckg | |||
| Up Through | 607 | ||
| IU | 116 | ||
| ID+UGS | 193 | ||
References
- [1] Soudan 2 Collaboration, (Proc. of NEUTRINO 98); W.W.M. Allison et al., Phys. Lett. B449 (1999)137.
- [2] MACRO Collaboration, (Proc. of NEUTRINO 98), Takayama, Japan. hep-ex/9810008
- [3] SuperKamiokande Collaboration, (Proc. of NEUTRINO 98), hep-ex/9810001; T. Kajita, Proc. of this conference.
- [4] MACRO Collaboration, M. Ambrosio et al., Astroparticle Physics. 9(1998) 105
- [5] V. Agrawal, T.K. Gaisser, P. Lipari and T. Stanev, Phys. Rev. D53 (1996) 1314.
- [6] M. Glück, E. Reya and M. Stratmann , Z. Phys. C67 (1994) 433.
- [7] W. Lohmann et al., CERN-EP/85-03 (1985).
- [8] G.Feldman and R.Cousins, Phys. Rev. D57 (1998)3873.
- [9] P. Lipari, M. Lusignoli and F. Sartogo, Phys. Rev. Lett. 74 (1995) 4384.