Neutrino-induced upward stopping muons in Super-Kamiokande
Abstract
A total of 137 upward stopping muons of minimum energy 1.6 GeV are observed by Super-Kamiokande during 516 detector live days. The measured muon flux is compared to an expected flux of . Using our previously-published measurement of the upward through-going muon flux, we calculate the stopping/through-going flux ratio , which has less theoretical uncertainty. The measured value of =0.22 is significantly smaller than the value expected using the best theoretical information (the probability that the measured is a statistical fluctuation below the expected value is 0.39%). A simultaneous fitting to zenith angle distributions of upward stopping and through-going muons gives a result which is consistent with the hypothesis of neutrino oscillations with the parameters and 1.510-31.510-2 eV2 at 90% confidence level, providing a confirmation of the observation of neutrino oscillations by Super-Kamiokande using the contained atmospheric neutrino events.
pacs:
PACS numbers: 14.60.Pq, 96.40.Tvkeywords:
neutrino oscillations, Super-Kamiokande, upward stopping muons, upward throughgoing muons, atmospheric muon neutrinos, cosmic raysThe Super-Kamiokande Collaboration
Y.Fukudaa, K.Ishiharaa, Y.Itowa, T.Kajitaa, J.Kamedaa, S.Kasugaa, K.Kobayashia, Y.Kobayashia, Y.Koshioa, M.Miuraa, M.Nakahataa, S.Nakayamaa, Y.Obayashia, A.Okadaa, K.Okumuraa, N.Sakuraia, M.Shiozawaa, Y.Suzukia, H.Takeuchia, Y.Takeuchia, Y.Totsukaa, S.Yamadaa, M.Earlb, A.Habigb, E.Kearnsb, M.D.Messierb, K.Scholbergb, J.L.Stoneb, L.R.Sulakb, C.W.Walterb, M.Goldhaberc, T.Barszczakd, D.Casperd, W.Gajewskid, W.R.Kroppd, S.Mined, L.R.Priced, M.Smyd, H.W.Sobeld, M.R.Vaginsd, K.S.Ganezere, W.E.Keige, R.W.Ellsworthf, S.Tasakag, A.Kibayashih, J.G.Learnedh, S.Matsunoh, V.J.Stengerh, D.Takemorih, T.Ishiii, H.Ishinoi, T.Kobayashii, K.Nakamurai, Y.Oyamai, A.Sakaii, M.Sakudai, O.Sasakii, S.Echigoj, M.Kohamaj, A.T.Suzukij, T.Inagakik, K.Nishikawak, T.J.Hainesl,d, E.Blaufussm, B.K.Kimm, R.Sanfordm, R.Svobodam, M.L.Chenn, J.A.Goodmann, G.W.Sullivann, J.Hillo, C.K.Jungo, K.Martenso, C.Maugero, C.McGrewo, E.Sharkeyo, B.Vireno, C.Yanagisawao, W.Dokip, M.Kirisawap, S.Inabap, K.Miyanop, H.Okazawap, C.Sajip, M.Takahaship, M.Takahatap, K.Higuchiq, Y.Nagashimaq, M.Takitaq, T.Yamaguchiq, M.Yoshidaq, S.B.Kimr, M.Etohs, A.Hasegawas, T.Hasegawas, S.Hatakeyamas, K.Inoues, T.Iwamotos, M.Kogas, T.Maruyamas, H.Ogawas, J.Shirais, A.Suzukis, F.Tsushimas, M.Koshibat, Y.Hatakeyamau, M.Koikeu, M.Nemotou, K.Nishijimau, H.Fujiyasuv, T.Futagamiv, Y.Hayatov, Y.Kanayav, K.Kaneyukiv, Y.Watanabev, D.Kielczewskaw,d,∗, J.S.Georgex,‡, A.L.Stachyrax, R.J.Wilkesx, K.K.Youngx,†
aInstitute for Cosmic Ray Research, University of Tokyo, Tanashi,
Tokyo 188-8502, Japan
bDepartment of Physics, Boston University, Boston, MA 02215, USA
cPhysics Department, Brookhaven National Laboratory, Upton, NY 11973, USA
dDepartment of Physics and Astronomy, University of California, Irvine,
Irvine, CA 92697-4575, USA
eDepartment of Physics, California State University,
Dominguez Hills, Carson, CA 90747, USA
fDepartment of Physics, George Mason University, Fairfax, VA 22030, USA
gDepartment of Physics, Gifu University, Gifu, Gifu 501-1193, Japan
hDepartment of Physics and Astronomy, University of Hawaii,
Honolulu, HI 96822, USA
iInst. of Particle and Nuclear Studies, High Energy Accelerator
Research Org. (KEK), Tsukuba, Ibaraki 305-0801, Japan
jDepartment of Physics, Kobe University, Kobe, Hyogo 657-8501, Japan
kDepartment of Physics, Kyoto University, Kyoto 606-8502, Japan
lPhysics Division, P-23, Los Alamos National Laboratory,
Los Alamos, NM 87544, USA
mDepartment of Physics and Astronomy, Louisiana State University,
Baton Rouge, LA 70803, USA
nDepartment of Physics, University of Maryland,
College Park, MD 20742, USA
oDepartment of Physics and Astronomy, State University of New York,
Stony Brook, NY 11794-3800, USA
pDepartment of Physics, Niigata University,
Niigata, Niigata 950-2181, Japan
qDepartment of Physics, Osaka University, Toyonaka, Osaka 560-0043, Japan
rDepartment of Physics, Seoul National University, Seoul 151-742, Korea
sDepartment of Physics, Tohoku University, Sendai, Miyagi 980-8578, Japan
tThe University of Tokyo, Tokyo 113-0033, Japan
uDepartment of Physics, Tokai University, Hiratsuka, Kanagawa 259-1292,
Japan
vDepartment of Physics, Tokyo Institute for Technology, Meguro,
Tokyo 152-8551, Japan
wInstitute of Experimental Physics, Warsaw University, 00-681 Warsaw,
Poland
xDepartment of Physics, University of Washington,
Seattle, WA 98195-1560, USA
PACS numbers: 14.60.Pq, 96.40.Tv
keywords: neutrino oscillations, Super-Kamiokande, upward stopping muons, upward throughgoing muons, atmospheric muon neutrinos, cosmic rays
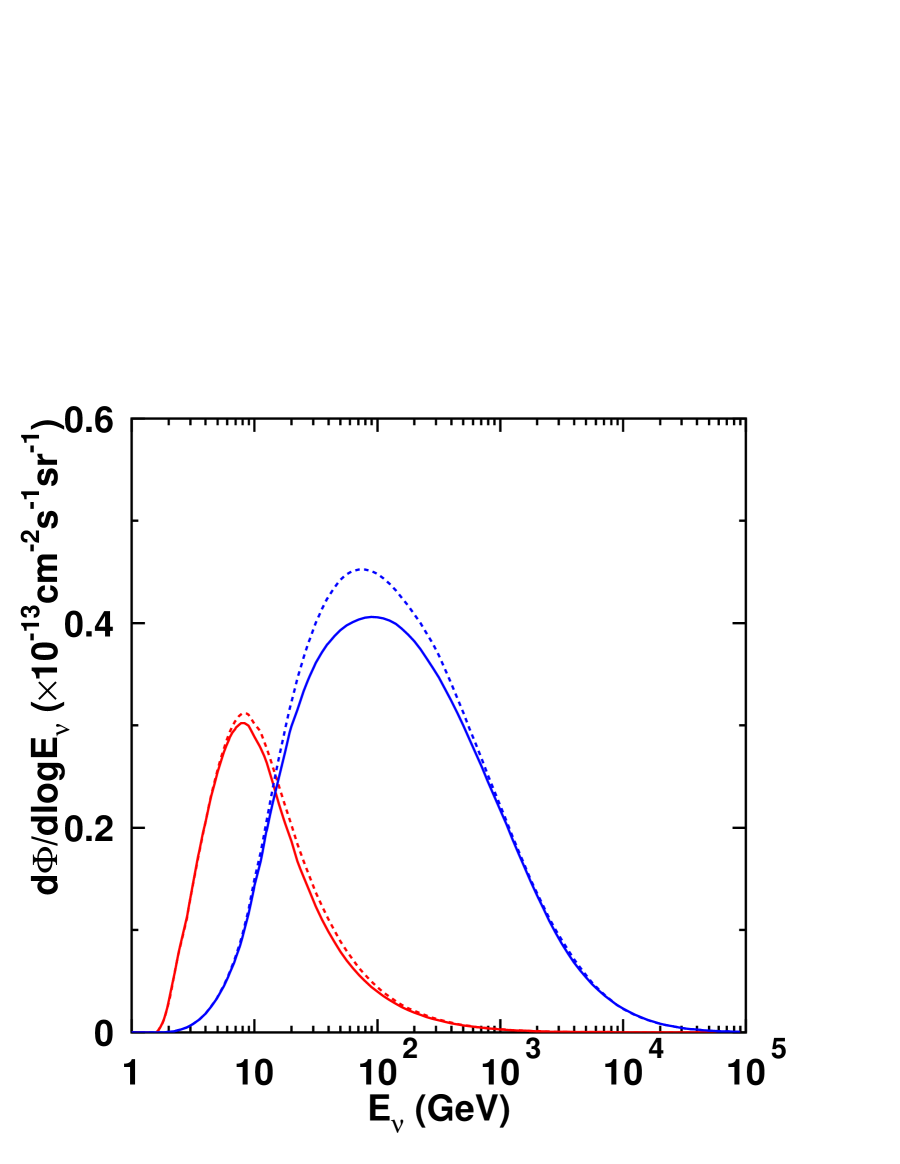
Energetic atmospheric or interact with the rock surrounding the Super-Kamiokande (“Super-K”) detector and produce muons via weak interactions. For downward-going particles, the rock overburden is insufficient to prevent cosmic-ray muons from overwhelming any neutrino induced muons, but upward-going muons are or induced because the entire thickness of the earth shields the detector. Muons energetic enough to cross the entire detector are defined as “upward through-going muons”, and have been discussed in a previous article [5]. The typical energy of the parent neutrinos is approximately 100 GeV. Upward-going muons that stop in the detector are defined as “upward stopping muons”, and come from parent atmospheric neutrinos with a typical energy of about 10 GeV. These energy spectra are shown in Fig. 1. Neutrinos arriving vertically from beneath the detector travel roughly 13,000 km from their point of production, while those coming from near the horizon originate only 500 km away. Thus, observation of upward-going muons provides a relatively pure sample of muon neutrinos, with a wide range of path lengths, allowing tests of possible disappearance due to flavor neutrino oscillations [6].
For atmospheric neutrinos with interaction vertices inside the detector’s fiducial volume (referred to as “contained” events), Super-K measures a low ratio [7] and clearly observes a strong zenith angle dependence of the events [8]. This muon neutrino disappearance [9] is consistent with oscillations, while the up-down symmetry seen in the events rules out significant appearance, in agreement with recent results from the CHOOZ experiment [10]. The oscillation hypothesis suggested to explain the Super-K contained event results is also consistent with anomalous upward through-going muon zenith angle distributions observed by Kamiokande [11], MACRO [12] and Super-Kamiokande [5]. The upward stopping muons are the remaining class of atmospheric neutrino events with which Super-K can test the oscillation hypothesis. It should be noted here that the parent neutrino energies of upward stopping muons are similar to those of multi-GeV fully-contained (FC) and partially-contained (PC) events discussed in [8]. Thus, a similar deficit of upward stopping muons to that of upward-going multi-GeV FC and PC events is expected if the oscillation hypothesis is the cause of the multi-GeV FC and PC event deficit. The main difference between the multi-GeV FC and PC event sample and the upward stopping muon sample is that roughly 80% of the upward stopping muons are generated in the surrounding rock, which has different neutrino interaction cross-sections and systematic uncertainties than does water.
The Super-K detector is a 50 kton cylindrical water Cherenkov detector. To reduce the cosmic-ray muon background, the detector was constructed 1000 m (2700 m.w.e.) underground at the Kamioka Observatory, Institute for Cosmic Ray Research, the University of Tokyo, in the Kamioka-Mozumi mine, Japan. The detector is divided by an optical barrier instrumented with photomultiplier tubes (“PMT”s) into a cylindrical primary detector region (the Inner Detector, or “ID”) and a surrounding shell of water (the Outer Detector, or “OD”) serving as a cosmic-ray veto counter. Details of the detector and general data reduction procedures can be found in reference [7]. The data used in this analysis were taken from Apr. 1996 to Jan. 1998, corresponding to 516 days of detector livetime.
An upward-going muon is defined as a track that appears to enter the detector from the rock, and reconstructs as traveling in the upward direction. Thus, PMT activity in the OD at the muon’s entrance point is required. The total cosmic-ray muon rate at Super-K is 2.2 Hz, of which a few percent are stopping muons, and the great majority are downward-going. The trigger efficiency for a muon entering the ID with momentum more than 200 MeV/c is 100% for all zenith angles.
Muons which leave entrance signal clusters in the OD with no corresponding exit cluster are regarded as stopping. A neutrino interaction inside the water of the OD also produces such a signal, so some fraction () of the upward-going stopping muon sample is estimated to originate in the OD rather than the rock according to simulations. This effect has been accounted for in the expected flux calculations.
Stopping muons with track length 7 m (1.6 GeV) in the ID are selected for further analysis. The stopping muon track length is determined by calculating the muon momentum from a photoelectron count in the same way as in the contained event analysis [7]. This cut eliminates short tracks that are very close to the PMTs and thus are hard to reconstruct, provides an energy threshold, and also eliminates nearly all contamination of the upward stopping muon signal by pions. These pions are photoproduced by cosmic-ray muons outside the detector and are observed to have a soft spectrum [13], such that residual contamination upward-going pions meeting the 7 m track length requirement is estimated to be 1%. The nominal detector effective area for upward-going muons with a track length 7 m in the ID is 1200 m2.
137 upward stopping muons which satisfy a cut are found, where is the zenith angle of the muon track, with corresponding to vertically upward-going events.
Details of the muon track reconstruction method and data reduction algorithm are similar to those of through-going muons described elsewhere [5]. The total detection efficiency for the complete data reduction process for upward stopping muons is estimated by a Monte Carlo simulation to be 98% over . The validity of this Monte Carlo estimate is in turn checked with real cosmic-ray downward stopping muons, taking advantage of the up/down symmetry of the detector geometry.
Because of multiple Coulomb scattering and finite muon fitter angular resolution ( [5]), some of the abundant downward-going cosmic-ray stopping muon background may be reconstructed with and contaminate the neutrino induced upward stopping muon sample. Figure 2 illustrates the estimation of this contamination by extrapolation of the downward-going zenith angle distribution to the flat neutrino-induced signal near the horizon. This background falls exponentially with decreasing , the contribution to apparent upward stopping muons is estimated to be 10.8 events in the zenith angle bin with between -0.2 and 0. This is a larger contamination than was present in the upward through-going muon sample due to the lower muon energies (and correspondingly larger multiple scattering) of the stopping muon sample, and is more uncertain due to lower statistics. As an independent crosscheck of the background contamination, the energy spectrum of the observed stopping muons is shown in Fig. 3. That shape is consistent with the expected and no significant contamination is observed at the 1.6 GeV muon energy analysis threshold.
To analytically calculate the expected upward stopping (and through-going as well) muon flux, employed is the combination of the Bartol atmospheric neutrino flux model [14], a neutrino interaction model composed of quasi-elastic (QE) scattering [15] + single-pion (1) production [16] + deep inelastic (DIS) scattering multi-pion production based on the parton distribution functions (PDF) of GRV94 [17] with the additional kinematic constraint of GeV/c2 (where is the invariant mass of the hadronic recoil system), and Lohmann’s muon energy loss formula in standard rock [18].
This expected flux is compared to three other analytic calculations to estimate the model-dependent uncertainties of the expected muon flux. The other flux calculations use various pairwise permutations of the Honda flux [19] or the atmospheric neutrino flux model calculated by the Bartol group [14], the GRV94DIS PDF or the CTEQ3M [20]PDF. This comparison yields 10% of difference in the overall flux and -2% to +1% for the bin-by-bin shape difference in the zenith-angle distribution. The shape difference is due mostly to differences in the input flux models.
The expected muon flux resulting from the above calculation is (), where the estimated theoretical uncertainties are described in Table I. The dominant error comes from the overall normalization uncertainty in the neutrino flux, which is estimated to be approximately % [14, 19, 21] above several GeV.
Given the detector live time , the effective area for upward stopping muons , and the detection efficiency , the upward stopping muon flux is calculated using:
where the index runs over observed events, is the total solid angle covered by the detector for upward stopping muons, and is the total number of observed muon events (137). Subsequently, we subtract the cosmic-ray muon contamination (10.8 events) from the most horizontal bin (-0.2cos0). The resulting observed upward stopping muon flux is: . If instead of subtracting this background, we simply omit upward stopping muons coming from the thin-rock region [5] in the most horizontal cos bin (-0.1cos0 and 60∘ 310∘), the calculated flux differs from the background-subtracted flux by -1.1%. Systematic errors in the experimental measurement are summarized in Table II.
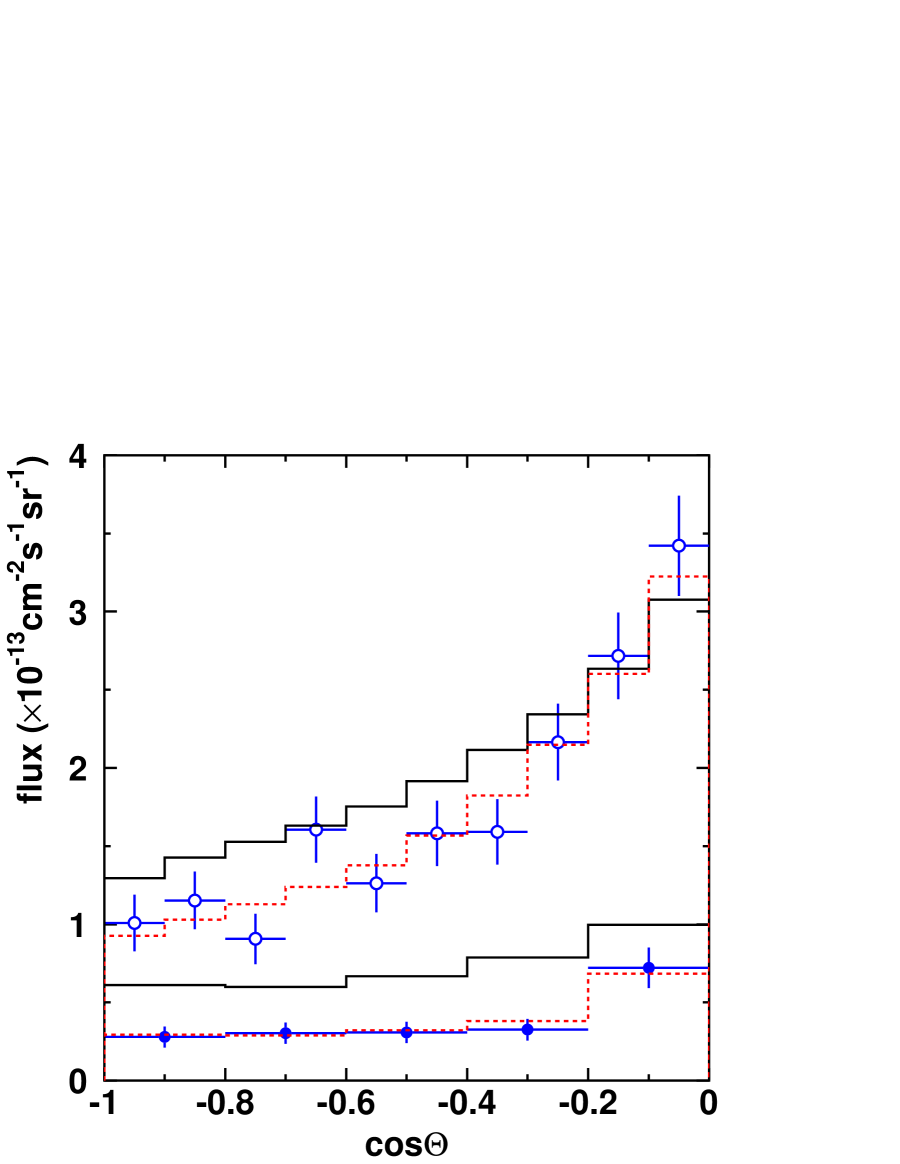
The flux as a function of zenith angle, , is shown in Fig. 4. Due to limited statistics for stopping muons, 5 angular bins are used instead of the 10 bins used for Super-K through-going muons. With the present statistics, the shape of the normalized distribution is consistent with the no-oscillations hypothesis (/d.o.f. = 4.1/4 corresponding to 39% probability). However, the overall flux of upward stopping muons observed is substantially depressed from that expected, as this shape comparison is made after multiplying the expected flux by a free-running overall normalization factor (1+) whose best fit value is calculated by a shape fit . This can be compared with an observed no-oscillations in the through-going muon sample [5].
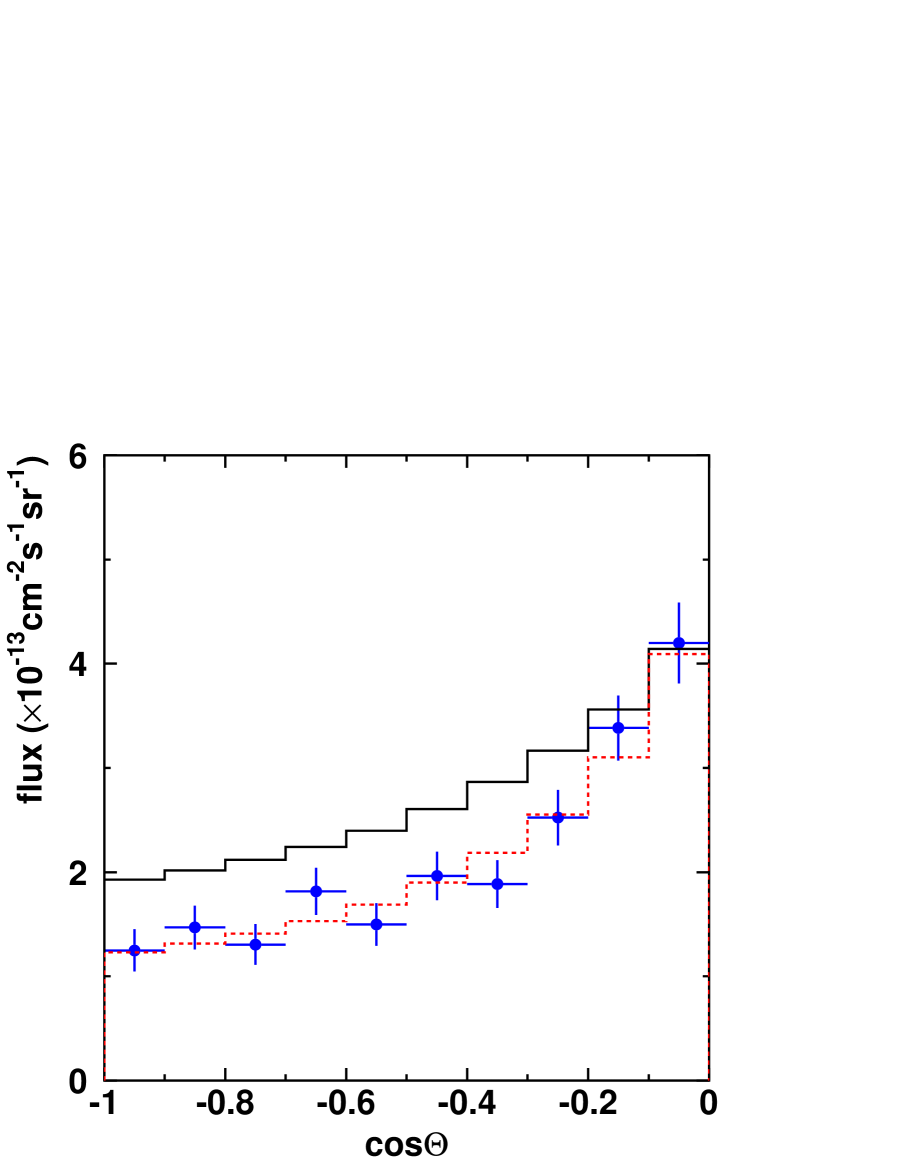
Adding the upward through-going flux [5] , we obtain a detector-independent total upward-going muon flux of with muon energy 1.6 GeV. The zenith angle distribution of the summed flux, , is shown in Fig. 5.
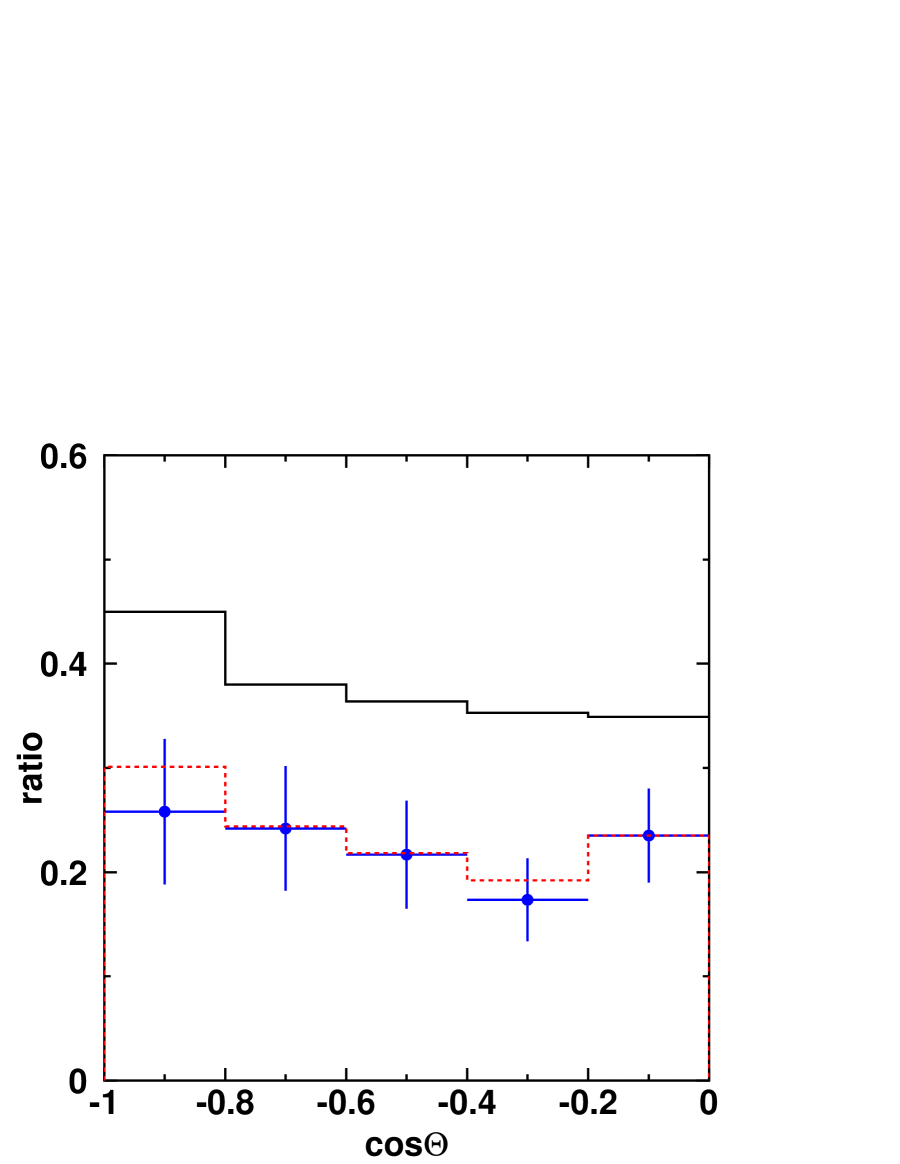
A more useful physical quantity than the absolute flux for probing neutrino oscillations is the stopping/through-going flux ratio , which cancels much of the large () uncertainty in the neutrino flux normalization and the neutrino interaction cross sections[22]. The systematic theoretical and experimental uncertainties in are summarized in Table III and Table IV, respectively. The measured is , while the expected is . The probability that the observed ratio could fluctuate this far below the expectation is 0.39%. The zenith angle distribution of the ratio is shown in Fig. 6.
Using these data, we derive probability contours on the neutrino oscillation parameter plane for the oscillation hypothesis, as shown in Fig. 7, based on a defined by:
where is the observed ratio in the -th cos bin, the experimental statistical error, the bin-by-bin uncorrelated systematic error (2%) estimated by adding uncorrelated theoretical and experimental systematic errors in Table III and Table IV in quadrature, and the expected ratio. The for represents a stopping-to-throughgoing relative muon flux normalization factor with error =14% estimated by the correlated theoretical and experimental systematic errors in Table III and Table IV added in quadrature.
The allowed region thus obtained in Fig. 7 is in good agreement with that found in the Super-K contained event analysis [9]. The minimum locations on the plane and corresponding parameter values for various conditions are listed in Table V. As the minimum lies in the unphysical region, the contour is drawn according to the prescription for bounded physical regions given in Ref. [23]. Because the surface has a rather broad minimum, the specific best-fit oscillation parameter values cited are of less importance than the contours shown in Fig. 7. If we replace the Bartol neutrino flux [14] by the Honda’s flux [19] and/or the GRV94DIS parton distribution functions [17] by CTEQ3M [20], the allowed region contours do not change significantly.
Finally, we performed an oscillation analysis which use all the upward-going muon information available by simultaneously fitting to the upward through-going and stopping muon zenith angle distributions. In this analysis, is defined by the sum over 10 upward-throughgoing and 5 upward-stopping muon zenith angle bins:
where is the observed muon flux in the -th cos bin, the experimental statistical error, (2 to 4%) the bin-by-bin uncorrelated theoretical and experimental systematic errors in Table I and Table II added in quadrature for or from Ref. [5] for , the expected muon flux, the running overall flux normalization factor with error of 22% estimated by adding in quadrature the correlated theoretical systematic errors in Table I, the running stopping-to-throughgoing relative muon flux normalization factor with error =14% estimated by the correlated theoretical and experimental systematic errors in Table III and Table IV added in quadrature. The results are shown in Fig. 7 and are consistent with those from the Super-K contained event analysis. As is shown in Table V, the minimum falls in the unphysical region so the contours are drawn according to the prescription for bounded physical regions given in Ref. [23].
The contamination due to charged current interactions and neutral current interactions in the upward-going muons is estimated to be 1% by a Monte Carlo simulation and is neglected in these analyses. The contribution of possible interactions in the rock below to the upward stopping muon flux is suppressed by branching ratios and kinematics to less than a few percent, and is also neglected.
The observed overall upward stopping muon flux alone and its zenith angle distribution do not conflict with the expected no-oscillations values significantly within the present statistical and systematic errors. However, in order to simultaneously explain both the stopping and through-going upward muon fluxes using both an analysis based on the stop/through ratio and a combined fit of upward stopping and through-going muon zenith angle data, the no-oscillations theoretical expectations reproduce the observed fluxes poorly at the 0.39% C.L. (stop/thru ratio averaged over zenith angle) and 0.87% C.L, respectively, while the oscillation assumption is consistent with observations. This result supports the evidence for neutrino oscillations given by the analysis of the contained and through-going muon atmospheric neutrino events by Super-K.
We gratefully acknowledge the cooperation of the Kamioka Mining and Smelting Company. The Super-Kamiokande experiment has been built and operated from funding by the Japanese Ministry of Education, Science, Sports and Culture, and the United States Department of Energy.
| Error source | Error | |
|---|---|---|
| typical flux normalization | 20%a | |
| Choice of flux/PDF | ||
| overall flux | 10%a | |
| bin by bin | -2% to +1% b | |
| Error source | Error |
|---|---|
| 7 m track length cut | 5%a |
| Live time | 1%a |
| Reconstruction efficiency | %b |
| Error source | Error | |
| Primary spectral index 0.05 | 13%a | |
| Choice of flux | ||
| overall ratio | 1%a | |
| bin by bin | -1% to +2%b | |
| cross section c | 4%a | |
| Error source | Error |
|---|---|
| 7 m track length cut | 5% a |
| Live time | 1% a |
| stop/thru misidentification | 1% a |
| Reconstruction efficiency | 1% b |
| Case | /DOF | Probability | ||||
|---|---|---|---|---|---|---|
| Flux vs. zenith angle (Fig. 4): | - | - | -0.51 | - | 4.1/4 | 39% |
| analysis (Fig. 6): | ||||||
| Fit in the physical region | 1.00 | - | -0.084 | 0.76/3 | 86% | |
| Fit over all space | 1.19 | - | -0.003 | 0.30/3 | 96% | |
| No oscillations | - | - | - | -0.35 | 8.4/5 | 13% |
| (stop+through) cos() analysis (Fig. 7): | ||||||
| Fit in the physical region | 1.00 | 0.061 | -0.083 | 8.8/13 | 79% | |
| Fit over all space | 1.13 | 0.10 | -0.012 | 8.2/13 | 83% | |
| No oscillations | - | - | -0.16 | -0.36 | 31.0/15 | 0.87% |


REFERENCES
- [1]
- [2] Deceased
- [3] Supported by the Polish Committee for Scientific Research no. 2P03B05316
- [4] Present address: Space Radiation Laboratory, California Inst. of Technology, Pasadena, CA 91125 USA
- [5] Y. Fukuda et al, Phys. Rev. Lett. 82, 2644 (1999).
- [6] Z. Maki, M. Nakagawa and S. Sakata, Prog. Theor. Phys. 28,870 (1962); B. Pontecorvo, Sov. Phys. JETP. 26,984 (1968).
- [7] Y. Fukuda et al, Phys. Lett. B433, 9 (1998).
- [8] Y. Fukuda et al, Phys. Lett. B436, 33 (1998).
- [9] Y. Fukuda et al, Phys. Rev. Lett. 81, 1562 (1998).
- [10] M. Apollonio et al, Phys. Lett. B420, 397 (1998).
- [11] S. Hatakeyama et al, Phys. Rev. Lett. 81, 2016 (1998).
- [12] M. Ambrosio et al, Phys. Lett. B434 451 (1998).
- [13] M. Ambrosio et al, Astroparticle Physics 9 105 (1998).
- [14] V. Agrawal, T.K. Gaisser, P. Lipari, T. Stanev, Phys. Rev. D53, 1314 (1996).
- [15] C.H. Llewellyn Smith, Phys. Rep. 3, 261 (1972).
- [16] D. Rein and L.M. Seghal, Ann. Phys. 133, 79 (1981).
- [17] M. Glűck, E. Reya and A. Vogt, Z. Phys. C67, 433 (1995).
- [18] W. Lohmann, R. Kopp and R. Voss, CERN Yellow Report No. 85-03.
- [19] M. Honda et al, Phys. Rev. D52, 4985 (1995), Prog. Theor. Phys. Suppl. 123, 483 (1996).
- [20] J. Botts et al, Phys. Lett. B304, 159 (1993); H.L. Lai et al, Phys. Rev. D51, 4763 (1995).
- [21] W. Frati et al, Phys. Rev. D48, 1140 (1993).
- [22] R. Becker-Szendy et al, Phys. Rev. Lett. 69 1010 (1992).
- [23] R.M. Barnett et al., “Review of particle properties. Particle Data Group,”, Section “Gaussian Errors–Bounded Physical Region”, Phys. Rev. D54, 164 (1996).