Observation of the Cabibbo–suppressed decay
Abstract
We report the first observation of the Cabibbo–suppressed charm baryon decay . We observe events for the signal. The data were accumulated using the SELEX spectrometer during the 1996–1997 fixed target run at Fermilab, chiefly from a 600 GeV/ beam. The branching fractions of the decay relative to the Cabibbo–favored and are measured to be and , respectively.
The study of Cabibbo–suppressed (CS) charm decays can provide useful insights into the weak interaction mechanism for non–leptonic decays [13]. The observed final state may arise either from direct quark emission at the decay stage or, in some cases, from quark rearrangement due to final–state scattering. By comparing the strengths of CS decays to their Cabibbo–favored (CF) analogs, one can, in a systematic way, assess the contributions of the various mechanisms.
Modern methods for calculating non–leptonic decay rates of the charm hadrons employ heavy quark effective theory and the factorization approximation [14]. Nonetheless, the three–body decays of charm baryons are prohibitively difficult to calculate due to the complexity of associated final state interactions. Measurements of the relative branching fractions of charm baryon states, both CF and CS, give additional information about the structure of the decay amplitude and the validity of the factorization approximation.
Many CS hadronic decays of charm mesons have been measured by both collider and fixed target experiments. Until now the only CS charm baryon decay reported with significant statistics is and its resonant state, [15, 16]. This transition requires internal W–emission and may be inhibited by color–suppression effects. In this paper, we present the first observation of the CS decay and determine the branching fractions of this decay relative to the CF and modes. All three of these modes involve external W–emission.
Figure 1 shows a spectator diagram with external –emission for decaying into a CF and a CS mode.

(The other CF mode interchanges and quark lines and produces a pair from the vacuum instead of a pair.) The decay process is similar in the two modes except for the flavor change in the weak decay Cabibbo–Kobayashi–Maskawa matrix element ( vs. ). Based on a simplified dimensional analysis, we would expect where is the Cabibbo angle and , of order unity, measures the ratio of the hadronic contributions to the weak decay matrix element. The factor 2.1 reflects the relative phase space of the two modes. By comparing the factors for the entire family of CS non–leptonic charm baryon decays one may develop a picture of the dominant features of the amplitudes.
The SELEX(E781) experiment at Fermilab is particularly well–suited for studying CS charm baryon decays because of its excellent particle identification capabilities. SELEX is a high energy hadroproduction experiment using a 3–stage spectrometer designed for high acceptance for forward interactions (). The experiment emphasizes understanding charm production in the forward hemisphere and the study of charm baryon decays. Using both a negative beam (% , % ) and positive beam (% , % ), SELEX recorded 15.2 billion interaction events during the 1996–1997 fixed target run. The majority particles (, ) in the 600 GeV/ negative beam and the protons in the 540 GeV/ positive beam were tagged by a beam transition radiation detector. The data were accumulated from a segmented target (5 foils: 2 Cu, 3 C, each separated by 1.5 cm) whose total thickness was 5% of an interaction length for protons.
The spectrometer had silicon strip detectors to measure the beam and outgoing tracks, giving precision primary and secondary vertex reconstruction. Transverse position resolution () was 4 for the 600 GeV/ beam tracks. The average longitudinal vertex position resolution was 270 for primary and 560 for secondaries, respectively. Momenta of particles deflected by the analyzing magnets were measured by a system of proportional wire chambers (PWCs), drift chambers and silicon strip detectors. Momentum resolution for a typical 100 GeV/ track was %. The absolute momentum scale was calibrated using the mass. For decays the average mass resolution was 9 MeV/ independent of momenta from 100–450 GeV/. Charged particle identification was done with a Ring Imaging erenkov detector (RICH) [17], which distinguished from up to 165 GeV/. The proton identification efficiency was greater than 95% above proton threshold ( GeV/). For pions the total mis–identification probability due to all sources of confusion was less than 4%.
Interactions were selected by a scintillator trigger. The trigger for charm required at least 4 charged tracks after the targets as indicated by an interaction counter and at least 2 hits in a scintillator hodoscope after the second analyzing magnet. It accepted about 1/3 of all inelastic interactions. Triggered events were further tested in an on–line computational filter based on downstream tracking and particle identification information. The on–line filter selected events that had evidence of a secondary vertex from tracks completely reconstructed using the forward PWC spectrometer and the vertex silicon. This filter reduced the data size by a factor of nearly 8 at a cost of about a factor of 2 in charm written to tape (as determined from a study of unfiltered , and decays). Most of the charm loss came from selection cuts that were independent of charm species or kinematic variables and which improved the signal/noise in the final sample.
Results presented here come from the first processing pass through all data. In this analysis, secondary vertex reconstruction was attempted when the per degree of freedom (/dof) for the fit of the ensemble of tracks to a single primary vertex exceeded 5. All combinations of tracks were formed for secondary vertices with as many as 5 prongs. Secondary vertices were tested against a reconstruction table that specified selection criteria for each charm decay mode. Secondary vertices which occurred inside the volume of a target or after the first plane of the silicon vertex detector were rejected.
The sample was selected by the following requirements: (i) primary and secondary vertex fits each have ; (ii) vertex separation significance , where is the longitudinal separation between primary and secondary vertices and is the error on ; (iii) the reconstructed momentum vector from the secondary vertex points back to the primary vertex with ; (iv) the momentum of the 5 GeV/; (v) ()/ for identification and ()/ for identification, where is the mass–selection likelihood function for the RICH; and (vi) the sum of the squared transverse momenta of the three daughter particles with respect to the parent direction, .
Figure 2 shows the first observation of the CS decay mode. The inset of the figure shows the invariant mass distribution from the entire selected mass range of reconstructed candidates. The large peak in the inset is the decay . The bump at the right is the CS decay. The distribution has an artificial high–mass cutoff because of a maximum mass cut imposed in this first–pass analysis. Monte Carlo simulations show that the observed number of signal events is systematically reduced only by ()% due to this cutoff. The background characteristics are very similar both in the number per mass bin and lifetime through the entire mass region, so that the background subtraction under the peak is stable. The lifetime both of background and signal events for the region has been investigated. The background apparent lifetime is quite short, while the lifetime is consistent with the Particle Data Group average [18]. A detailed lifetime analysis is underway and will be reported elsewhere.

The mass is determined using a Gaussian of variable centroid, width and area. The number of signal events is determined by a sideband subtraction method. The signal window is determined from the data and is set at 45 MeV/. The background is a second order polynomial fit to the entire mass region excluding a 65 MeV/ wide window centered at each mass peak. The yield is the difference between the summed events in the 45 MeV/ signal window centered at 2.467 GeV/ and the extrapolated background. Variations in the exclusion window size change the extrapolated background by fewer than 2 events. There are events for at a mass of MeV/. The statistical significance for the signal, , is in which is the number of signal events and is the number of background events in the signal region.
Background contributions from charm baryon ( and ) decay to the CS decay are expected to be negligible; they produce an even number of secondary vertex tracks and their decay lengths are short compared to the minimum flight path cut. Excellent proton identification strongly suppresses background from charm meson decays (three–body and ).
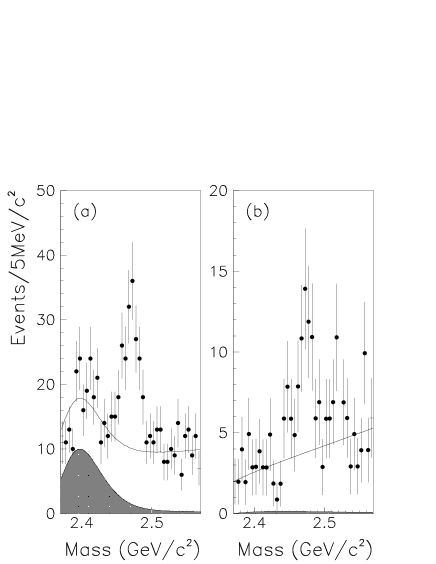
One normalizes the CS mode by comparing it to CF modes that have a hyperon in the final state. In the first reconstruction pass, hyperons () were identified only inclusively in a limited decay interval (5 – 12 m downstream from the target): candidates had GeV/ and no hits assigned along the trajectory in the 14 chambers after the second analyzing magnet. This category of tracks gives unique identification but is ambiguous between and . Figure 3 shows two CF modes decaying to and , respectively. The shaded areas in Fig. 3(a) and 3(b) are the estimated reflection from and , respectively. The shapes are determined by a Monte Carlo simulation and the areas are normalized to the observed number of signal events in the data. For this part of the analysis, additional cuts were applied to all data. The pion momentum threshold was raised from 5 to 10 GeV/ and the transverse component of the momentum with respect to its line of flight was required to be less than 0.3 GeV/.
The total acceptance (geometrical acceptance and reconstruction efficiency) for decay modes of interest was estimated by embedding Monte Carlo charm decay tracks into data events. Momentum and energy were not conserved in the process, but studies indicate this has little effect on the single–charm acceptance calculation. Events were generated with an average transverse momentum GeV/ and longitudinal momentum distributions as observed for the data. Detector hits, including resolution and multiple Coulomb scattering smearing effects, produced by these embedded tracks were folded into the hit banks of the underlying data event. The new ensemble of hits was passed through the SELEX off–line software. The acceptance is the ratio of the number of events in the signal to the number of embedded events in a particular mode.
The method was checked by measuring two well–determined relative branching fractions, and where the first error is statistical and the second is systematic. Systematic errors include the difference of the ratio for charge–conjugate states, and uncertainties of signal yields and acceptance estimations. The results agree well with the world average [18]. For the decays, the vertex significance cut () was increased to 20 to suppress background from . This costs little signal, since the lifetime of is 2.4 times longer than that of .
Using this procedure, we measure the relative branching fraction for and to be . The systematic error is due to uncertainties in the background subtraction and relative acceptance estimation. This result is comparable to the CLEO measurement, [19]. The number of events and estimated acceptance for the three observed modes with the common set of cuts are summarized in table I.
| Acceptance(%) | Events | |
|---|---|---|
The branching fraction of the CS decay relative to the CF is measured to be which corresponds to . The factor is . To put this in some perspective, the corresponding factor for the CS decay relative to the CF mode is , using the world average for the branching fraction and correcting for phase space. Thus, the factors for these two different baryons are similar. In contrast, the CS ratios of mesons depend strongly on final state multiplicity, suggestive of sizable final state interactions. For the mode, B()/ B() is measured to be . Systematic errors include uncertainties in (i) the relative acceptance estimation, (ii) background subtractions due to the reflection from other hyperon modes, and (iii) the yield due to the imposed mass cutoff.
In summary, we observe the CS decay at a mass of MeV/ with signal events. The relative branching fractions of the decay to the CF and are measured to be and , respectively.
The authors are indebted to the staffs of Fermi National Accelerator Laboratory, the Max–Planck–Institut für Kernphysik, Carnegie Mellon University, and Petersburg Nuclear Physics Institute for invaluable technical support. This project was supported in part by Bundesministerium für Bildung, Wissenschaft, Forschung und Technologie, Consejo Nacional de Ciencia y Tecnología (CONACyT), Conselho Nacional de Desenvolvimento Científico e Tecnológico, Fondo de Apoyo a la Investigación (UASLP), Fundação de Amparo à Pesquisa do Estado de São Paulo (FAPESP), the Israel Science Foundation founded by the Israel Academy of Sciences and Humanities, Istituto Nazionale de Fisica Nucleare (INFN), the International Science Foundation (ISF), the National Science Foundation (Phy #9602178), NATO (grant CR6.941058-1360/94), the Russian Academy of Science, the Russian Ministry of Science and Technology, the Turkish Scientific and Technological Research Board (TÜBİTAK), the U.S. Department of Energy (DOE grant DE-FG02-91ER40664 and DOE contract number DE-AC02-76CHO3000), and the U.S.-Israel Binational Science Foundation (BSF). We also acknowledge a useful conversation with Austin Napier.
REFERENCES
- [1] Present address: Imperial College, London SW7 2BZ, U.K.
- [2] Present address: Instituto de de Física da Universidade Estadual de Campinas, UNICAMP, SP, Brazil
- [3] Deceased
- [4] Present address: Dept. of Physics, Wayne State University, Detroit, MI 48201
- [5] Present address: Universität Freiburg, 79104 Freiburg, Germany
- [6] Present address: Physik–Department, Technische Universität München, 85748 Garching, Germany
- [7] Present address: Instituto de Física Teórica da Universidade Estadual Paulista, São Paulo, Brazil
- [8] Present address: Lucent Technologies, Naperville, IL
- [9] Present address: Max–Planck–Institut für Physik, München, Germany
- [10] Present address: Motorola Inc., Schaumburg, IL
- [11] Present address: Carnegie–Mellon University, Pittsburgh, Pittsburgh, PA
- [12] Present address: Deutsche Bank AG, 65760 Eschborn, Germany
- [13] J.G. Körner and M. Krämer, Z. Phys. C55, 659 (1992).
- [14] M. Bauer, B. Stech and M. Wirbel, Z. Phys. C34, 103 (1987).
- [15] CLEO Collaboration, C.P. Jessop et al., Phys. Rev. Lett. B423, 56 (1994).
- [16] E687 Collaboration, P.L. Frabetti et al., Phys. Lett. B314, 477 (1993).
- [17] J. Engelfried et al., Nucl. Instrum. Methods A 431, 53 (1999).
- [18] Particle Data Group, C. Caso et al., Eur. Phys. J. C3, 1 (1998).
- [19] CLEO Collaboration, T. Bergfeld et al., Phys. Lett. B365, 431 (1996).