\hugehead
11institutetext: University of Bristol, Bristol, United Kingdom 22institutetext: CERN, CH-1211 Genève 23, Switzerland. 33institutetext: Genoa University/INFN, Dipt. di Fisica,I-16146 Genova, Italy. 44institutetext: Grenoble ISN, F-38026 Grenoble, France. 55institutetext: Max-Planck-Institut für Kernphysik, Postfach 103980, D-69029 Heidelberg, Germany. 66institutetext: Universität Heidelberg, Physikal. Inst., D-69120 Heidelberg Germany. thanks: supported by the Bundesministerium für Bildung, Wissenschaft, Forschung und Technologie, Germany, under contract numbers 05 5HD15I, 06 HD524I and 06 MZ5265 77institutetext: Universität Mainz, Inst. für Kernphysik, D-55099 Mainz, Germany. footnotemark: 88institutetext: Moscow Lebedev Physics Inst., RU-117924, Moscow, Russia.

Production of ΞsuperscriptΞ\mathrm{\Xi^{*}} resonances in ΣsuperscriptΣ\mathrm{\Sigma^{-}} induced reactions at 345 GeV/c

The WA89 Collaboration
M.I. Adamovich 88    Yu.A. Alexandrov supported by the Deutsche Forschungsgemeinschaft, contract number436 RUS 113/465, and Russian Foundation for Basic Research under contract number RFFI 98-02-04096.88    S.P. Baranov footnotemark: 88    D. Barberis 33    M. Beck 55    C. Bérat 44    W. Beusch 22    M. Boss 66    S. Brons Now at TRIUMF, Vancouver, B.C., Canada V6T 2A355    W. Brückner 55    M. Buénerd 44    C. Busch 66    C. Büscher 55    F. Charignon 44    J. Chauvin 44    E.A. Chudakov Now at Thomas Jefferson Lab, Newport News, VA 23606, USA66    U. Dersch 55    F. Dropmann 55    J. Engelfried Now at Institudo de Fisica, Universidad San Luis Potosi, S.L.P. 78240, Mexico66    F. Faller Now at Fraunhofer Institut für Solarenergiesysteme, D-79100 Freiburg, Germany66    A. Fournier 44    S.G. Gerassimov Now at Technische Universität München, Garching, Germany5588    M. Godbersen 55    P. Grafström 22    Th. Haller 55    M. Heidrich 55    E. Hubbard 55    R.B. Hurst 33    K. Königsmann Now at Fakultät für Physik, Universität Freiburg, Germany55    I. Konorov footnotemark: 5588    N. Keller 66    K. Martens Now at Department of Physics and Astronomy, SUNY at Stony Brook, NY 11794-3800, USA66    Ph. Martin 44    S. Masciocchi Now at Max-Planck-Institut für Physik, München, Germany55    R. Michaels footnotemark: 55    U. Müller 77    H. Neeb 55    D. Newbold 11    C. Newsom University of Iowa, Iowa City, IA 52242, USA    S. Paul footnotemark: 55    J. Pochodzalla 55    I. Potashnikova 55    B. Povh 55    R.D. Ransome Rutgers University, Piscataway, NJ 08854, USA.    Z. Ren 55    M. Rey-Campagnolle permanent address: CERN, CH-1211 Genève 23, Switzerland44    G. Rosner 77    L. Rossi 33    H. Rudolph 77    C. Scheel NIKHEF, 1009 DB Amsterdam, The Netherlands    L. Schmitt footnotemark: 77    H.-W. Siebert 66    A. Simon footnotemark: 66    V.J. Smith supported by the UK PPARC11    O. Thilmann 66    A. Trombini 55    E. Vesin 44    B. Volkemer 77    K. Vorwalter 55    Th. Walcher 77    G. Wälder 66    R. Werding 55    E. Wittmann 55    M.V. Zavertyaev footnotemark: 88
Abstract

We report on a measurement of the differential and total cross sections of inclusive production of ΞsuperscriptΞ\mathrm{\Xi^{*}}resonances in ΣsuperscriptΣ\mathrm{\Sigma^{-}} - nucleus collisions at 345 GeV/cGeV𝑐\mathrm{GeV/{\mit c}} . The cross section for inclusive Ξ15300subscriptsuperscriptΞ01530\mathrm{\Xi^{0}_{1530}} production is about a factor of 5 below that of Ξ1320subscriptsuperscriptΞ1320\mathrm{\Xi^{-}_{1320}} hyperons. The products of cross section and branching ratio for the observed channels Ξ16900subscriptsuperscriptΞ01690\mathrm{\Xi^{0}_{1690}} \to ΞsuperscriptΞ\mathrm{\Xi^{-}}π+superscript𝜋\mathrm{\pi^{+}} , Ξ1820subscriptsuperscriptΞ1820\mathrm{\Xi^{-}_{1820}} \to Ξ15300subscriptsuperscriptΞ01530\mathrm{\Xi^{0}_{1530}}πsuperscript𝜋\mathrm{\pi^{-}} and Ξ1950subscriptsuperscriptΞ1950\mathrm{\Xi^{-}_{1950}} \to Ξ15300subscriptsuperscriptΞ01530\mathrm{\Xi^{0}_{1530}} πsuperscript𝜋\mathrm{\pi^{-}} are lower by yet another order of magnitude. The Ξ1820subscriptsuperscriptΞ1820\mathrm{\Xi^{-}_{1820}} and Ξ1950subscriptsuperscriptΞ1950\mathrm{\Xi^{-}_{1950}} resonances show significantly harder xFsubscript𝑥𝐹x_{F} and ptsubscript𝑝𝑡p_{t} distributions than ΞsuperscriptΞ\mathrm{\Xi^{-}} and Ξ15300subscriptsuperscriptΞ01530\mathrm{\Xi^{0}_{1530}} hyperons. A comparison of the xFsubscript𝑥𝐹x_{F}-distribution to PYTHIA and QGSM predictions provides only a partial agreement.

1 Introduction

The production of the ground state hyperons and also of their antiparticles has been studied extensively in previous experiments, using neutron, protons and ΞsuperscriptΞ\mathrm{\Xi^{-}} as beam particles with momenta ranging up to 600 GeV/cGeV𝑐\mathrm{GeV/{\mit c}} Bad72 ; Hun75 ; Bou79 ; Bou80 ; Bia81 ; Car85 ; Bia87 ; Bis86 . In a recent paper Ada97 we have reported cross sections for inclusive ΞsuperscriptΞ\mathrm{\Xi^{-}} production by ΣsuperscriptΣ\mathrm{\Sigma^{-}}and πsuperscript𝜋\mathrm{\pi^{-}}of 345 GeV/cGeV𝑐\mathrm{GeV/{\mit c}} and by neutrons of 260 GeV/cGeV𝑐\mathrm{GeV/{\mit c}} mean beam momenta. These measurements confirmed the important role of the valence quark overlap between the beam projectile and the produced baryon at high xFsubscript𝑥𝐹x_{F}, the ‘leading particle effect’.

Only few data exist on the production of excited hyperon resonances in such beams Bia81 ; Bia86 ; Sch90 . In ref. Sch90 a different xFsubscript𝑥𝐹x_{F} behaviour for Ξ0superscriptΞ0\mathrm{\Xi^{0}} and Ξ15300subscriptsuperscriptΞ01530\mathrm{\Xi^{0}_{1530}} was reported. This difference between the octet and the decuplet baryons was nicely reproduced in terms of the quark-diquark cascade model Tas88 . Within that model this feature is related to the diquark structure of the incident and produced baryons.

Here we extend this study for the first time to orbitally excited baryons and present cross section measurements for Ξ15300subscriptsuperscriptΞ01530\mathrm{\Xi^{0}_{1530}}, Ξ16900subscriptsuperscriptΞ01690\mathrm{\Xi^{0}_{1690}}, Ξ1820subscriptsuperscriptΞ1820\mathrm{\Xi^{-}_{1820}} and Ξ1950subscriptsuperscriptΞ1950\mathrm{\Xi^{-}_{1950}} production by ΣsuperscriptΣ\mathrm{\Sigma^{-}} of 345 GeV/cGeV𝑐\mathrm{GeV/{\mit c}} mean momentum. The results on the xFsubscript𝑥𝐹x_{F}-dependence of the cross sections and on the ratio of ΞsuperscriptΞ\mathrm{\Xi^{*}} and ΞsuperscriptΞ\mathrm{\Xi^{-}} production will contribute to a better understanding of the complex process of hadron production in hadron beams. Furthermore, these data may help to explore the role of higher resonances for the spectral distributions of multiply strange hyperons which have recently been suggested Dum99 as an important diagnostic tool for the early freeze-out stage in ultra-relativistic heavy ion collisions.

2 Hyperon beam and experimental apparatus

The hyperon beam was derived from an external proton beam of the CERN-SPS, hitting a hyperon production target placed 16 m upstream of the experimental target. Negative secondaries with a mean momentum of 345 GeV/cGeV𝑐\mathrm{GeV/{\mit c}} and a momentum spread σ(p)/p9%𝜎𝑝𝑝percent9\sigma(p)/p\approx 9\% were selected in a magnetic channel. The production angles relative to the proton beam were smaller than 0.5 mrad. At the experimental target, the beam consisted of πsuperscript𝜋\mathrm{\pi^{-}}, K-, ΣsuperscriptΣ\Sigma^{-} and ΞsuperscriptΞ\mathrm{\Xi^{-}} in the ratio 2.3 : 0.025 : 1 : 0.008. A transition radiation detector (TRD) made of 10 MWPCs interleaved with foam radiators allowed πsuperscript𝜋\mathrm{\pi^{-}}suppression at the trigger level. Typically, about 1.8105Σ1.8superscript105superscriptΣ1.8\cdot 10^{5}\ \mathrm{\Sigma^{-}} and 4.5105π4.5superscript105superscript𝜋4.5\cdot 10^{5}\ \mathrm{\pi^{-}} were delivered to the target during one SPS-spill, which had an effective length of about 1.5 s. More details can be found in Ale98 .

The experimental target consisted of one copper and three carbon blocks arranged in a row along the beam, with thicknesses corresponding to 0.026 λIsubscript𝜆𝐼\lambda_{I} and three times 0.0083 λIsubscript𝜆𝐼\lambda_{I}, respectively. At the target, the beam had a width of 3 cm and a height of 1.7 cm. Microstrip detectors upstream and downstream of the target measured the tracks of the incoming beam particles and of the charged particles produced in the target blocks. The target was positioned 14 m upstream of the centre of the Omega spectrometer magnet Beu77 so that a free field decay region of 10 m length was provided for hyperon and KSsubscript𝐾𝑆K_{S} decays. Tracks of charged particles were measured inside the magnet and in the field-free regions upstream and downstream by MWPCs and drift chambers, with a total of 130 planes. The Omega magnet provided a field integral of 7.5 Tm, and the momentum resolution achieved was σ(p)/p2104𝜎𝑝superscript𝑝2superscript104\sigma(p)/p^{2}\approx 10^{-4} (GeV/c)1superscriptGeV𝑐1\mathrm{\ (GeV/{\mit c})^{-1}}.

Downstream of the spectrometer, a ring-imaging Cherenkov detector, an electromagnetic calorimeter and a hadron calorimeter were placed. They were not used in the analysis presented here.

The main trigger selected about 25%percent2525\% of all interactions, using multiplicities measured in microstrip counters upstream and downstream of the target, and in scintillator hodoscopes and MWPCs behind the Omega magnet. Correlations between hits in different detectors were used in the trigger to increase the fraction of events with high-momentum particles, thus reducing background from low-momentum decay-pions in the beam. In addition, a reduced sample of beam trigger events were recorded for calibration purposes. The results presented in this article are based on 100 million events recorded in 1993.

Refer to caption
Figure 1: Effective mass distribution of Ξπ+superscriptΞsuperscript𝜋\Xi^{-}\pi^{+} combinations.
Particle Mass Width σDatasubscript𝜎𝐷𝑎𝑡𝑎\sigma_{Data} σMCsubscript𝜎𝑀𝐶\sigma_{MC}
ΛΛ\mathrm{\Lambda}\rightarrowpp{\mathrm{p}}πsuperscript𝜋\mathrm{\pi^{-}} 1115.7±0.1plus-or-minus1115.70.11115.7\pm 0.1 1.93 1.62
ΞsuperscriptΞ\mathrm{\Xi^{-}}\rightarrowΛΛ\mathrm{\Lambda}πsuperscript𝜋\mathrm{\pi^{-}} 1321.0±0.1plus-or-minus1321.00.11321.0\pm 0.1 2.68 2.32
ΩsuperscriptΩ\mathrm{\Omega^{-}}\rightarrowΛΛ\mathrm{\Lambda}KsuperscriptK\mathrm{K^{-}} 1672.5±0.9plus-or-minus1672.50.91672.5\pm 0.9 2.4 2.1
Ξ15300subscriptsuperscriptΞ01530\mathrm{\Xi^{0}_{1530}} 1532.2±0.5plus-or-minus1532.20.51532.2\pm 0.5 9.19.19.1 3.7 3.2
Ξ1820subscriptsuperscriptΞ1820\mathrm{\Xi^{-}_{1820}} 1817±3plus-or-minus181731817\pm 3 23±13plus-or-minus231323\pm 13 3.4
Ξ1950subscriptsuperscriptΞ1950\mathrm{\Xi^{-}_{1950}} 1955±6plus-or-minus195561955\pm 6 68±22plus-or-minus682268\pm 22 3.4
Table 1: Mean reconstructed masses and widths of Λ0superscriptΛ0\mathrm{\Lambda^{0}}, ΞsuperscriptΞ\mathrm{\Xi^{-}}, ΩsuperscriptΩ\mathrm{\Omega^{-}}, Ξ15300subscriptsuperscriptΞ01530\mathrm{\Xi^{0}_{1530}}, Ξ1820subscriptsuperscriptΞ1820\mathrm{\Xi^{-}_{1820}} and Ξ1950subscriptsuperscriptΞ1950\mathrm{\Xi^{-}_{1950}}  and mass resolutions from data and Monte Carlo. All numbers are given in units of MeV/c2MeVsuperscript𝑐2\mathrm{\ MeV/{\mit c}^{2}}.

3 Event selection

In the following, we describe the event selection for the decays Ξ15300subscriptsuperscriptΞ01530\mathrm{\Xi^{0}_{1530}} \rightarrow ΞsuperscriptΞ\mathrm{\Xi^{-}}π+superscript𝜋\mathrm{\pi^{+}} and ΞsuperscriptΞabsent\mathrm{\Xi^{-*}}\rightarrow Ξ15300subscriptsuperscriptΞ01530\mathrm{\Xi^{0}_{1530}}πsuperscript𝜋\mathrm{\pi^{-}}. Cuts imposed on the data sample in this analysis are very similar to those used in the measurement of the ΞsuperscriptΞ\mathrm{\Xi^{-}} production cross section Ada97 and in the search for Ξ16900subscriptsuperscriptΞ01690\mathrm{\Xi^{0}_{1690}}\to ΞsuperscriptΞ\mathrm{\Xi^{-}}π+superscript𝜋\mathrm{\pi^{+}} decays Ada98 .

First, Λ0superscriptΛ0\mathrm{\Lambda^{0}} candidates were reconstructed from all pairs of positive and negative tracks which formed a vertex downstream of the target. The minimum distance of approach between the tracks was required to be smaller than 5 mm. For each candidate the effective pp{\mathrm{p}}πsuperscript𝜋\mathrm{\pi^{-}} mass and its error were calculated; the rms of the error was σmsubscript𝜎𝑚absent\sigma_{m}\approx 2.2 MeV/c2MeVsuperscript𝑐2\mathrm{\ MeV/{\mit c}^{2}}. The reconstructed pp{\mathrm{p}}πsuperscript𝜋\mathrm{\pi^{-}} mass had to be within ±plus-or-minus\pm15 MeV/c2MeVsuperscript𝑐2\mathrm{\ MeV/{\mit c}^{2}} around the known Λ0superscriptΛ0\mathrm{\Lambda^{0}} mass PDG , the error of the mass determination was required to be less than 5σm5subscript𝜎𝑚5\cdot\sigma_{m}.

Next, ΞsuperscriptΞ\mathrm{\Xi^{-}} candidates were selected from all pairs of Λ0superscriptΛ0\mathrm{\Lambda^{0}} candidates and negative tracks which formed a vertex downstream of the target. Again the minimum distance of approach between the reconstructed Λ0superscriptΛ0\mathrm{\Lambda^{0}} track and the negative track was required to be smaller than 5 mm. A track corresponding to the ΞsuperscriptΞ\mathrm{\Xi^{-}} track as reconstructed from the decay cascade had to be found in the microstrip detectors downstream of the target. This track was used in the reconstruction of the production vertex (see below). The effective ΛΛ\mathrm{\Lambda}πsuperscript𝜋\mathrm{\pi^{-}} mass had to be within ±plus-or-minus\pm15 MeV/c2MeVsuperscript𝑐2\mathrm{\ MeV/{\mit c}^{2}} of the ΞsuperscriptΞ\mathrm{\Xi^{-}} mass, for the mass resolution a value of 5σmabsent5subscript𝜎𝑚\leq 5\cdot\sigma_{m} was required, where σmsubscript𝜎𝑚\sigma_{m} = 2.7 MeV/c2MeVsuperscript𝑐2\mathrm{\ MeV/{\mit c}^{2}} is the typical resolution.

Then, we required a production vertex containing at least one outgoing charged track in addition to the ΞsuperscriptΞ\mathrm{\Xi^{-}} track. The reconstructed vertex position had to be within a target block. In each coordinate an additional margin of 3σabsent𝜎\cdot\sigma was allowed. The transverse distance between the ΣsuperscriptΣ\mathrm{\Sigma^{-}} beam track and the production vertex was required to be less than 6σ6𝜎6\cdot\sigma (σ25μm𝜎25𝜇𝑚\sigma\approx 25\mu m). This requirement reduced the contributions from neutrons and πsuperscript𝜋\mathrm{\pi^{-}} originating from ΣsuperscriptΣ\mathrm{\Sigma^{-}} decays upstream of the target. Events were also rejected if the beam track was connected to an outgoing track.

Finally, Ξ15300subscriptsuperscriptΞ01530\mathrm{\Xi^{0}_{1530}} candidates to be used in the search for ΞsuperscriptΞabsent\mathrm{\Xi^{-*}}\rightarrow Ξ15300subscriptsuperscriptΞ01530\mathrm{\Xi^{0}_{1530}}πsuperscript𝜋\mathrm{\pi^{-}} decays were selected from all combinations of an accepted ΞsuperscriptΞ\mathrm{\Xi^{-}} with a positively charged particle emerging from the production vertex. The reconstructed ΞsuperscriptΞ\mathrm{\Xi^{-}}π+superscript𝜋\mathrm{\pi^{+}} mass had to be within ±plus-or-minus\pm10 MeV/c2MeVsuperscript𝑐2\mathrm{\ MeV/{\mit c}^{2}} and ±10σmplus-or-minus10subscript𝜎𝑚\pm 10\cdot\sigma_{m} of the Ξ15300subscriptsuperscriptΞ01530\mathrm{\Xi^{0}_{1530}} mass, σmsubscript𝜎𝑚\sigma_{m} being 3.7 MeV/c2MeVsuperscript𝑐2\mathrm{\ MeV/{\mit c}^{2}} typically.

Refer to caption
Figure 2: The ΞsuperscriptΞ\mathrm{\Xi^{-}}π+superscript𝜋\mathrm{\pi^{+}}πsuperscript𝜋\mathrm{\pi^{-}} effective mass distribution in different xFsubscript𝑥𝐹x_{F} regions. The open circles show fake events generated by event mixing, the stars represent the background shape from ”wrong sign” combinations. The lower parts display the ratio of the observed spectra and the backgrounds from event mixing.

4 Observed Ξ15300subscriptsuperscriptΞ01530\mathrm{\Xi^{0}_{1530}}, Ξ1820subscriptsuperscriptΞ1820\mathrm{\Xi^{-}_{1820}} and Ξ1950subscriptsuperscriptΞ1950\mathrm{\Xi^{-}_{1950}} signals.

Fig. 1 shows the ΞsuperscriptΞ\mathrm{\Xi^{-}}π+superscript𝜋\mathrm{\pi^{+}} mass distribution for all combinations of a ΞsuperscriptΞ\mathrm{\Xi^{-}} candidate with a positive particle from the production vertex. A clear signal of Ξ15300subscriptsuperscriptΞ01530\mathrm{\Xi^{0}_{1530}} decays is visible. In order to estimate the number of Ξ15300subscriptsuperscriptΞ01530\mathrm{\Xi^{0}_{1530}} decays, the distribution was fitted by a combination of a Voigtian function (convolution of a Breit-Wigner and a Gauss distribution) with a Legendre polynomial of 3rd order. The width of the underlying Breit-Wigner distribution was fixed to the known value Γ(Ξ15300)=9.1ΓsubscriptsuperscriptΞ015309.1\Gamma(\mathrm{\Xi^{0}_{1530}})=9.1 MeV/c2MeVsuperscript𝑐2\mathrm{\ MeV/{\mit c}^{2}} PDG . The position of the signal M=(1532.2±0.5)𝑀plus-or-minus1532.20.5M=(1532.2\pm 0.5) MeV/c2MeVsuperscript𝑐2\mathrm{\ MeV/{\mit c}^{2}} is in good agreement with the known value of the Ξ15300subscriptsuperscriptΞ01530\mathrm{\Xi^{0}_{1530}} mass, M=(1531.8±0.3)𝑀plus-or-minus1531.80.3M=(1531.8\pm 0.3) MeV/c2MeVsuperscript𝑐2\mathrm{\ MeV/{\mit c}^{2}} PDG . The mass resolution resulting from the fit in this mass region is σData=3.7subscript𝜎𝐷𝑎𝑡𝑎3.7\sigma_{Data}=3.7 MeV/c2MeVsuperscript𝑐2\mathrm{\ MeV/{\mit c}^{2}}, slightly higher than the value σMC=3.2subscript𝜎𝑀𝐶3.2\sigma_{MC}=3.2 MeV/c2MeVsuperscript𝑐2\mathrm{\ MeV/{\mit c}^{2}} obtained from a Monte Carlo simulation. The same 15% difference between measured and Monte Carlo mass resolutions was found for Λ0superscriptΛ0\mathrm{\Lambda^{0}}, ΞsuperscriptΞ\mathrm{\Xi^{-}} and ΩsuperscriptΩ\mathrm{\Omega^{-}} decays (see Tab. 1).

The ΞsuperscriptΞ\mathrm{\Xi^{-}}π+superscript𝜋\mathrm{\pi^{+}}πsuperscript𝜋\mathrm{\pi^{-}} mass distribution for all combinations of a Ξ15300subscriptsuperscriptΞ01530\mathrm{\Xi^{0}_{1530}} candidate with a negative particle from the interaction vertex is presented in Fig. 2. The left part of this figure shows the distribution for the range 0.1 <xF<absentsubscript𝑥𝐹absent<x_{F}<1. An enhancement at 1820 MeV/c2MeVsuperscript𝑐2\mathrm{\ MeV/{\mit c}^{2}} is visible. Fig. 2b is for xF>subscript𝑥𝐹absentx_{F}> 0.5. Here the signal at 1820 MeV/c2MeVsuperscript𝑐2\mathrm{\ MeV/{\mit c}^{2}} becomes much clearer and a second wider peak appears at about 1960 MeV/c2MeVsuperscript𝑐2\mathrm{\ MeV/{\mit c}^{2}}.

The subtraction of the background under the signals was done in the following way. We estimated the shape of the background distributions by “event mixing” Kop74 , combining the ΞsuperscriptΞ\mathrm{\Xi^{-}} from one event with all π+πsuperscript𝜋superscript𝜋\pi^{+}\pi^{-} pairs from another event. The true and the mixed distributions were normalized to each other in the mass range of 2.1-2.6 GeV/c2GeVsuperscript𝑐2\mathrm{\ GeV/{\mit c}^{2}}. The mixed distributions thus obtained are presented in the upper parts of Fig. 2 by open circles. In the lower panels of Fig. 2 we plot the ratios of the experimental mass distribution to this background distribution. Above 2100 MeV/c2MeVsuperscript𝑐2\mathrm{\ MeV/{\mit c}^{2}} the ratios are consistent with a constant value of one. The effective mass distributions of “wrong” sign combinations Ξπ+π+superscriptΞsuperscript𝜋superscript𝜋\Xi^{-}\pi^{+}\pi^{+} are indicated by the stars in the upper parts of Fig. 2. They show also no structure in the region of interest and - except for a normalization constant - their shapes are consistent with the mixed distributions.

The resulting mass and width of the Ξ1820subscriptsuperscriptΞ1820\Xi^{-}_{1820}  are M=(1817±3)𝑀plus-or-minus18173M=(1817\pm 3) MeV/c2MeVsuperscript𝑐2\mathrm{\ MeV/{\mit c}^{2}} and Γ=(23±13)Γplus-or-minus2313\Gamma=(23\pm 13) MeV/c2MeVsuperscript𝑐2\mathrm{\ MeV/{\mit c}^{2}}, where the quoted errors are the statistical errors of the fit. The apparatus resolution used was 1.153.4MeV/c23.91.153.4MeVsuperscript𝑐23.91.15\cdot 3.4\mathrm{\ MeV/{\mit c}^{2}}\approx 3.9 MeV/c2MeVsuperscript𝑐2\mathrm{\ MeV/{\mit c}^{2}} (see Tab. 1). These values are in good agreement with the world average values M=(1823±5)𝑀plus-or-minus18235M=(1823\pm 5) MeV/c2MeVsuperscript𝑐2\mathrm{\ MeV/{\mit c}^{2}} and Γ=2410+15Γsubscriptsuperscript241510\Gamma=24^{+15}_{-10} MeV/c2MeVsuperscript𝑐2\mathrm{\ MeV/{\mit c}^{2}} PDG .

The mass and width of the second peak are M=(1955±6)𝑀plus-or-minus19556M=(1955\pm 6) MeV/c2MeVsuperscript𝑐2\mathrm{\ MeV/{\mit c}^{2}} and Γ=(68±22)Γplus-or-minus6822\Gamma=(68\pm 22) MeV/c2MeVsuperscript𝑐2\mathrm{\ MeV/{\mit c}^{2}}, respectively. Also these values are in agreement with the average values from the earlier experiments, M=(1950±15)𝑀plus-or-minus195015M=(1950\pm 15) MeV/c2MeVsuperscript𝑐2\mathrm{\ MeV/{\mit c}^{2}} and Γ=(60±20)Γplus-or-minus6020\Gamma=(60\pm 20) MeV/c2MeVsuperscript𝑐2\mathrm{\ MeV/{\mit c}^{2}} PDG . It is, however, not clear whether this signal has its origin in one or several states since several ΞsuperscriptΞ\mathrm{\Xi^{*}} resonances were claimed to be observed in this mass region. In the following, we will treat the second peak as the decay of a single Ξ1950subscriptΞ1950\mathrm{\Xi_{1950}} state.

Refer to caption
Figure 3: dσ/dxF𝑑𝜎𝑑subscript𝑥𝐹d\sigma/dx_{F} [μ𝜇\mub] and dσ/dpt2𝑑𝜎𝑑subscriptsuperscript𝑝2𝑡d\sigma/dp^{2}_{t} [μ𝜇\mub/(GeV/c)2superscriptGeV𝑐2\mathrm{\ (GeV/{\mit c})^{2}}] of inclusive Ξ15300subscriptsuperscriptΞ01530\mathrm{\Xi^{0}_{1530}} production by ΣsuperscriptΣ\mathrm{\Sigma^{-}} in copper and carbon.
xFsubscript𝑥𝐹x_{F} Copper Carbon
0.00 - 0.15 6.62±0.65plus-or-minus6.620.656.62\pm 0.65 1.80±0.17plus-or-minus1.800.171.80\pm 0.17
0.15 - 0.30 7.18±0.36plus-or-minus7.180.367.18\pm 0.36 2.00±0.10plus-or-minus2.000.102.00\pm 0.10
0.30 - 0.45 6.56±0.34plus-or-minus6.560.346.56\pm 0.34 2.01±0.09plus-or-minus2.010.092.01\pm 0.09
0.45 - 0.60 4.54±0.24plus-or-minus4.540.244.54\pm 0.24 1.52±0.08plus-or-minus1.520.081.52\pm 0.08
0.60 - 0.75 2.24±0.16plus-or-minus2.240.162.24\pm 0.16 0.93±0.05plus-or-minus0.930.050.93\pm 0.05
0.75 - 0.90 1.46±0.12plus-or-minus1.460.121.46\pm 0.12 0.43±0.03plus-or-minus0.430.030.43\pm 0.03
Table 2: Differential cross section of Ξ15300subscriptsuperscriptΞ01530\mathrm{\Xi^{0}_{1530}} production by ΣsuperscriptΣ\mathrm{\Sigma^{-}} in copper and carbon as a function of xFsubscript𝑥𝐹x_{F} in mb.
pt2superscriptsubscript𝑝𝑡2p_{t}^{2} Copper Carbon
0.00 - 0.30 6.03±0.25plus-or-minus6.030.256.03\pm 0.25 1.79±0.07plus-or-minus1.790.071.79\pm 0.07
0.30 - 0.60 2.96±0.16plus-or-minus2.960.162.96\pm 0.16 1.02±0.05plus-or-minus1.020.051.02\pm 0.05
0.60 - 0.90 1.90±0.13plus-or-minus1.900.131.90\pm 0.13 0.59±0.04plus-or-minus0.590.040.59\pm 0.04
0.90 - 1.20 1.16±0.10plus-or-minus1.160.101.16\pm 0.10 0.37±0.03plus-or-minus0.370.030.37\pm 0.03
1.20 - 1.50 0.86±0.08plus-or-minus0.860.080.86\pm 0.08 0.28±0.03plus-or-minus0.280.030.28\pm 0.03
1.50 - 1.80 0.46±0.07plus-or-minus0.460.070.46\pm 0.07 0.17±0.02plus-or-minus0.170.020.17\pm 0.02
1.80 - 2.10 0.71±0.10plus-or-minus0.710.100.71\pm 0.10 0.13±0.02plus-or-minus0.130.020.13\pm 0.02
2.10 - 2.40 0.23±0.06plus-or-minus0.230.060.23\pm 0.06 -
Table 3: Differential cross section of Ξ15300subscriptsuperscriptΞ01530\mathrm{\Xi^{0}_{1530}} production by ΣsuperscriptΣ\mathrm{\Sigma^{-}} in copper and carbon as a function of pt2superscriptsubscript𝑝𝑡2p_{t}^{2} in mb/(GeV/cGeV𝑐\mathrm{GeV/{\mit c}})2.

5 ΞsuperscriptΞ\Xi^{*} production cross sections.

5.1 The Ξ15300subscriptsuperscriptΞ01530\mathrm{\Xi^{0}_{1530}} production cross section.

The differential cross section as a function of the Feynman variable xFsubscript𝑥𝐹x_{F} and the squared transverse momentum pt2superscriptsubscript𝑝𝑡2p_{t}^{2}, were calculated using the following formula:

σ(xF,pt2)=3/2BR(Λ0pπ)NΞ1530Mε(xF,pt2)NbρlNA.𝜎subscript𝑥𝐹superscriptsubscript𝑝𝑡232𝐵𝑅superscriptΛ0𝑝superscript𝜋subscript𝑁subscriptΞ1530𝑀𝜀subscript𝑥𝐹subscriptsuperscript𝑝2𝑡subscript𝑁𝑏𝜌𝑙subscript𝑁𝐴{\sigma(x_{F},p_{t}^{2})}={{3/2}\over{BR(\Lambda^{0}\rightarrow p\pi^{-})}}\cdot{{N_{\Xi_{1530}}M}\over\varepsilon(x_{F},p^{2}_{t})\ N_{b}\ \rho\ l\ N_{A}}. (1)

Here NΞ1530subscript𝑁subscriptΞ1530N_{\mathrm{\Xi_{1530}}} is the number of observed Ξ1530subscriptΞ1530\mathrm{\Xi_{1530}} in the particular region of the corresponding kinematical variables and ε𝜀\varepsilon denotes the overall acceptance including reconstruction and trigger efficiencies. Nbsubscript𝑁𝑏N_{b} is the number of incoming beam particles tagged as ΣsuperscriptΣ\mathrm{\Sigma^{-}}, corrected for beam contaminations (see below) and for losses due to the dead time of the trigger and the data acquisition system. M𝑀M, ρ𝜌\rho, l𝑙l are the atomic mass, the density and the length of the target, respectively; NAsubscript𝑁𝐴N_{A} denotes Avogadro’s number. The branching ratio of Ξ15300subscriptsuperscriptΞ01530\mathrm{\Xi^{0}_{1530}}\rightarrow ΞsuperscriptΞ\mathrm{\Xi^{-}} π+superscript𝜋\mathrm{\pi^{+}} decay is taken to be 2/3, as given by isospin conservation.

The ΞsuperscriptΞ\mathrm{\Xi^{-}} contamination of the tagged beam was measured to be (1.26 ±plus-or-minus\pm 0.07)% of the ΣsuperscriptΣ\mathrm{\Sigma^{-}} flux Ada97 . The production cross section of the Ξ15300subscriptsuperscriptΞ01530\mathrm{\Xi^{0}_{1530}} by ΞsuperscriptΞ\mathrm{\Xi^{-}} has been measured in a previous hyperon beam experiment Sch90 and the final values of our measurement were corrected for this contamination. Typically, this correction amounts to 6%.

About 12% of the tagged beam particles are fast πsuperscript𝜋\mathrm{\pi^{-}} Ada97 . The cross section of Ξ15300subscriptsuperscriptΞ01530\mathrm{\Xi^{0}_{1530}} production by pions has not been measured by any previous experiment. In contrast, the production cross section of ΞsuperscriptΞ\mathrm{\Xi^{-}} by pions has been measured in several experiments (see Ada97 and earlier references therein). From these measurements we derive a 2% contribution from pions to the ΞsuperscriptΞ\mathrm{\Xi^{-}} production in our beam. Assuming the same ratio to holds for Ξ15300subscriptsuperscriptΞ01530\mathrm{\Xi^{0}_{1530}} production, we subtracted this contribution from the final distributions.

The tagged beam also contains a KsuperscriptK\mathrm{K^{-}} contamination of 2.1%. The production cross section of Ξ15300subscriptsuperscriptΞ01530\mathrm{\Xi^{0}_{1530}} by KsuperscriptK\mathrm{K^{-}}, however, is known only below 16 GeV/cGeV𝑐\mathrm{GeV/{\mit c}} Bau81 . It decreases slowly in the interval 4.2 - 16 GeV/cGeV𝑐\mathrm{GeV/{\mit c}}. Adopting the maximum value of 43μb43𝜇𝑏43~{}\mu b as the production cross section at 345 GeV/cGeV𝑐\mathrm{GeV/{\mit c}} we conclude that at most 0.4% of the observed Ξ15300subscriptsuperscriptΞ01530\mathrm{\Xi^{0}_{1530}} yield can be attributed to the KsuperscriptK\mathrm{K^{-}} content of the beam, which is negligible.

The corrected differential production cross sections are shown in Fig.  3 and listed in tables 2 and 3 for copper and carbon targets, respectively. Only fit errors are quoted here. The cross sections were parameterized by a function of the form:

d2σdpt2dxF=C(1xF)nexp(bpt2),superscript𝑑2𝜎𝑑subscriptsuperscript𝑝2𝑡𝑑subscript𝑥𝐹𝐶superscript1subscript𝑥𝐹𝑛𝑒𝑥𝑝𝑏superscriptsubscript𝑝𝑡2\frac{d^{2}\sigma}{dp^{2}_{t}dx_{F}}=C(1-x_{F})^{n}\cdot exp(-bp_{t}^{2}), (2)

which is based on quark counting rules and phase space arguments Bla74 . The three parameters C𝐶C, n𝑛n, and b𝑏b were assumed to be independent of pt2superscriptsubscript𝑝𝑡2p_{t}^{2} and xFsubscript𝑥𝐹x_{F}. The values of n𝑛n and b𝑏b obtained from the fits are listed in Tab. 6 for each target, and the fits are shown in the figures as straight lines over the fit range. No significant difference is observed between the values obtained from the copper and the carbon target.

Fig. 4 shows the nuclear mass dependence of Ξ15300subscriptsuperscriptΞ01530\mathrm{\Xi^{0}_{1530}} production as a function of xFsubscript𝑥𝐹x_{F} (top) and pt2subscriptsuperscript𝑝2𝑡p^{2}_{t} (bottom). Also shown are the values observed for ΞsuperscriptΞ\mathrm{\Xi^{-}} production Ada97 . The left-hand scales give the cross section ratio:

R=σCuσCACACu𝑅subscript𝜎𝐶𝑢subscript𝜎𝐶subscript𝐴𝐶subscript𝐴𝐶𝑢{R=\frac{\sigma_{Cu}}{\sigma_{C}}\cdot\frac{A_{C}}{A_{Cu}}} (3)

The right-hand scales shows the corresponding values of α𝛼\alpha in the conventional parametrization for the A dependence:

σ=σ0Aα𝜎subscript𝜎0superscript𝐴𝛼\sigma={\sigma}_{0}\cdot A^{\alpha} (4)

The dashed lines correspond to α𝛼\alpha=2/3 and α𝛼\alpha=1.

The values for ΞsuperscriptΞ\mathrm{\Xi^{-}} and Ξ15300subscriptsuperscriptΞ01530\mathrm{\Xi^{0}_{1530}} production are very similar to each other and to those observed in other hadroproduction processes which can be summarized as α(xF)=0.80.75xF+0.45xF2𝛼subscript𝑥𝐹0.80.75subscript𝑥𝐹0.45superscriptsubscript𝑥𝐹2\alpha(x_{F})=0.8-0.75x_{F}+0.45x_{F}^{2} Gei91 (solid line in the upper part of Fig. 4). There is no visible dependence of α𝛼\alpha on pt2subscriptsuperscript𝑝2𝑡p^{2}_{t}.

xFsubscript𝑥𝐹x_{F} Ξ1820subscriptsuperscriptΞ1820\mathrm{\Xi^{-}_{1820}} Ξ1950subscriptsuperscriptΞ1950\mathrm{\Xi^{-}_{1950}}
0.10 - 0.25 30.6±10.8plus-or-minus30.610.830.6\pm 10.8 -
0.25 - 0.40 34.7±7.4plus-or-minus34.77.434.7\pm 7.4 13.8±5.8plus-or-minus13.85.813.8\pm 5.8
0.40 - 0.55 21.4±6.4plus-or-minus21.46.421.4\pm 6.4 4.6±5.2plus-or-minus4.65.24.6\pm 5.2
0.55 - 0.70 15.4±5.1plus-or-minus15.45.115.4\pm 5.1 19.9±5.8plus-or-minus19.95.819.9\pm 5.8
0.70 - 0.85 17.7±3.9plus-or-minus17.73.917.7\pm 3.9 26.2±4.5plus-or-minus26.24.526.2\pm 4.5
0.85 - 1.00 16.9±2.8plus-or-minus16.92.816.9\pm 2.8 16.5±2.8plus-or-minus16.52.816.5\pm 2.8
Table 4: BRdσ/dxFabsent𝑑𝜎𝑑subscript𝑥𝐹\cdot d\sigma/dx_{F} per nucleon [μ𝜇\mub] of inclusive ΞsuperscriptΞ\mathrm{\Xi^{*}} production by ΣsuperscriptΣ\mathrm{\Sigma^{-}}.
pt2superscriptsubscript𝑝𝑡2p_{t}^{2} Ξ1820subscriptsuperscriptΞ1820\mathrm{\Xi^{-}_{1820}} Ξ1950subscriptsuperscriptΞ1950\mathrm{\Xi^{-}_{1950}}
0.00 - 0.30 16.7±4.9plus-or-minus16.74.916.7\pm 4.9 8.1±4.6plus-or-minus8.14.68.1\pm 4.6
0.30 - 0.60 12.4±3.8plus-or-minus12.43.812.4\pm 3.8 6.7±3.7plus-or-minus6.73.76.7\pm 3.7
0.60 - 0.90 14.2±3.6plus-or-minus14.23.614.2\pm 3.6 10.9±3.1plus-or-minus10.93.110.9\pm 3.1
0.90 - 1.20 9.6±2.9plus-or-minus9.62.99.6\pm 2.9 8.6±2.5plus-or-minus8.62.58.6\pm 2.5
1.20 - 1.50 11.4±2.5plus-or-minus11.42.511.4\pm 2.5 6.5±1.9plus-or-minus6.51.96.5\pm 1.9
1.50 - 1.80 4.3±2.2plus-or-minus4.32.24.3\pm 2.2 4.4±2.1plus-or-minus4.42.14.4\pm 2.1
1.80 - 2.10 4.2±1.4plus-or-minus4.21.44.2\pm 1.4 3.8±1.6plus-or-minus3.81.63.8\pm 1.6
2.10 - 2.40 3.6±1.7plus-or-minus3.61.73.6\pm 1.7 2.7±0.9plus-or-minus2.70.92.7\pm 0.9
Table 5: BRdσ/dpt2absent𝑑𝜎𝑑subscriptsuperscript𝑝2𝑡\cdot d\sigma/dp^{2}_{t} per nucleon [μ𝜇\mub/(GeV/c)2superscriptGeV𝑐2\mathrm{\ (GeV/{\mit c})^{2}}] of inclusive ΞsuperscriptΞ\mathrm{\Xi^{*}} production by ΣsuperscriptΣ\mathrm{\Sigma^{-}}.
Refer to caption
Figure 4: Normalized ratio R𝑅R of the copper and carbon cross section (see Eqn. 3) for Ξ15300subscriptsuperscriptΞ01530\mathrm{\Xi^{0}_{1530}} (dots) and Ξ1320subscriptsuperscriptΞ1320\mathrm{\Xi^{-}_{1320}} (open squares, ref. Ada97 ) production by ΣsuperscriptΣ\mathrm{\Sigma^{-}} as a function of xFsubscript𝑥𝐹x_{F} (top) and pt2subscriptsuperscript𝑝2𝑡p^{2}_{t} (bottom). The right scale indicates the exponent α𝛼\alpha in case of an Aαsuperscript𝐴𝛼A^{\alpha} dependence. The solid line in the upper part marks a polynomial fit to a compilation of target attenuation factors given in ref. Gei91 .

The total production cross sections per nucleus for copper and carbon are listed in Tab. 6. The quoted errors include an overall systematic error stemming from uncertainties of the efficiency determination (15%), the trigger simulation (10%) and the corrections for beam contaminations (7%). Adding the systematic errors quadratically we estimated the total systematic error to be 20% .

The total production cross section per nucleon for xFsubscript𝑥𝐹x_{F} >> 0 was obtained by extrapolating the differential cross sections measured on Cu and C in each bin of xFsubscript𝑥𝐹x_{F} using the values of α𝛼\alpha obtained in the same bin. The result is σ=(218±44)μb𝜎plus-or-minus21844𝜇𝑏\sigma=(218\pm 44)~{}\mu b, where the error is dominated by the systematic error quoted above.

Particle # events σ𝜎\sigma [mb] σ𝜎\sigma [μ𝜇\mub] n𝑛n b𝑏b
per nucleus per nucleon (GeV/cGeV𝑐\mathrm{GeV/{\mit c}})-2
Ξ1320subscriptsuperscriptΞ1320\mathrm{\Xi^{-}_{1320}} 1000±40plus-or-minus1000401000\pm 40
copper 16.72±0.21plus-or-minus16.720.2116.72\pm 0.21 1.97±0.04plus-or-minus1.970.041.97\pm 0.04 1.90±limit-from1.90plus-or-minus1.90\pm0.04
carbon 5.40±0.07plus-or-minus5.400.075.40\pm 0.07 2.08±0.04plus-or-minus2.080.042.08\pm 0.04 2.00±limit-from2.00plus-or-minus2.00\pm0.04
Ξ15300subscriptsuperscriptΞ01530\mathrm{\Xi^{0}_{1530}} 218±44plus-or-minus21844218\pm 44
copper 9333±171plus-or-minus93331719333\pm 171 4.3±0.9plus-or-minus4.30.94.3\pm 0.9 1.32±0.08plus-or-minus1.320.081.32\pm 0.08 1.63±limit-from1.63plus-or-minus1.63\pm0.06
carbon 9547±157plus-or-minus95471579547\pm 157 1.30±0.26plus-or-minus1.300.261.30\pm 0.26 1.21±0.07plus-or-minus1.210.071.21\pm 0.07 1.62±limit-from1.62plus-or-minus1.62\pm0.06
σ\sigma\cdotBR
Ξ1820subscriptsuperscriptΞ1820\mathrm{\Xi^{-}_{1820}} 1045±116plus-or-minus10451161045\pm 116 21±5plus-or-minus21521\pm 5 0.2±0.1plus-or-minus0.20.10.2\pm 0.1 0.8±limit-from0.8plus-or-minus0.8\pm0.20
Ξ1950subscriptsuperscriptΞ1950\mathrm{\Xi^{-}_{1950}} 872±137plus-or-minus872137872\pm 137 12±3plus-or-minus12312\pm 3 0.1±0.1plus-or-minus0.10.1-0.1\pm 0.1 0.7±limit-from0.7plus-or-minus0.7\pm0.25
Table 6: Number of reconstructed events and total inclusive ΞsuperscriptΞ\mathrm{\Xi^{*}} production cross sections per nucleus and nucleon. n𝑛n and b𝑏b are the fit parameters of the differential cross sections with their fit errors (see text). The data for Ξ1320subscriptsuperscriptΞ1320\mathrm{\Xi^{-}_{1320}} were taken from Ref. Ada97 .
Refer to caption
Figure 5: Differential cross sections times branching ratio per nucleon of inclusive Ξ1820subscriptsuperscriptΞ1820\mathrm{\Xi^{-}_{1820}} and Ξ1950subscriptsuperscriptΞ1950\mathrm{\Xi^{-}_{1950}} production by ΣsuperscriptΣ\mathrm{\Sigma^{-}}. The lines represent fits to the data according to Eqn. 2

5.2 The Ξ1820subscriptsuperscriptΞ1820\mathrm{\Xi^{-}_{1820}} and Ξ1950subscriptsuperscriptΞ1950\mathrm{\Xi^{-}_{1950}} production cross sections.

The statistics of the observed Ξ1820subscriptsuperscriptΞ1820\mathrm{\Xi^{-}_{1820}} and Ξ1950subscriptsuperscriptΞ1950\mathrm{\Xi^{-}_{1950}} signals is not sufficient to measure the cross section for each target separately. We therefore assume that the inclusive production of these states has the same nuclear dependence as inclusive ΞsuperscriptΞ\mathrm{\Xi^{-}} and Ξ15300subscriptsuperscriptΞ01530\mathrm{\Xi^{0}_{1530}} production, and analyze the data from the copper and carbon targets together. The differential cross sections are again parameterized by Eqn. 2.

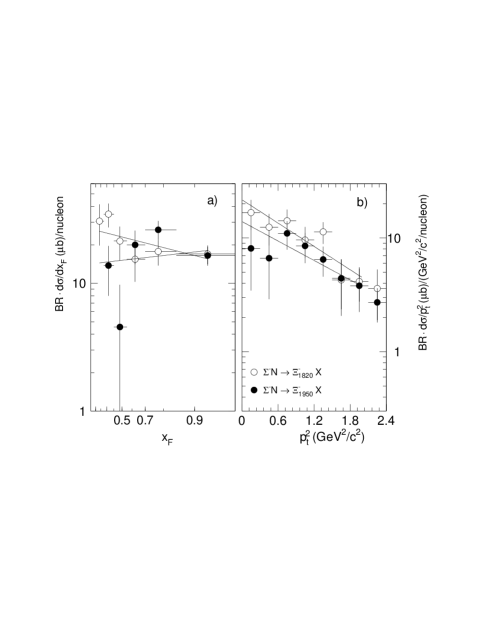
Fig. 5 shows the differential cross section per nucleon multiplied by the branching ratio as a function of xFsubscript𝑥𝐹x_{F} and pt2superscriptsubscript𝑝𝑡2p_{t}^{2}. Only statistical errors are shown. The corresponding numbers are listed in tables 4 and 5. The inclusive production cross section per nucleon, σBR𝜎𝐵𝑅\sigma\cdot BR and the values of the fit parameters n𝑛n and b𝑏b are listed in Tab. 6. There are no experimental data on Ξ1820subscriptΞ1820\mathrm{\Xi_{1820}} or Ξ1950subscriptΞ1950\mathrm{\Xi_{1950}} production by ΞsuperscriptΞ\mathrm{\Xi^{-}}, KsuperscriptK\mathrm{K^{-}} or πsuperscript𝜋\mathrm{\pi^{-}}. Since, however, the correction to the total Ξ15300subscriptsuperscriptΞ01530\mathrm{\Xi^{0}_{1530}} production cross section from the beam contaminations amounts to 7% only, we neglect this correction here. A 7% error from the uncertainties of this correction is included in the total systematic error of 20%.

5.3 The Ξ16900subscriptsuperscriptΞ01690\mathrm{\Xi^{0}_{1690}} production cross section.

In a previous publication Ada98 we reported a measurement of σBR𝜎𝐵𝑅\sigma\cdot BR for Ξ16900subscriptsuperscriptΞ01690\mathrm{\Xi^{0}_{1690}}\to ΞsuperscriptΞ\mathrm{\Xi^{-}}π+superscript𝜋\mathrm{\pi^{+}} production relative to Ξ15300subscriptsuperscriptΞ01530\mathrm{\Xi^{0}_{1530}} production of

σBR(Ξ16900Ξπ+)σBR(Ξ15300Ξπ+)=0.022±0.005.𝜎𝐵𝑅subscriptsuperscriptΞ01690superscriptΞsuperscript𝜋𝜎𝐵𝑅subscriptsuperscriptΞ01530superscriptΞsuperscript𝜋plus-or-minus0.0220.005\frac{\sigma\cdot BR(\mathrm{\Xi^{0}_{1690}}\rightarrow\mathrm{\Xi^{-}}\mathrm{\pi^{+}})}{\sigma\cdot BR(\mathrm{\Xi^{0}_{1530}}\rightarrow\mathrm{\Xi^{-}}\mathrm{\pi^{+}})}=0.022\pm 0.005.

This value corresponds to the observed kinematic range, 0.1 << xFsubscript𝑥𝐹x_{F} << 1, and was extracted by assuming equal xFsubscript𝑥𝐹x_{F} and ptsubscript𝑝𝑡p_{t} dependence of Ξ16900subscriptsuperscriptΞ01690\mathrm{\Xi^{0}_{1690}} and Ξ15300subscriptsuperscriptΞ01530\mathrm{\Xi^{0}_{1530}} production. With our present results we are now able to estimate a possible systematic variation of the production cross section by calculating the ratio of the detection efficiencies of the two states for three different xFsubscript𝑥𝐹x_{F} and pt2superscriptsubscript𝑝𝑡2p_{t}^{2} dependencies of the Ξ16900subscriptsuperscriptΞ01690\mathrm{\Xi^{0}_{1690}} production cross section, using the measured differential production spectra of the Ξ15300subscriptsuperscriptΞ01530\mathrm{\Xi^{0}_{1530}}, Ξ1820subscriptsuperscriptΞ1820\mathrm{\Xi^{-}_{1820}} and Ξ1950subscriptsuperscriptΞ1950\mathrm{\Xi^{-}_{1950}}. The values of the parameters n𝑛n and b𝑏b used in the MC calculation were taken from Tab. 6.

The resulting inclusive production cross section multiplied by the branching ratio is shown in Tab. 7. The quoted values are for the kinematical range 0 << xFsubscript𝑥𝐹x_{F} << 1, the errors are statistical only. The total systematic error on the scale of the cross sections was estimated to be about 25%. The values obtained range from 2.5 to 6.8 μ𝜇\mub.

6 Discussion

In our experiment we observed four excited ΞΞ\mathrm{\Xi} hyperons under the same conditions, which gives us a unique possibility to compare their production spectra.

In Fig. 6 we show the invariant cross sections for the observed signals including the ground state ΞsuperscriptΞ\mathrm{\Xi^{-}}Ada97 . For the Ξ1820subscriptsuperscriptΞ1820\mathrm{\Xi^{-}_{1820}} and Ξ1950subscriptsuperscriptΞ1950\mathrm{\Xi^{-}_{1950}}  the values plotted are the cross sections multiplied with the branching ratio to Ξ15300subscriptsuperscriptΞ01530\mathrm{\Xi^{0}_{1530}}πsuperscript𝜋\mathrm{\pi^{-}}. A strong leading particle effect is seen for the ΞΞ\mathrm{\Xi} states produced. The comparison of the xFsubscript𝑥𝐹x_{F} behaviour of the cross sections shows that the octet and decuplet ground states ΞsuperscriptΞ\mathrm{\Xi^{-}} and Ξ15300subscriptsuperscriptΞ01530\mathrm{\Xi^{0}_{1530}} are produced with similar xFsubscript𝑥𝐹x_{F} spectra, with the Ξ15300subscriptsuperscriptΞ01530\mathrm{\Xi^{0}_{1530}} cross section being smaller by a factor of about 5. The xFsubscript𝑥𝐹x_{F} spectra of the excited states Ξ1820subscriptsuperscriptΞ1820\mathrm{\Xi^{-}_{1820}} and Ξ1950subscriptsuperscriptΞ1950\mathrm{\Xi^{-}_{1950}} are significantly harder (see Tab. 6). This nicely illustrates that simple quark counting rules which reflect only the quark flavour contents of the involved baryons (see e.g. Bla74 ) are not able to describe the hyperon production.

The pt2superscriptsubscript𝑝𝑡2p_{t}^{2} spectra of the Ξ15300subscriptsuperscriptΞ01530\mathrm{\Xi^{0}_{1530}} shown on the right-hand side of Fig. 3 have an exponential shape throughout the observed kinematical range 0 <pt2<absentsubscriptsuperscript𝑝2𝑡absent<p^{2}_{t}< 2.4 (GeV/c)2superscriptGeV𝑐2\mathrm{\ (GeV/{\mit c})^{2}}, with slope parameters b𝑏absentb\approx 1.6 (GeV/c)2superscriptGeV𝑐2\mathrm{\ (GeV/{\mit c})^{-2}}. The pt2superscriptsubscript𝑝𝑡2p_{t}^{2} spectrum of the ΞsuperscriptΞ\mathrm{\Xi^{-}} has a similar slope with b𝑏absentb\approx 2.0 (GeV/c)2superscriptGeV𝑐2\mathrm{\ (GeV/{\mit c})^{-2}} in the range 0 <pt2<absentsubscriptsuperscript𝑝2𝑡absent<p^{2}_{t}< 1.0 (GeV/c)2superscriptGeV𝑐2\mathrm{\ (GeV/{\mit c})^{2}}, but a much harder pt2superscriptsubscript𝑝𝑡2p_{t}^{2} spectrum above 1 (GeV/c)2superscriptGeV𝑐2\mathrm{\ (GeV/{\mit c})^{2}} corresponding to b𝑏absentb\approx 0.6 (GeV/c)2superscriptGeV𝑐2\mathrm{\ (GeV/{\mit c})^{-2}} (see Fig. 5 of Ada97 ). Also the pt2superscriptsubscript𝑝𝑡2p_{t}^{2} spectra of the Ξ1820subscriptsuperscriptΞ1820\mathrm{\Xi^{-}_{1820}} and Ξ1950subscriptsuperscriptΞ1950\mathrm{\Xi^{-}_{1950}} shown in Fig. 5 are much harder than that of the Ξ15300subscriptsuperscriptΞ01530\mathrm{\Xi^{0}_{1530}} or the soft part of the ΞsuperscriptΞ\mathrm{\Xi^{-}} spectrum. The slope parameters b𝑏b = (0.8±plus-or-minus\pm0.2) (GeV/c)2superscriptGeV𝑐2\mathrm{\ (GeV/{\mit c})^{-2}} for the Ξ1820subscriptsuperscriptΞ1820\mathrm{\Xi^{-}_{1820}} and b𝑏b = (0.7±plus-or-minus\pm0.25) (GeV/c)2superscriptGeV𝑐2\mathrm{\ (GeV/{\mit c})^{-2}} for the Ξ1950subscriptsuperscriptΞ1950\mathrm{\Xi^{-}_{1950}} are close to the slope of the ΞsuperscriptΞ\mathrm{\Xi^{-}} distribution above 1 (GeV/c)2superscriptGeV𝑐2\mathrm{\ (GeV/{\mit c})^{2}}.

Considering this agreement one may speculate whether decays of high lying ΞsuperscriptΞ\mathrm{\Xi^{*}} resonances may contribute to the high-ptsubscript𝑝𝑡p_{t} tail of the ΞsuperscriptΞ\mathrm{\Xi^{-}} hyperons. However, taking the decrease of the hyperon mass during the decay chain into account, the apparent slope parameter b𝑏b for the sequentially produced ΞsuperscriptΞ\mathrm{\Xi^{-}} will increase by typically a factor of (1820/1320)22superscript1820132022(1820/1320)^{2}\approx 2 to a value of about 1.5 (GeV/c)2superscriptGeV𝑐2\mathrm{\ (GeV/{\mit c})^{-2}} . Furthermore, the two-step decays

Ξ1820,1950Ξ15300πΞπ+πsubscriptsuperscriptΞ18201950subscriptsuperscriptΞ01530superscript𝜋superscriptΞsuperscript𝜋superscript𝜋\mathrm{\Xi^{-}_{1820,1950}}\rightarrow\mathrm{\Xi^{0}_{1530}}\mathrm{\pi^{-}}\rightarrow\mathrm{\Xi^{-}}\mathrm{\pi^{+}}\mathrm{\pi^{-}} (5)

contribute not more than 3% to the yield of ΞsuperscriptΞ\mathrm{\Xi^{-}} hyperons at large pt2>superscriptsubscript𝑝𝑡2absentp_{t}^{2}>(GeV/c)2superscriptGeV𝑐2\mathrm{\ (GeV/{\mit c})^{2}}. The alternative decay chain Ξ1820,1950subscriptsuperscriptΞ18201950\mathrm{\Xi^{-}_{1820,1950}} \rightarrow Ξ1530subscriptsuperscriptΞ1530\mathrm{\Xi^{-}_{1530}}π0superscript𝜋0\mathrm{\pi^{0}}\rightarrow ΞsuperscriptΞ\mathrm{\Xi^{-}}π0superscript𝜋0\mathrm{\pi^{0}}π0superscript𝜋0\mathrm{\pi^{0}} increases this yield by an additional factor 5/4545/4. In Ref. Aps70 the ratio

R=Ξ1820,1950Ξπ+ΞππΞ1820,1950Ξ1530π𝑅subscriptΞ18201950Ξ𝜋Ξ𝜋𝜋subscriptΞ18201950subscriptΞ1530𝜋R=\frac{\mathrm{\Xi_{1820,1950}}\rightarrow\mathrm{\Xi}\mathrm{\pi}+\mathrm{\Xi}\mathrm{\pi}\mathrm{\pi}}{\mathrm{\Xi_{1820,1950}}\rightarrow\mathrm{\Xi_{1530}}\mathrm{\pi}} (6)

is estimated to be 1.51.51.5 and 2.82.82.8 for Ξ1820subscriptΞ1820\mathrm{\Xi_{1820}} and Ξ1950subscriptΞ1950\mathrm{\Xi_{1950}} decays, respectively. However, according to later observations Gay76 which are also consistent with earlier studies Ali69 , the contribution via non-resonant decays Ξ1820subscriptsuperscriptΞ1820\mathrm{\Xi^{-}_{1820}}\rightarrow ΞsuperscriptΞ\mathrm{\Xi^{-}}π0superscript𝜋0\mathrm{\pi^{0}} are a factor of 3 lower than the yield resulting from the resonant decay chain given in Eqn. 5. Therefore, we take the values from Ref. Aps70 as an upper limit and estimate that at most 10 % of the observed ΞsuperscriptΞ\mathrm{\Xi^{-}} hyperons at high ptsubscript𝑝𝑡p_{t} are decay products of negative Ξ1820subscriptsuperscriptΞ1820\mathrm{\Xi^{-}_{1820}} or Ξ1950subscriptsuperscriptΞ1950\mathrm{\Xi^{-}_{1950}} resonances. On the other hand, neglecting any non-resonant decays we obtain a lower limit of about 4%. Of course additional higher lying ΞsuperscriptΞabsent\mathrm{\Xi^{-*}} states and particularly neutral ΞΞ\mathrm{\Xi}’s will add further contributions. Nonetheless, both the relatively low yield and the expected increase of the slope parameter b𝑏b in sequential decays make it rather unlikely that sequential decays of high-lying ΞsuperscriptΞ\mathrm{\Xi^{*}} resonances are the main origin of the high-ptsubscript𝑝𝑡p_{t} tail of the ΞsuperscriptΞ\mathrm{\Xi^{-}} spectrum.

Refer to caption
Figure 6: Invariant cross sections per nucleon of inclusive ΞsuperscriptΞ\mathrm{\Xi^{-}} and ΞsuperscriptΞ\mathrm{\Xi^{*}}production by ΣsuperscriptΣ\mathrm{\Sigma^{-}}.
xFsubscript𝑥𝐹x_{F} spectrum Cross section
as for per nucleon [μ𝜇\mub]
Ξ15300subscriptsuperscriptΞ01530\mathrm{\Xi^{0}_{1530}} 2.5±0.1plus-or-minus2.50.12.5\pm 0.1
Ξ1820subscriptsuperscriptΞ1820\mathrm{\Xi^{-}_{1820}} 5.6±0.2plus-or-minus5.60.25.6\pm 0.2
Ξ1950subscriptsuperscriptΞ1950\mathrm{\Xi^{-}_{1950}} 6.8±0.2plus-or-minus6.80.26.8\pm 0.2
Table 7: σ\sigma\cdotBR per nucleon of inclusive Ξ16900subscriptsuperscriptΞ01690\mathrm{\Xi^{0}_{1690}} production for different hypotheses about the xFsubscript𝑥𝐹x_{F} spectrum.

The large background under the Ξ16900subscriptsuperscriptΞ01690\mathrm{\Xi^{0}_{1690}} signal does not allow the xFsubscript𝑥𝐹x_{F} and ptsubscript𝑝𝑡p_{t} spectra to be measured. We expect the observed decay channel ΞsuperscriptΞ\mathrm{\Xi^{-}}π+superscript𝜋\mathrm{\pi^{+}} to be the main decay channel, since the only other possible decay channels, ΛK¯Λ¯𝐾\mathrm{\Lambda}\overline{K} and Ξ15300subscriptsuperscriptΞ01530\mathrm{\Xi^{0}_{1530}}π0superscript𝜋0\mathrm{\pi^{0}}, have thresholds of 1613 and 1667 MeV/c2MeVsuperscript𝑐2\mathrm{\ MeV/{\mit c}^{2}} respectively, and therefore a much smaller phase space than the ΞsuperscriptΞ\mathrm{\Xi^{-}}π+superscript𝜋\mathrm{\pi^{+}} channel with its threshold at 1462 MeV/c2MeVsuperscript𝑐2\mathrm{\ MeV/{\mit c}^{2}}. Thus we expect the production cross section to be 2–10 μb𝜇𝑏\mu b per nucleon in the range 0 << xFsubscript𝑥𝐹x_{F} << 1, a factor of 20 or more below the corresponding Ξ15300subscriptsuperscriptΞ01530\mathrm{\Xi^{0}_{1530}} cross section.

There is only one publication about the branching ratio of Ξ1820subscriptsuperscriptΞ1820\mathrm{\Xi^{-}_{1820}}\to Ξ1530subscriptΞ1530\mathrm{\Xi_{1530}}π𝜋\mathrm{\pi} decay, giving a value 0.3 ±plus-or-minus\pm 0.15 Ali69 . This yields about (70 ±plus-or-minus\pm 35) μb𝜇𝑏\mu b per nucleon for inclusive Ξ1820subscriptsuperscriptΞ1820\mathrm{\Xi^{-}_{1820}} production, which is about a factor of three below the Ξ15300subscriptsuperscriptΞ01530\mathrm{\Xi^{0}_{1530}} cross section. Nothing is known about the Ξ1950subscriptsuperscriptΞ1950\mathrm{\Xi^{-}_{1950}} decay branching ratios. The measured value of σBR=(12±3)μb𝜎𝐵𝑅plus-or-minus123𝜇𝑏\sigma\cdot BR=(12\pm 3)~{}\mu b for Ξ1950subscriptsuperscriptΞ1950\mathrm{\Xi^{-}_{1950}} production is smaller by a factor of 2 than the corresponding value σBR=(21±5)μb𝜎𝐵𝑅plus-or-minus215𝜇𝑏\sigma\cdot BR=(21\pm 5)~{}\mu b for Ξ1820subscriptsuperscriptΞ1820\mathrm{\Xi^{-}_{1820}} production.

In Fig. 7 we compare our experimental results with theoretical calculations based on PYTHIA PYTHIA and the Quark-Gluon String Model (QGSM, see QGSM and references therein).

We have used PYTHIA with its default set of parameters, and made no effort to adjust them to better fit the experimental data (for reasons to be explained later). Among the essential details, we only mention the inclusion of elastic and diffraction processes (PYTHIA option MSEL=2) and the usage of the Lund string fragmentation algorithm. The latter is closer to the QGSM ideology than ‘independent’ or ‘cluster’ fragmentation. The striking difference between the calculated cross sections, σΣΞsubscript𝜎ΣΞ\sigma_{\mathrm{\Sigma}\to\mathrm{\Xi}} versus σnΞsubscript𝜎nΞ\sigma_{{\mathrm{n}}\to\mathrm{\Xi}} and σπΞsubscript𝜎𝜋Ξ\sigma_{\mathrm{\pi}\to\mathrm{\Xi}}, is due to the hierarchy of probabilities that PYTHIA attributes to the various species of quarks and diquarks appearing from the colour string fragmentation. The creation of a doubly strange diquark ss𝑠𝑠ss (which is necessary to produce ΞΞ\mathrm{\Xi}’s from π𝜋\mathrm{\pi} or nn{\mathrm{n}}) is suppressed relative to the creation of a single strange quark (which is sufficient to form a ΞΞ\mathrm{\Xi} from a ΣΣ\mathrm{\Sigma}) by a factor of 30. Such a suppression is also responsible for the relatively low abundance of ΞΞ\mathrm{\Xi} at xFsubscript𝑥𝐹x_{F} 0similar-to-or-equalsabsent0\simeq 0 in the case of ΣΣ\mathrm{\Sigma} beams.

Refer to caption
Figure 7: Comparison of differential cross sections of inclusive ΞΞ\mathrm{\Xi} hyperons production with PYTHIA(-\cdot-\cdot) and QGSM(---) predictions. The QGSM cross sections for excited ΞΞ\mathrm{\Xi}’s were normalized to measured value. The solid lines represent the fit to the data according to Eqn. 2.

Changing PYTHIA’s default parameters in order to reach agreement with the data presented here, one would lose the consistency with other experimental results. For example reducing the suppression of doubly strange diquarks with respect to singly strange and non-strange diquarks one would no longer reproduce the cross section ratios observed in Ξ/Λ/pΞΛ𝑝\Xi/\Lambda/p inclusive production by protons Bou80 . A suppression of all diquarks with respect to single quarks would deteriorate the baryon to meson multiplicity ratios MARK ; Blob . Reducing the probability of single strange quark creation would cause difficulties with K/π𝜋\mathrm{\pi} and ΛΛ\mathrm{\Lambda}/pp{\mathrm{p}} ratios in the proton Blob and pion Bre82 beams.

The Quark-Gluon String Model offers two free parameters (for each isotopic family) that are the absolute probabilities to form the final state baryon via different fragmentation mechanisms. The baryon may be produced either directly from the beam diquark, or indirectly, in a remote part of the colour string (this includes quark, antiquark and antidiquark fragmentation cases). Although the absolute normalization of these two contributions is arbitrary, their xFsubscript𝑥𝐹x_{F} behaviour is strictly defined in the model. We have used the normalization freedom to tune the model to the Ξ1320subscriptΞ1320\mathrm{\Xi_{1320}} production in ΣsuperscriptΣ\mathrm{\Sigma^{-}} induced reactions on carbon.

However, the QGSM predicts a stronger leading particle effect in the production of ΞΞ\mathrm{\Xi} hyperons by neutrons than observed experimentally Ada97 . This discrepancy has its origin in the so called ‘baryon junction’ which is introduced in the QGSM. The junction is considered to be as important for the baryon colour structure as the valence quarks themselves. The transmission of a junction from the projectile to a final state baryon creates a strong ‘leading particle effect’ even for a neutron beam, though neutrons have only a single quark in common with ΞΞ\mathrm{\Xi} hyperons.

With respect to the production of excited hyperon resonances, we have extended the original QGSM version by introducing a new assumption that the fragmentation into an excited state proceeds by an exchange of a shifted Regge trajectory (e.g., ΔΔ\Delta or Nsuperscript𝑁N^{*}) rather than by the ordinary nucleon trajectory. Then, the fragmentation functions acquire an extra factor, thus shifting in the same sense the xFsubscript𝑥𝐹x_{F} spectra. The absolute normalization of the production cross section still remains a free parameter that cannot be calculated within the theory. With the modification mentioned, the model appears to reproduce qualitatively the different shapes of the observed distributions.

To summarize we have studied the production of several ΞsuperscriptΞ\mathrm{\Xi^{*}} resonances in ΣsuperscriptΣ\mathrm{\Sigma^{-}} - nucleus collisions at 345 GeV/cGeV𝑐\mathrm{GeV/{\mit c}} . The cross section for inclusive Ξ15300subscriptsuperscriptΞ01530\mathrm{\Xi^{0}_{1530}} production is about a factor of 5 below that of Ξ1320subscriptsuperscriptΞ1320\mathrm{\Xi^{-}_{1320}} hyperons. The products of cross section and branching ratio for the observed channels Ξ16900subscriptsuperscriptΞ01690\mathrm{\Xi^{0}_{1690}} \to ΞsuperscriptΞ\mathrm{\Xi^{-}}π+superscript𝜋\mathrm{\pi^{+}}, Ξ1820subscriptsuperscriptΞ1820\mathrm{\Xi^{-}_{1820}} \to Ξ15300subscriptsuperscriptΞ01530\mathrm{\Xi^{0}_{1530}}πsuperscript𝜋\mathrm{\pi^{-}}and Ξ1950subscriptsuperscriptΞ1950\mathrm{\Xi^{-}_{1950}} \to Ξ15300subscriptsuperscriptΞ01530\mathrm{\Xi^{0}_{1530}}πsuperscript𝜋\mathrm{\pi^{-}} are lower by yet another order of magnitude. The Ξ1820subscriptsuperscriptΞ1820\mathrm{\Xi^{-}_{1820}} and Ξ1950subscriptsuperscriptΞ1950\mathrm{\Xi^{-}_{1950}} resonances show significantly harder xFsubscript𝑥𝐹x_{F} and ptsubscript𝑝𝑡p_{t} distributions than ΞsuperscriptΞ\mathrm{\Xi^{-}} and Ξ15300subscriptsuperscriptΞ01530\mathrm{\Xi^{0}_{1530}} hyperons. A comparison of the measured xFsubscript𝑥𝐹x_{F} distributions to PYTHIA and QGSM predictions provides only a partial agreement.

Acknowledgements

It is a pleasure to thank J. Zimmer and G. Konorova for their support in setting up and running the experiment. We are also indebted to the staff of the CERN Omega spectrometer group for their help and support, to the CERN EBS group for their work on the hyperon beam line and to the CERN accelerator group for their continuous efforts to provide good and stable beam conditions. We thank S. Brodsky, B. Kopeliovich and O. Piskounova for helpful discussions.

References

  • (1) J. Badier et al., Phys. Rev. Lett. 39B, 414 (1972).
  • (2) V. Hungerbühler et al., Phys. Rev. D12, 1203 (1975).
  • (3) M. Bourquin et al., Nucl. Phys. B153, 13 (1979).
  • (4) M. Bourquin et al., Z. Phys. C5, 275 (1980).
  • (5) S.F. Biagi et al., Z. Phys. C9, 305 (1981).
  • (6) T.R. Cardello et al., Phys. Rev. D32, 1 (1985).
  • (7) S.F.Biagi et al., Z. Phys. C34, 187 (1987).
  • (8) BIS-2 Collaboration, A.N. Aleev et al., Sov. J. Nucl. Phys. 44, 429 (1986).
  • (9) M.I. Adamovich et al., Z. Phys. C76, 35 (1997).
  • (10) S.F.Biagi et al., Z. Phys.C31, 33 (1986).
  • (11) O.Schneider et al., Z. Phys. C46, 341 (1990).
  • (12) T. Tashiro, H. Noda, K. Kinoshita, Z. Phys. C39, 499 (1988).
  • (13) A. Dumitru, S.A. Bass, M. Bleicher, H. Stöcker, and W. Greiner, nucl-th/9901046.
  • (14) Yu.A.Alexandrov et al., Nucl. Instr. Meth. A 408, 359 (1998).
  • (15) W. Beusch, CERN/SPSC/77-70.
  • (16) M.I. Adamovich et al., Eur. Phys. J. C5, 621 (1998).
  • (17) C. Caso et al., Eur. Phys. J. C3, 1 (1998).
  • (18) G.I. Kopylov, Phys. Lett. B50, 472 (1974); D. Drijard et al., Nucl. Instr. Meth. 225, 367 (1984).
  • (19) M. Baubillier et al., Nucl. Phys. B 192, 1 (1981).
  • (20) R. Blankenbecler and S.J. Brodsky, Phys. Rev. D10, 2973 (1974).
  • (21) W.M. Geist, Nucl. Phys. A525, 149c (1991).
  • (22) S. Apsell et al., Phys. Rev. Lett. 24, 777 (1970).
  • (23) J.B. Gay et al., Phys. Lett. 62B, 477 (1976).
  • (24) J.Alitti et al., Phys. Rev. Lett. 22, 79 (1969).
  • (25) T. Sjöstrand, Computer Phys. Comm. 82, 74 (1994).
  • (26) A.B. Kaidalov and K.A. Ter-Martirosyan, Sov. J. Nucl. Phys. 39, 1545 (1984); A.I. Veselov, O.I. Piskunova and K.A. Ter-Martirosyan, Phys. Lett. B158, 175 (1985); A.B. Kaidalov and O.I. Piskunova, Z. Phys. C30, 145 (1986); A.B. Kaidalov, Sov. J. Nucl. Phys. 45, 1450 (1987); S.P. Baranov, program HIPPOPO, Lebedev Physical Institute preprint 42 (1998).
  • (27) MARK II Collab., M. Piccolo et al., Phys. Rev. Lett. 39, 1503 (1977); MARK II Collab., G.S. Abrams et al., Phys. Rev. Lett. 44, 10 (1980).
  • (28) V. Blobel et al., Nucl. Phys. B69, 454 (1979); K. Jaeger et al., Phys. Rev. D11, 2405 (1975); H. Kishimi et al., Phys. Lett. B72, 411 (1978); D. Drijard et al., Z. Phys. C12, 217 (1982).
  • (29) A.E. Brenner et al., Phys. Rev. D26,1497 (1982).