Search for Rare and Forbidden Dilepton Decays of the , , and Charmed Mesons
Abstract
We report the results of a search for flavor-changing neutral current, lepton-flavor violating, and lepton-number violating decays of , , and mesons (and their antiparticles) into modes containing muons and electrons. Using data from Fermilab charm hadroproduction experiment E791, we examine the and decay modes of and and the decay modes of . No evidence for any of these decays is found. Therefore, we present branching-fraction upper limits at 90 confidence level for the 24 decay modes examined. Eight of these modes have no previously reported limits, and fourteen are reported with significant improvements over previously published results.
keywords:
Charm, Rare, Forbidden, Decay, DileptonPACS:
13.20.Fc, 13.30.Ce, 14.40.LbFERMILAB-Pub-99/183-E
UMS/HEP/99–020
, , , , , , , , , , , , , , , , , , , , , , , , , , , , , , , , , , , , , , , , , , , , , , , , , , , , , , , , , , , , , , , , , , , , , , , , , , , , , , and
The SU(2)U(1) Standard Model of electroweak interactions qualitatively accounts for the known decays of heavy quarks and can often quantitatively predict the decay rates. However, this model is incomplete in that it does not account for the number of quark and lepton families observed, nor their hierarchy of mass scales. Also unknown is the mechanism responsible for breaking the underlying gauge symmetry. One way to search for physics beyond the Standard Model is to search for decays that are forbidden or else are predicted to occur at a negligible level. Observing such decays would constitute evidence for new physics, and measuring their branching fractions would provide insight into how to modify our theoretical understanding, e.g., by introducing new particles or new gauge couplings.
In this letter we present the results of a search for 24 decay modes of the neutral and charged mesons (which contain the heavy charm quark). These decay modes111Charge-conjugate modes are included implicitly throughout this paper. fall into three categories:
-
1.
FCNC – flavor-changing neutral current decays ( and , in which is or );
-
2.
LFV – lepton-flavor violating decays (, , and , in which the leptons belong to different generations);
-
3.
LNV – lepton-number violating decays (, in which the leptons belong to the same generation but have the same sign charge).
Decay modes belonging to (1) occur within the Standard Model via higher-order diagrams, but the estimated branching fractions are to [1]. Such small rates are below the sensitivity of current experiments. However, if additional particles such as supersymmetric squarks or charginos exist, they could contribute additional amplitudes that would make these modes observable. Decay modes belonging to (2) and (3) do not conserve lepton number and thus are forbidden within the Standard Model. However, lepton number conservation is not required by Lorentz invariance or gauge invariance, and a number of theoretical extensions to the Standard Model predict lepton-number violation [2]. Many experiments have searched for lepton-number violation in decays, and for lepton-number violation and flavor-changing neutral currents in and decays. The limits we present here for rare and forbidden dilepton decays of the mesons are typically more stringent than those obtained from previous searches [3], or else are the first reported.
The data are from Fermilab experiment E791 [4], which recorded events with a loose transverse energy trigger. These events were produced by a 500 GeV/ beam interacting in a target consisting of five thin foils that had 15 mm center-to-center separation along the beamline. The most upstream foil was 0.5 mm thick platinum. It was followed by four foils consisting of 1.6 mm thick diamond. Momentum analysis was provided by two dipole magnets that bent particles in the horizontal (-) plane. Position information for track and vertex reconstruction was provided by 23 silicon microstrip detectors (6 upstream and 17 downstream of the target) along with 10 planes of proportional wire chambers (8 upstream and 2 downstream of the target), and 35 drift chamber planes. The experiment also included electromagnetic and hadronic calorimeters, a muon detector, and two multi-cell Čerenkov counters that provided separation in the momentum range GeV/ [5]. The kaon identification criteria varied by search decay mode. We typically required that the momentum-dependent light yield in the Čerenkov counters be consistent with that of a kaon track measured in the spectrometer.
Electrons were identified by an electromagnetic calorimeter [6] that consisted of lead sheets and liquid scintillator located 19 m downstream of the target. Electron identification was based on energy deposition and transverse shower shape in the calorimeter. The electron identification efficiency varied from 62 for momenta below 9 GeV/ to 45 for momenta above 20 GeV/. The decrease in efficiency with increasing momentum reflects the fact that higher momentum electrons populate a more congested region of the spectrometer. The pion misidentification rate was approximately 0.8, independent of pion momentum.
Muon identification was obtained from two planes of scintillation counters. The plane that measured vertical coordinates () consisted of 16 scintillation counters, each 3 meters long and 14 cm wide. The plane that measured horizontal coordinates () consisted of 14 counters, each 3 meters long and covering a full width of 5.5 meters in the -direction. The counters were located behind shielding with a thickness equivalent to 2.5 meters (15 interaction lengths) of iron. Candidate muon tracks projected into the muon system were required to pass a series of muon quality criteria that were optimized with decays from our data [7]. Timing information from the -coordinate counters was used to improve the position resolution in the -direction. The efficiencies of the muon counters were measured in special runs using muons originating from the primary beam dump, and were found to be for the -coordinate counters and for the -coordinate counters. The probability for misidentifying a pion as a muon decreased as momentum increased, from about 6 at 8 GeV/ to for momenta greater than 20 GeV/.
After reconstruction, events with evidence of well-separated production (primary) and decay (secondary) vertices were retained for further analysis. To separate charm candidates from background, we required the following: that secondary vertices be well-separated from the primary vertex and located well outside the target foils and other solid material; that the momentum vector of the candidate charm meson point back to the primary vertex; and that the decay track candidates pass approximately 10 times closer to the secondary vertex than to the primary vertex. A secondary vertex had to be separated from the primary vertex by greater than for decays and greater than for and decays, where is the calculated resolution of the measured longitudinal separation. In addition, the secondary vertex had to be separated from the closest material in the target foils by greater than , where is the uncertainty in this separation. The sum of the vector momenta of the tracks from the secondary vertex was required to pass within m of the primary vertex in the plane perpendicular to the beam. Finally, the net momentum of the charm candidate transverse to the line connecting the production and decay vertices had to be less than 300 MeV/ for candidates, less than 250 MeV/ for candidates, and less than 200 MeV/ for candidates. These selection criteria and, where possible, the kaon identification requirements, were the same for the search mode and for its normalization signal.
For this study we used a “blind” analysis technique. Before our selection criteria were finalized, all events having masses within a mass window around the mass of , , or were “masked” so that the presence or absence of any potential signal candidates would not bias our choice of selection criteria. All criteria were then chosen by studying signal events generated by a Monte Carlo simulation program (see below) and background events from real data. Events within the signal windows were unmasked only after this optimization. Background events were chosen from a mass window above and below the signal window . The criteria were chosen to maximize the ratio , where and are the numbers of signal and background events, respectively. We used asymmetric windows for the decay modes containing electrons to allow for the bremsstrahlung low-energy tail. The signal windows are:
| (1) |
We normalize the sensitivity of our search to topologically similar Cabibbo-favored decays. For the decays we use ; for decays we use ; and for decays we use . The widths of our normalization modes were 10.5 MeV/ for , 9.5 MeV/ for , and 12 MeV/ for . The events within the window are shown in Figs. 1a–c. The upper limit for each branching fraction is calculated using the following formula:
| (2) |
where is the 90 CL upper limit on the number of decays for the rare or forbidden decay mode , and is that mode’s detection efficiency. is the fitted number of normalization mode decays; is the normalization mode detection efficiency; and is the normalization mode branching fraction obtained from the Particle Data Group [3].

The ratio of detection efficiencies is
| (3) |
where and are the fractions of Monte Carlo events that are reconstructed and pass the final selection criteria, for the normalization and decay modes respectively. The simulations use Pythia/Jetset [8] as the physics generator and model the effects of resolution, geometry, magnetic fields, multiple scattering, interactions in the detector material, detector efficiencies, and the analysis selection criteria. The efficiencies for the normalization modes varied from approximately to depending on the mode, and the efficiencies for the search modes varied from approximately to .
Monte Carlo studies show that the experiment’s acceptances are nearly uniform across the Dalitz plots, except that the dilepton identification efficiencies typically drop to near zero at the dilepton mass threshold. While the loss in efficiency varies channel by channel, the efficiency typically reaches its full value at masses only a few hundred MeV/ above the dilepton mass threshold. We use a constant weak-decay matrix element when calculating the overall detection efficiencies. Two exceptions to the use of the Monte Carlo simulations in determining relative efficiencies are made: those for Čerenkov identification when the number of kaons in the signal and normalization modes are different, and those for the muon identification. These efficiencies are determined from data.

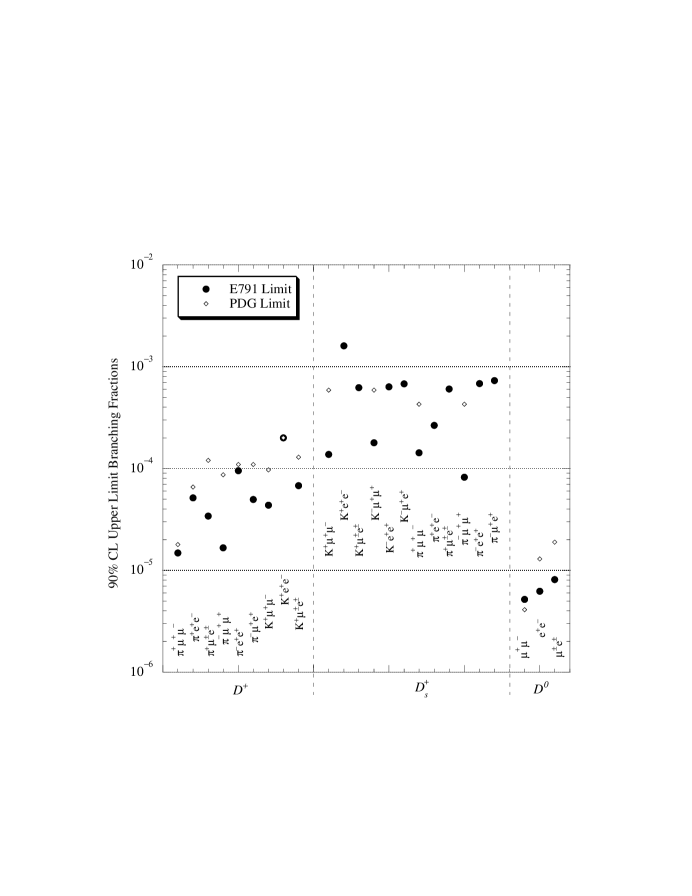
The 90 CL upper limits are calculated using the method of Feldman and Cousins [9] to account for background, and then corrected for systematic errors by the method of Cousins and Highland [10]. In these methods, the numbers of signal events are determined by simple counting, not by a fit. All results are listed in Table 1 and shown in Figs. 2 and 3. The kinematic criteria and removal of reflections (see below) are different for the , , and . Thus, the and rows in Fig. 2 with the same decay particles are different, and the seventh row of Fig. 2 is different from the bottom row of Fig. 1.
The upper limits are determined by both the number of candidate events and the expected number of background events within the signal region. Background sources that are not removed by the selection criteria discussed earlier include decays in which hadrons (from real, fully-hadronic decay vertices) are misidentified as leptons. In the case where kaons are misidentified as leptons, candidates have effective masses which lie outside the signal windows. Most of these originate from Cabibbo-favored modes , , and (and charge conjugates). These Cabibbo-favored reflections are explicitly removed prior to the selection-criteria optimization. There remain two sources of background in our data: hadronic decays with pions misidentified as leptons () and “combinatoric” background () arising primarily from false vertices and partially reconstructed charm decays. After selection criteria were applied and the signal windows opened, the number of events within the window is .
The background arises mainly from singly-Cabibbo-suppressed (SCS) modes. These misidentified leptons can come from hadronic showers reaching the muon counter, decays-in-flight, and random overlaps of tracks from otherwise separate decays (“accidental” sources). We do not attempt to establish a limit for modes, as they have relatively large feedthrough signals from copious Cabibbo-favored decays. Instead, we use the observed signals in channels to measure three dilepton misidentification rates under the assumption that the observed signals (shown in Figs. 1d–f) arise entirely from lepton misidentification. The curve shapes were determined from Monte Carlo simulations. The following misidentification rates were obtained: , , and . Using these rates we estimate the numbers of misidentified candidates, (for and ) and (for ), in the signal windows as follows:
| (4) |
where and are the numbers of SCS hadronic decay candidates within the signal windows. For modes in which two possible pion combinations can contribute, e.g., , we use twice the above rate. These misidentification backgrounds were typically small or negligible.
To estimate the combinatoric background within a signal window , we count events having masses within an adjacent background mass window , and scale this number () by the relative sizes of these windows:
| (5) |
To be conservative in calculating our 90 confidence level upper limits, we take combinatoric backgrounds to be zero when no events are located above the mass windows. In Table 1 we present the numbers of combinatoric background, misidentification background, and observed events for all 24 modes.
The sources of systematic errors in this analysis include: statistical errors from the fit to the normalization sample ; statistical errors on the numbers of Monte Carlo generated events for both and ; uncertainties in the calculation of misidentification background; and uncertainties in the relative efficiency for each mode, including lepton and kaon tagging efficiencies. These tagging efficiency uncertainties include: 1) the muon counter efficiencies from both Monte Carlo simulation and hardware performance; 2) kaon Čerenkov identification efficiency due to differences in kinematics and modeling between data and Monte Carlo simulated events; and 3) the fraction of signal events (based on simulations) that would remain outside the signal window due to bremsstrahlung tails. The larger systematic errors for the modes, compared to the and modes, are due to the uncertainty in the branching fraction for the normalization mode. The sums, taken in quadrature, of these systematic errors are listed in Table 1.
| (Est. | BG) | Cand. | Syst. | 90 CL | E791 | PDG98 [3] | |
|---|---|---|---|---|---|---|---|
| Mode | Obs. | Err. | Num. | Limit | Limit | ||
| 1.20 | 1.47 | 2 | 10 | 3.35 | |||
| 0.00 | 0.90 | 1 | 12 | 3.53 | |||
| 0.00 | 0.78 | 1 | 11 | 3.64 | |||
| 0.80 | 0.73 | 1 | 9 | 2.92 | |||
| 0.00 | 0.45 | 2 | 12 | 5.60 | |||
| 0.00 | 0.39 | 1 | 11 | 4.05 | |||
| 2.20 | 0.20 | 3 | 8 | 5.07 | |||
| 0.00 | 0.09 | 4 | 11 | 8.72 | |||
| 0.00 | 0.08 | 1 | 9 | 4.34 | |||
| 0.67 | 1.33 | 0 | 27 | 1.32 | |||
| 0.00 | 0.85 | 2 | 29 | 5.77 | |||
| 0.40 | 0.70 | 1 | 27 | 3.57 | |||
| 0.40 | 0.64 | 0 | 26 | 1.68 | |||
| 0.00 | 0.39 | 0 | 28 | 2.22 | |||
| 0.80 | 0.35 | 1 | 27 | 3.53 | |||
| 0.93 | 0.72 | 1 | 27 | 3.02 | |||
| 0.00 | 0.83 | 0 | 29 | 1.85 | |||
| 0.00 | 0.72 | 2 | 30 | 6.01 | |||
| 0.80 | 0.36 | 0 | 27 | 1.60 | |||
| 0.00 | 0.42 | 1 | 29 | 4.44 | |||
| 0.00 | 0.36 | 3 | 28 | 8.21 | |||
| 1.83 | 0.63 | 2 | 6 | 3.51 | |||
| 1.75 | 0.29 | 0 | 9 | 1.26 | |||
| 2.63 | 0.25 | 2 | 7 | 3.09 |
In summary, we use a “blind” analysis of data from Fermilab experiment E791 to obtain upper limits on the dilepton branching fractions for flavor-changing neutral current, lepton-number violating, and lepton-family violating decays of , , and mesons. No evidence for any of these decays is found. Therefore, we present upper limits on the branching fractions at the 90 confidence level. These limits represent significant improvements over previously published results. Eight new search modes are reported. A comparison of our 90 C.L. upper limits with previously published results [3] is shown in Fig. 3.
We gratefully acknowledge the assistance of the staffs of Fermilab and of all the participating institutions. This research was supported by the Brazilian Conselho Nacional de Desenvolvimento Científico e Tecnológico, CONACyT (Mexico), the Israeli Academy of Sciences and Humanities, the U.S. Department of Energy, the U.S.-Israel Binational Science Foundation, and the U.S. National Science Foundation. Fermilab is operated by the Universities Research Association, Inc., under contract with the U.S. Department of Energy.
References
- [1] A. J. Schwartz, Mod. Phys. Lett. A8 (1993) 967; P. Singer and D.-X. Zhang, Phys. Rev. D 55 (1997) 1127.
- [2] See for example: S. Pakvasa, hep-ph/9705397; S. Pakvasa, Chin. J. Phys. 32 (1994) 1163.
- [3] Particle Data Group, C. Caso et al., Eur. Phys. J. C 3 (1998) 1.
- [4] J. A. Appel, Ann. Rev. Nucl. Part. Sci. 42 (1992) 367; D. J. Summers et al., Proceedings of the XXVII Rencontre de Moriond, Electroweak Interactions and Unified Theories, Les Arcs, France (15-22 March, 1992) 417; S. Amato et al., Nucl. Inst. and Meth. A324 (1992) 535; S. Bracker et al., IEEE Trans. Nucl. Sci. 43 (1996) 2457; Fermilab E791 Collaboration, E. M. Aitala et al., to appear in Eur. Phys. J. C, Fermilab-Pub-98-297-E, hep-ex/9809029 (September, 1998).
- [5] D. Bartlett et al., Nucl. Inst. and Meth. A260 (1987) 55.
- [6] V. K. Bharadwaj et al., Nucl. Inst. and Meth. 155 (1978) 411; V. K. Bharadwaj et al., Nucl. Inst. and Meth. 228 (1985) 283; D. J. Summers, Nucl. Inst. and Meth. 228 (1985) 290.
- [7] Fermilab E791 Collaboration, E. M. Aitala et al., Phys. Lett. B440 (1998) 435.
- [8] H.-U. Bengtsson and T. Sjöstrand, Comp. Phys. Comm. 82 (1994) 74; T. Sjöstrand, Pythia 5.7 and Jetset 7.4 Physics and Manual, CERN-TH.7112/93, 1995.
- [9] G. J. Feldman and R. D. Cousins, Phys. Rev. D 57 (1998) 3873.
- [10] R. D. Cousins and V. L. Highland, Nucl. Inst. and Meth. A320 (1992) 331.