The Ratio of Dimensionless Jet Cross Sections at the Tevatron
Abstract
Several sources, both experimental and theoretical, subject inclusive jet cross section measurements to large uncertainties. On the experimental side, the energy scale contributes between 10% and 30% uncertainties. On the theoretical side, choice of parton distribution function introduces a 20% variation in the prediction; freedom in renormalization scale provides another uncertainty of up to 30%. The ratio of inclusive jet cross sections reduces the uncertainty from these major sources, permitting a very precise test of next–to–leading order QCD. The preliminary results from DØ and CDF differ from simple QCD predictions in normalization and differ from each other at small values of jet .
I Introduction
At sufficiently high energy, field theory calculations reduce the complexities of proton–antiproton interactions to simple scattering processes involving only one constituent from each particle. Identifying these constituents, called “partons,” as quarks and gluons, quantum chromodynamics (QCD) calculations determine the matrix elements for a given scattering process, but require input from empirically-determined parton momentum distribution functions (pdf’s). Perturbative QCD calculations provide specific predictions for the rates of scattering processes as a function of final–state parton momentum and angle, but the unknown initial–state momentum superimposes a boost to the final system. Consequently, cross section predictions reflect an average over the initial momenta through sampling the pdf over a large number of events. The two largest uncertainties in the QCD prediction result from the choice of pdf and the choice of renormalization scale.
Experimentally, a final state parton is observed as a shower of collimated particles: a jet. Jet cross sections are reported in terms of , the jet energy in the plane transverse to the beamline. This analysis compares the production rate of jets at two center–of–mass energies, 630 and 1800 GeV, for two reasons. First, the ratio of cross sections constrains experimental uncertainties that are common to both studies. Second, the ratio suppresses the QCD prediction’s sensitivity to the choice of pdf. The ratio of cross sections thus provides a stronger test of the matrix element portion of the calculation than a single cross section measurement alone.
II Context
A simple parton model without gluon bremsstrahlung would predict a jet cross section that scales with center–of–mass energy (). In this scenario, a dimensionless jet cross section, , plotted as a function of jet , would remain constant with respect to changes in center–of–mass energy.
Although past cross section ratio analyses at lower exhibited significant deviation from the scaling model, the dimensionless framework continues to provide a useful context for comparisons with the more developed QCD theory; thus, the prior tests motivate the selection of variables in this work. The time–integrated luminosity provides a measure of the statistical power of these earlier cross section measurements: the 1985 results from UA2 [1] include 122 nb-1 ( GeV) and 310 nb-1 ( GeV) of data, whereas the 1993 result from CDF [2] compared 8.58 nb-1 ( GeV) to 4430 nb-1 ( GeV).
As reported in [3], the DØ collaboration at Fermilab measured the inclusive jet cross section at GeV using 93,000 nb-1 of data. This article presents a complementary inclusive jet cross section analysis at , with 537 nb-1 of data. The most recent analyses from the CDF collaboration at Fermilab use data samples of similar size at both center–of–mass energies. Because in each case, the data sets for both center–of–mass energies were collected with the same detector [4][5], many uncertainties in the results are highly–correlated, particularly uncertainties in the calorimeter response and calorimeter noise. Additionally, the explicit expression of the correlations in uncertainties from bin to bin provides a more stringent comparison to QCD than was previously possible.
The remainder of this article focuses on the methods of the DØ analysis of the jet cross section and ratio, reserving discussion of the CDF result for last. Although the details differ, both experiments require the same components for their respective analyses: data reconstruction, sample selection, energy scale correction, and resolution correction.
III Data Reconstruction and Sample Selection
The DØ collaboration employs the variables transverse energy and pseudorapidity to describe the hadronic particle showers that result from inelastic pp̄ collisions. Here, measures the polar angle relative to the proton beam direction. Jets are defined by their hadronic shower and centroid. Starting with the most energetic deposits in the calorimeter, the DØ reconstruction algorithm [6] iteratively finds the energy–weighted centroid for each hadronic shower within a cone of dimensionless radius 0.7. When two such showers overlap, they are merged into a single jet if they share more than 50% of the of the lowest– shower; otherwise, they are split into two separate jets, each with its own centroid and .
The online data selection procedure triggers on events that contain at least one jet above threshold. A small correction, for the first data point and decreasing thereafter, removes the effect of a slight trigger inefficiency at low . The offline data selection procedure, which eliminates background caused by electrons, photons, noise, or cosmic rays, closely follows the methods [7][8] of the 1800 GeV analysis. The efficiency of jet selection is nearly constant as a function of jet , approximately . To maintain optimal precision in jet energy measurements, a vertex requirement discarded jets originating from interaction points more than 50 cm from the longitudinal center of the detector, lowering the total data selection efficiency to . The cross section uncertainty associated with all efficiencies amounts to less than .
IV Energy Scale and Resolution Corrections
The jet energy scale correction, described in [9], corrects the energy response of the DØ calorimeter and removes cone boundary effects, multiple interaction effects, calorimeter noise, and the underlying event energy resulting from spectator partons. The response correction increases the of jets by when the raw calorimeter is , and increases the by at asymptotically–high raw ’s. Calorimeter noise contributes on average of to each jet. The underlying event, which represents the only significant difference between center–of–mass energies, contributes to each jet at , compared to at . Simply speaking, a jet’s measured increases by 12 to 14% after the total energy scale correction. Uncertainties from the noise and response corrections dominate the systematic uncertainty band of the final result.
Although the energy scale algorithm corrects jets from their reconstructed to their “true” on average, the energy scale cannot remove the random fluctuations of individual jets about this average value. The resulting imperfect resolution of a jet’s about its true value leads to a smearing effect that effectively inflates the observed cross section, especially in the steepest portions of the distribution. After removing contributions that do not result from detector effects, deviations from perfect momentum balance in dijet events provide a measure of the average resolution as a function of jet .
The observed cross section distribution can be described as the convolution of the resolution function and an initial distribution, , where is a Gaussian distribution and the initial distribution is modelled by:
| (1) |
The Gaussian has –dependent width, and represents the jet resolution. The three parameters of the ansatz function, , , and , are determined with a best–fit of the smeared distribution, , to the observed cross section. The correction factor for the smearing effect is expressed as ; the measured cross section is multiplied by on a bin–by–bin basis. The uncertainty of unsmearing the cross section is expressed in an error matrix, where the partial derivatives of the correction factor with respect to each parameter are determined numerically. In addition to the fitting uncertainties of , this matrix includes contributions from the resolution determination.
V Results
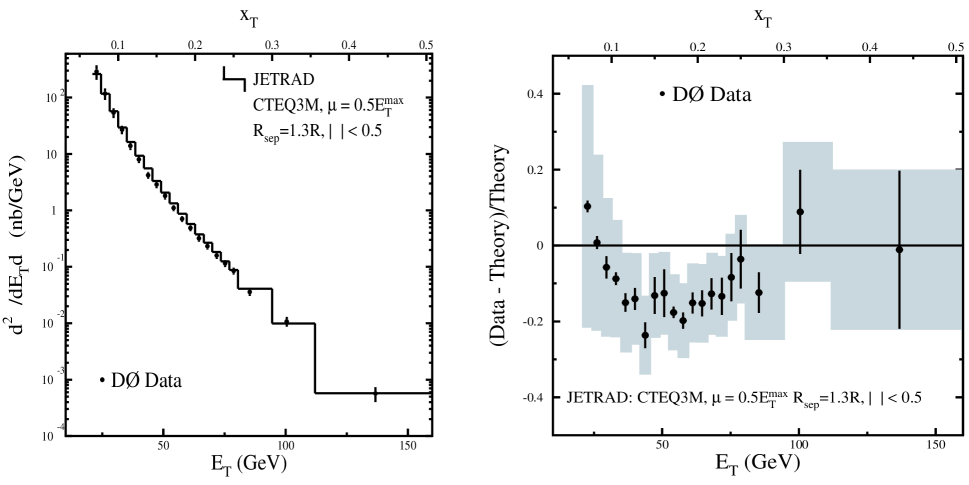
The unsmeared jet cross section appears in the left side of Figure 1. The point position within each bin occurs where the ansatz takes its average value within the bin. The corresponding positions appear on the upper axis in anticipation of the ratio of cross sections; by design, the points provide an exact match to the points derived from the jet cross section at . The right side of Figure 1 compares the cross section to a NLO QCD prediction, with renormalization and factorization scales set to and using CTEQ3M parton distribution function. , a phenomenological parameter [10] in the prediction, was set to the usual value of 1.3. The shaded blocks in the figure indicate the systematic uncertainty of the cross section measurement, while the vertical bars indicate the statistical uncertainty.
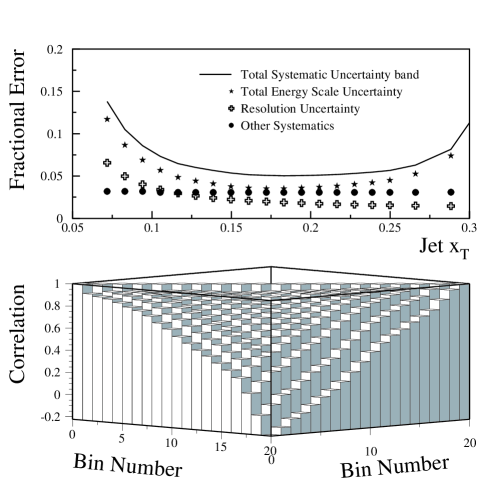
The primary uncertainty in the ratio of cross sections results from the energy scale correction, and the remaining uncertainty consists mostly of the resolution and luminosity uncertainties, as depicted in Fig. 2. Although the systematic error in the individual cross sections ranges from 10% to as much as 30%, strong numerator–to–denominator correlations in each bin of the ratio of cross sections reduce the uncertainty to as low as .
Because they result primarily from best–fits, the uncertainties associated with the energy scale and unsmearing corrections do not allow the cross section ratio to normalize freely. Instead, deviations in one portion of the distribution increase the probability for deviations in other parts of the distribution. The correlation of one bin in the ratio to another determines the shape evolution of the ratio, given a proposed displacement at a particular point. The correlation information is represented in the bottom of Fig. 2, where the diagonal elements are unity by definition.
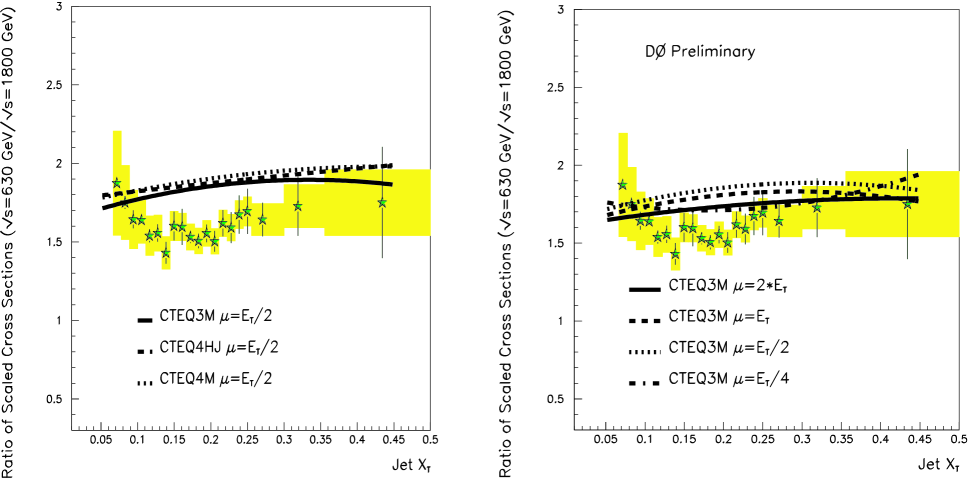
The observed ratio of scaled cross sections takes a value between 1.4 and 2.0, depending on the position in . As shown in Fig. 3, NLO QCD predictions for the ratio of cross sections lie systematically above the data throughout the majority of the measured range, most notably in the range near 0.17, where the ratio has the most statistical power. Many theoretical choices, including choice of parton distribution function, minutely change the ratio result; only the renormalization/factorization scale changes the prediction significantly. The right-hand side of Fig. 3 compares the data to predictions with various renormalization scales, which were generated with Jetrad [11].
| Scale 630 GeV | Scale 1800 GeV | prob. | ||
| 2ET | 2ET | 29.9 | 7.19% | |
| ET | ET | 41.8 | 2.91% | |
| CTEQ3M | ET | ET | 51.1 | 0.02% |
| E | E | 50.8 | 0.02% | |
| E | E | 30.9 | 5.66% | |
| CTEQ4HJ | E | E | 51.7 | 0.01% |
| MRSA′ | E | E | 56.6 | 0.002% |
| CTEQ3M, EKS | E | E | 27.9 | 11.0% |
| 2ET | E | 10.9 | 94.7% | |
| CTEQ3M | ET | E | 28.5 | 9.84% |
| E | E | 12.1 | 91.3% |
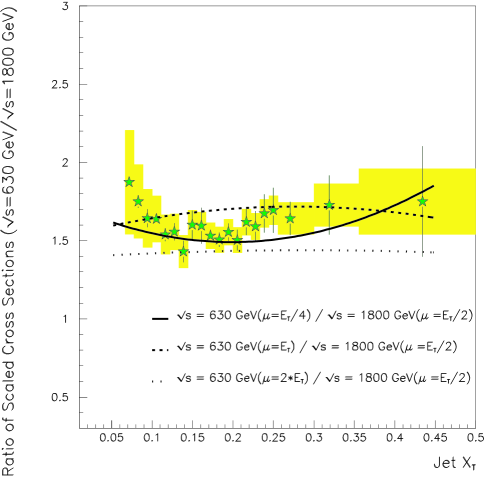
The matrix of errors and correlations allows a comparison between data and theory that can quantitatively describe the probability that the two curves describe the same parent distribution. The number of data points, 20, determines the number of degrees of freedom. The results, in Table I, indicate poor agreement between the data and NLO QCD for predictions with the same renormalization scale ( scale) in the numerator and the denominator. For predictions with different scales for two , agreement improves to as much as a 95% probability that the data and prediction represent the same distribution (Fig. 4). The need for different scales may indicate a residual dependence of the prediction to higher–order terms in the calculation.
VI The Preliminary CDF Result
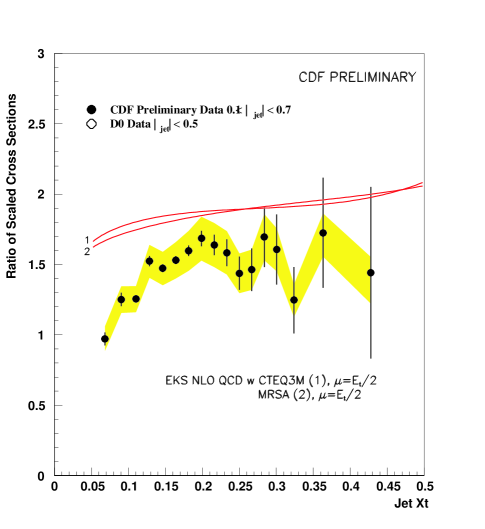
Shortly after DPF ’99, the CDF collaboration updated its preliminary result with two major improvements. First, the ratio of cross sections reflects an improvement in the available time–integrated luminosity of the 1800 GeV cross section, which increased from 4,430 nb-1 to 87,000 nb-1. (At 630 GeV, the updated CDF luminosity totals 576 nb-1.) Second, the result [12] now includes a systematic error estimate (Figure 5).
A comparison of Figure 3 and Figure 5 reveals excellent agreement between the experiments above jet of 0.12, but sharp disagreement below that value. Currently, the source of this disagreement between experiments is not understood. The CDF data in Figure 5 are entirely consistent with the CDF result of 1993 in Reference [2].
VII Conclusions
The ratio of inclusive jet cross sections provides a strong test of NLO QCD matrix elements while suppressing the uncertainties that result from pdf’s. These DØ and CDF results are drawn from larger data sets than previously available; thus, they span a larger range of jet and exhibit smaller uncertainties than any prior measurement. No quantitative comparison is needed to see that the present CDF result exhibits a clear disagreement with DØ at low values of jet .
The tests of DØ indicate that NLO QCD does not model the DØ data unless a different renormalization scale is introduced for the two center–of–mass energies. Because the renormalization scale has no physical meaning, the broad range of probabilities suggest that the precision of the data exceeds the precision of the NLO predictions.
REFERENCES
- [1] J.A.Appel et al. (UA2 Coll.), Phys. Lett. 160B, 349 (1985).
- [2] F. Abe, et al. (CDF Coll.), Phys Rev. Lett. 70, 1376 (1993).
- [3] B.Abbott et al. (DØ Coll.), Phys Rev Lett 82, 2451 (1999).
- [4] S. Abachi et al. (DØ Coll.), Nucl. Instr. Meth. Phys. Res. A 338, 185 (1994).
- [5] F. Abe et al., Nucl. Inst. and Meth. A271 387 (1988).
- [6] B. Abbott et al., Fermilab-Pub-97-242-E (1997).
- [7] V.D. Elvira, “Inclusive Jet Production,” Ph. D. Thesis, Universidad de Buenos Aires, 1995 (unpublished).
- [8] J. Krane, “The Ratio of Inclusive Jet Cross Sections at GeV and GeV,” Ph.D. Thesis, University of Nebraska–Lincoln, 1998 (unpublished).
- [9] B. Abbott et al. (DØ Coll.), Submitted to Nucl. Instr. Meth. Phys. Res. A, (1998) Fermilab-Pub-97/330-E.
- [10] B.Abbott et al., Fermilab-Pub-97-242-E.
- [11] W.T. Giele, E.W.N. Glover, and D.A.Kosower, Phys. Rev. Lett. 73, 2019 (1994).
- [12] A.Akopian, “Scaling Violation in Inclusive Jet Production,” Ph.D. Thesis, The Rockefeller University, 1999 (unpublished).