UCTP-108-99
PRINCETON/HEP/99-3
Development of a Straw Tube Chamber with Pickup-Pad Readout
Abstract
We have developed a straw tube chamber with pickup-pad readout. The mechanism for signal pickup, the size of the pickup signal, and the distribution of signals among neighboring pads are discussed. We have tested a prototype chamber in a beamtest at Brookhaven National Laboratory and have measured chamber efficiencies in excess of 99%.
I Introduction
In this paper we describe the construction and performance of a straw tube chamber with a unique type of readout: rather than signals being read from anode wires, signals are read from pads placed against the straw tubes which pick up signals induced by the gas avalanches. This readout scheme has three advantages: (1) fully-correlated and position information; (2) the pad sizes can be chosen almost arbitrarily, for example, to give equal pad occupancy over a region in which particle flux is varying; and (3) the high-voltage and front-end electronics are decoupled. For the gas avalanche signals to be picked up by the pads, the straw tube material must be resistive such that the straw tube wall does not substantially shield the signal. There are several issues which determine the feasibility of using such a detector under experimental conditions: the size of the pickup signal, the level of noise (both capacitive and pickup), and the distribution of pickup signals among neighboring pads. Multiwire proportional chambers with resistive cathodes and pickup pad readout have been studied by Battistoni et al.[1]. Resistive straw tubes with pickup wires wrapped around the straws have been studied by Bychkov et al.[2].
Our final objective is to use such a chamber to trigger on tracks with large transverse momentum () in the HERA-B experiment at DESY[3, 4]. To accomplish this, we position three chamber stations within the HERA-B spectrometer magnet and input the pad hit pattern to fast coincidence logic. The logic flags hit patterns that are characteristic of tracks which bend little within the magnetic field and which lie at larger angles with respect to the beam. To minimize hit multiplicities and simplify the trigger logic, we desire that the pickup signal be as localized as possible, preferentially occurring on only one pad.
II Chamber Construction
A Overview
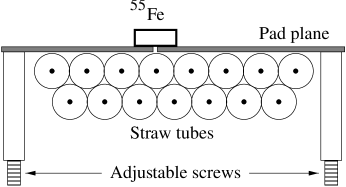
We have constructed two prototype chambers which we refer to as chamber A and chamber B. The chambers are similar and consist of two distinct parts: (1) the straw tubes, their endplates, and the high voltage distribution cards; and (2) the pickup pads and their preamplifier cards. The straw tubes have a diameter of 5.0 mm and are configured in two rows of sixteen straw tubes each. For chamber A, the tubes have a length of 60 cm and the rows are offset with respect to each other by one straw tube radius. This “close-packed” geometry is especially resistant to mechanical stresses. For chamber B, the tubes have a length of 40 cm and the rows are offset by a smaller amount, only 0.6 mm. Chamber B also has a thin line of conductive paint applied to the surface of every third straw tube. This paint is held at ground potential, and its purpose is to limit the pickup signal to a single pad (to be discussed later). In all other aspects the two chambers are identical. The pickup pads for both chambers have dimensions cm2 and are etched on one side of a printed circuit board. The arrangement of straw tubes and pad plane is shown in Fig. 1.

B Straw Tubes
The straw tubes are rolled[5] out of two-layer material: the inner layer consists of carbon-loaded Kapton with a resistivity of approximately 1 M/square[6], and the outer layer consists of Mylar. The Kapton layer serves as the cathode and is held at ground potential, while the Mylar layer helps provide a gas seal. The thickness of the Kapton is 0.001 inch, and the thickness of the Mylar is 0.0005 inch. The straws are strung with gold-plated tungsten wire having a diameter of 20 m. For most of our tests we used a gas mixture of 90% Argon and 10% Methane (“P10”).
C Pickup Pads
The pad plane consists of a two-layer printed circuit board with copper pads on one side and traces on the other. The traces connect to the pads via plated through-holes and carry signals to one end of the pad plane, where preamplifier cards are mounted. To minimize detector mass, the material used for the printed circuit board is Kapton. The thickness of the Kapton is only 0.006 inches (including the Cu pads and traces), which corresponds to 0.28% of a radiation length. The trace width is 0.006 inches. The front-end readout cards are based upon the ASD-8 amplifier-shaper-discriminator ASIC developed at the University of Pennsylvania[7].
III Bench Measurements and Simulation Results
We have conducted a series of bench tests to measure the signal size, noise, and the relative sizes of pickup signals among neighboring pads. The test setup used is shown in Fig. 2.
A Signal Size
To measure signal size, we positioned an 55Fe source ( KeV) above a small hole drilled in the pad plane. This hole is located directly above a straw tube as shown in Fig. 2. We measured the signal collected on both the anode wire and the pickup pad using an Ortec multichannel analyzer (MCA) system consisting of a 142PC charge amplifier, a 570 spectroscopy amplifier, and a 419 MCA PC plug-in board. The spectra show a significant signal from the pickup pad: the ratio of pad signal to anode wire signal is about 1/3.
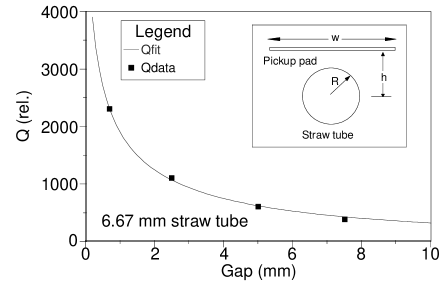
The size of the pickup signal is very sensitive to the size of the gap between the straw tubes and the pad plane. We have measured this dependence using the same test setup; the resulting data is shown in Fig. 3. We account for this data quantitatively by considering the geometry of the insert in Fig. 3. For a single straw tube and an infinitely long pickup strip oriented parallel to it, the capacitance per unit length between the straw tube and pickup strip is[8]:
| (1) |
where is the permittivity of free space (neglecting the effect of the thin Mylar layer of the straw tube wall), is the width of the pickup strip, , and . In these expressions is the distance between the center of the tube and the pickup strip, and is the radius of the tube. If the potential on the straw tube is , then the signal on the pickup strip per unit length is . It is due to the factor that the pickup signal depends strongly on the ratio . The signal size predicted by Eq. (1) is superimposed on the data in Fig. 3 and shows very good agreement.
The basic assumption of this model is that the straw tube wall is an equipotential surface; i.e., the charge induced on the tube wall has sufficient mobility to form an equipotential surface within a time scale much less than the response time of the readout electronics. This time scale is expected to be of order [9], where is the permittivity of Kapton and is its bulk conductivity. Since our film has a resistivity of 1 M/square and a thickness of 0.001 inch, -m)-1. If we take the permittivity of Kapton to be that of free space , then the time scale required is 225 ps. This interval is relatively short: the fraction of signal charge collected in time is , where , is the radius of the anode wire, is the radius of the straw tube, is the mobility of the positive ions, and is the anode wire voltage. Inserting values m, mm, mm-sec), and V, we find that in 225 ps only 1.4% of the signal charge has been collected.
B Distribution of Pickup Signals
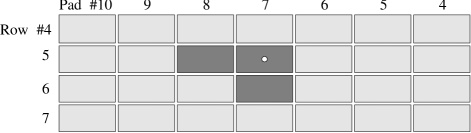
We have measured the distribution of pickup signals among neighboring pads using an 55Fe source. The pad geometry studied is shown in Fig. 4. The 55Fe source is placed above pad #7, row #5. There is a small hole drilled in the center of this pad to allow X-rays from the source to enter the straw tube below. We trigger on signals from this pad and measure the signals picked up by neighboring pads. The results are summarized in Table I.
1 Distribution of Signals Along the Straw Tube Direction
From Table I we observe that the signal distribution along the straw tube direction (pad #8, row #5) is narrow. There are two mechanisms affecting the distribution in this direction: (a) the direct signal-induction mechanism, and (b) signal propagation along the transmission line formed by the anode wire and the cathode tube. The signal distribution due to can be calculated analytically using Green’s reciprocation theorem[10]; a solution is given in the long version of this paper[11]. The resulting charge distribution on the pads after 6 ns (the shaping time of the ASD-8) is relatively narrow: the standard deviation of a Gaussian fit to the distribution is only 1.4 mm. This value is consistent with the value measured (Table I); however, the measurement is dominated by noise and also receives contributions from wider angle photons that produce gas avalanches closer to the pad boundary. Thus, we interpret the values in Table I as upper bounds.
The signal distribution due to propagation via the transmission line formed by the anode wire and the cathode tube is also calculated in Ref. [11]. Since the tube wall is made of a highly-resistive material, the signal propagates with strong attenuation. The calculation predicts that for a straw tube resistivity of 1 M/square, the signal is attenuated by a factor of 89 over a distance of 1 cm. We thus conclude that for pad lengths cm, the signal distribution among pads due to this mechanism is also narrow.
2 Distribution of Signals Perpendicular to the Straw Tube Direction
Table I shows that the pickup signal on the pads transverse to the straw tube direction is 12% of that on the main pad. This result has been successfully simulated using two models: (1) a simple “capacitive coupling” model, and (2) a finite element analysis (FEA) simulation.
The capacitive coupling model corresponding to chamber A is shown in Fig. 5. In this figure, is the capacitance between a straw tube and a pad, and is the capacitance between adjacent straw tubes. Note that one pad ( cm) covers three straw tubes ( mm). The gas avalanche is modeled as a current source injecting charge into a single node as indicated in the figure. We apply Kirchhoff’s law to this circuit to obtain a set of linear, coupled equations. We then solve these equations numerically to obtain the charge induced on each pad. We have calculated the induced charge for two cases: and . The first case corresponds to a gap size of approximately 0.1 mm, while the latter case corresponds to a gap size of only 0.012 mm. The result for is very close to the measured value: the ratio of the signal on an adjacent pad to that on the main pad is 0.13, while the measured value is 0.12 (see Table I). The result obtained with the FEA simulation is identical. A detailed description of the FEA calculation is given in Ref. [11].

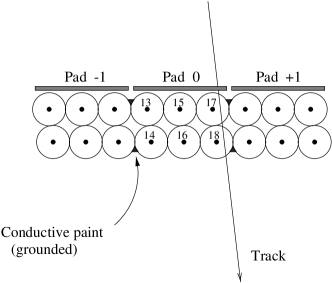
3 Limiting the Pickup Signal
Our bench measurements and simulation results indicate that the distribution of pickup signals perpendicular to the direction of the straw tubes — when fit to a Gaussian function — has a standard deviation of 0.5 pad.***This spread is for a straw tube diameter of 5.0 mm and a pad width of 15 mm. This spread is relatively large for triggering purposes. To prevent adjacent pads from recording hits, we have developed a technique to limit the pickup signal to a single pad. This technique is as follows: at the juncture between straw tubes which lie at pad boundaries, we apply a thin line of conductive paint as shown in Fig. 6. This paint is held at ground potential via contact with the chamber endplates and provides a preferred location for electric field lines to end. In this manner the capacitive coupling between adjacent straw tubes is reduced. This mechanism has been simulated by the FEA program, and the resultant distribution of pickup signals indicates that the ratio of signal on an adjacent pad to that on the main pad is only 1/62. We have measured this ratio using the pad arrangement of Fig. 4 and obtained 1/38. This value is in rough agreement with that calculated and is significantly smaller than that measured without the conductive paint applied, 1/8 (Table I).
IV Beamtest Results
We have tested prototype chamber A in a beamtest at Brookhaven National Laboratory (BNL) in order to measure the efficiency and noise of the chamber under experimental conditions. The beamtest was conducted at the Alternating Gradient Synchrotron (AGS) using a secondary beam consisting mostly of pions with momentum in the range GeV/. A plan view of the apparatus used is shown in Fig. 7. Immediately upstream of the prototype chamber was a conventional straw tube tracking chamber consisting of two -measuring and two -measuring planes. A LeCroy 4448 latch module was used to record hits from the pad chamber, while several LeCroy 2277 TDC’s were used to record hits from the straw tube tracker. The TDC hit information allowed us to reconstruct tracks, project them to pads of the prototype chamber, and measure the efficiency of the chamber and the distribution of pickup signals among neighboring pads.

A Chamber Efficiency
The efficiency of the pad chamber was measured by reconstructing tracks in the tracker, projecting them to the pad chamber, and recording whether the pad(s) to which a track projects has a signal. The results are listed in Table II. For high voltage (HV) applied to both layers of straw tubes, the efficiency is at least 99.5% for all three discriminator threshold settings. The table also shows that when high voltage is applied to (at least) the upper layer of straws, there is very little dependence of the efficiency on the discriminator threshold setting. This indicates that even our highest threshold setting (1.75 V) corresponds to a signal well below typical pulse-heights.
B Distribution of Pickup Signals
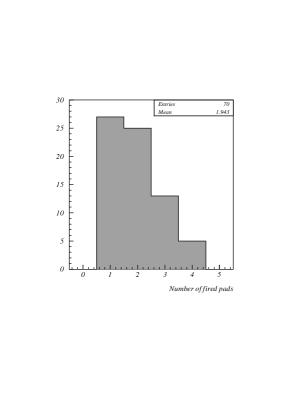
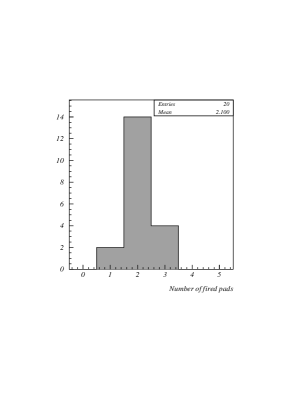
We measured the distribution of pickup signals among neighboring pads by projecting reconstructed tracks to the pad chamber and recording the total number of pads which had hits; i.e., including those pads adjacent to the pad to which the track projects. We implement this procedure for two subsets of tracks: those which project to within 2 mm of the center of a pad, and those which project to within 2 mm of the center in the -coordinate and to within 2 mm of the edge in the -coordinate. We expect the latter subset – on average – to have pickup signals distributed over a larger number of pads. For both subsets the number of contiguous pads which had hits is shown in Fig. 8. The mean number of pads with hits is 1.9 for tracks which project to the center of a pad, and 2.1 for tracks which project to the edge of a pad. Fig. 8 shows that even for the optimal case of a gas avalanche occurring in the center of a pad, the frequency of only one pad having a hit is only 39%. To increase this fraction, we developed the technique of applying conductive paint to every third straw tube as discussed previously.
V Acknowledgements
We gratefully acknowledge the strong support of the BNL AGS testbeam group, in particular Alan Carroll and Ed Schwaner. We are indebted to William Sands and Robert Klemmer of the Princeton Experimental Particles Laboratory for their excellent work in constructing the prototype chambers, and to Stanley Chidzik of the electronics shop for producing the ASD-8-based preamplifier cards. Finally, we thank Mitch Newcomer, Frank Shoemaker, and Kirk McDonald for many useful discussions.
| Pad #7, Row #5 | Pad #8, Row #5 | Pad #7, Row #6 | |
|---|---|---|---|
| Signal (mV) | 207 | ||
| Relative size | 1.0 |
| ASD-8 Threshold | |||
|---|---|---|---|
| Low (1.51 V) | Medium (1.63 V) | High (1.75 V) | |
| HV bottom layer | 0.913 | 0.905 | 0.887 |
| HV top layer | 0.953 | 0.949 | 0.945 |
| HV both layers | 0.998 | 0.997 | 0.995 |
REFERENCES
- [1] G. Battistoni et al., Nucl. Instr. Meth. 176, 297 (1980); Nucl. Instr. Meth. 152, 423 (1978).
- [2] V. N. Bychkov et al., Nucl. Instr. Meth. A367, 276 (1995).
- [3] T. Lohse et al., HERA-B, An Experiment to Study CP Violation in the B System Using an Internal Target at the HERA Proton Ring (Proposal), DESY-PRC 94/02 (1994).
- [4] E. Hartouni et al., HERA-B, An Experiment to Study CP Violation in the B System Using an Internal Target at the HERA Proton Ring (Technical Design Report), DESY-PRC 95/01 (1995).
- [5] Stone Industrial, College Park, Maryland; Lamina Dielectrics Ltd., Billingshurst, UK.
- [6] XC100 Polyimide Film (Kapton), manufactured by Dupont Films, Circleville, Ohio.
- [7] F. M. Newcomer et al., IEEE Trans. Nucl. Sci. 40, 630 (1993).
- [8] John D. Kraus, Electromagnetics, 4th Ed. (McGraw-Hill, New York, 1992), Sec. 4-15. The capacitance to a strip of width is times the capacitance to the entire plane in which the strip lies.
- [9] R. J. Bochove and J. F. Walkup, Am. J. Phys. 58 (2), 131 (1990).
- [10] See for example: W. R. Smythe, Static and Dynamic Electricity, 3rd Ed. (McGraw-Hill, New York, 1968), Sec. 2.12.
- [11] C. Leonidopoulos, et al., Development of a Straw Tube Chamber with Pickup-pad Readout, to appear in Nucl. Instr. Meth. A.