DESY–99–056
Measurement of High- Neutral-Current
Deep Inelastic Scattering Cross-Sections
at HERA
Abstract
The neutral-current deep inelastic scattering differential cross-sections , for 400 , and , for 400, 2500 and 10000 , have been measured with the ZEUS detector at HERA. The data sample of 47.7 pb-1 was collected at a center-of-mass energy of 300 . The cross-section, , falls by six orders of magnitude between = 400 and 40000 . The predictions of the Standard Model are in very good agreement with the data. Complementing the observations of time-like contributions to fermion-antifermion annihilation, the data provide direct evidence for the presence of exchange in the space-like region explored by deep inelastic scattering.
The ZEUS Collaboration
J. Breitweg,
S. Chekanov,
M. Derrick,
D. Krakauer,
S. Magill,
B. Musgrave,
A. Pellegrino,
J. Repond, R. Stanek,
R. Yoshida
Argonne National Laboratory, Argonne, IL, USA p
M.C.K. Mattingly
Andrews University, Berrien Springs, MI, USA
G. Abbiendi,
F. Anselmo,
P. Antonioli,
G. Bari,
M. Basile,
L. Bellagamba,
D. Boscherini1,
A. Bruni,
G. Bruni,
G. Cara Romeo,
G. Castellini2,
L. Cifarelli3,
F. Cindolo,
A. Contin,
N. Coppola,
M. Corradi, S. De Pasquale,
P. Giusti,
G. Iacobucci4,
G. Laurenti,
G. Levi,
A. Margotti,
T. Massam, R. Nania,
F. Palmonari,
A. Pesci,
A. Polini,
G. Sartorelli,
Y. Zamora Garcia5,
A. Zichichi
University and INFN Bologna, Bologna, Italy f
C. Amelung,
A. Bornheim,
I. Brock,
K. Coböken,
J. Crittenden,
R. Deffner,
M. Eckert6,
H. Hartmann, K. Heinloth,
L. Heinz7,
E. Hilger,
H.-P. Jakob,
A. Kappes,
U.F. Katz,
R. Kerger,
E. Paul,
M. Pfeiffer8,
J. Rautenberg,
H. Schnurbusch,
A. Stifutkin,
J. Tandler,
A. Weber,
H. Wieber
Physikalisches Institut der Universität Bonn,
Bonn, Germany c
D.S. Bailey,
O. Barret,
W.N. Cottingham,
B. Foster9,
G.P. Heath,
H.F. Heath,
J.D. McFall,
D. Piccioni, J. Scott,
R.J. Tapper
H.H. Wills Physics Laboratory, University of Bristol,
Bristol, U.K. o r
M. Capua,
A. Mastroberardino,
M. Schioppa,
G. Susinno
Calabria University,
Physics Dept.and INFN, Cosenza, Italy f
H.Y. Jeoung,
J.Y. Kim,
J.H. Lee,
I.T. Lim,
K.J. Ma,
M.Y. Pac10
Chonnam National University, Kwangju, Korea h
A. Caldwell,
N. Cartiglia,
Z. Jing,
W. Liu,
B. Mellado,
J.A. Parsons,
S. Ritz11,
R. Sacchi,
S. Sampson, F. Sciulli,
Q. Zhu12
Columbia University, Nevis Labs.,
Irvington on Hudson, N.Y., USA q
P. Borzemski,
J. Chwastowski,
A. Eskreys,
J. Figiel,
K. Klimek,
K. Olkiewicz,
M.B. Przybycień,
L. Zawiejski
Inst. of Nuclear Physics, Cracow, Poland j
L. Adamczyk13,
B. Bednarek,
K. Jeleń,
D. Kisielewska,
A.M. Kowal,
T. Kowalski,
M. Przybycień,
E. Rulikowska-Zarȩbska,
L. Suszycki,
J. Zaja̧c
Faculty of Physics and Nuclear Techniques,
Academy of Mining and Metallurgy, Cracow, Poland j
Z. Duliński,
A. Kotański
Jagellonian Univ., Dept. of Physics, Cracow, Poland k
L.A.T. Bauerdick,
U. Behrens,
J.K. Bienlein,
C. Burgard,
K. Desler,
G. Drews,
A. Fox-Murphy,
U. Fricke,
F. Goebel,
P. Göttlicher,
R. Graciani,
T. Haas,
W. Hain,
G.F. Hartner,
D. Hasell14,
K. Hebbel,
K.F. Johnson15,
M. Kasemann16,
W. Koch,
U. Kötz,
H. Kowalski,
L. Lindemann,
B. Löhr,
M. Martínez,
J. Milewski17,
M. Milite,
T. Monteiro18,
M. Moritz,
D. Notz,
F. Pelucchi,
K. Piotrzkowski,
M. Rohde,
P.R.B. Saull,
A.A. Savin,
U. Schneekloth,
O. Schwarzer19,
F. Selonke,
M. Sievers,
S. Stonjek,
E. Tassi,
G. Wolf,
U. Wollmer,
C. Youngman,
W. Zeuner
Deutsches Elektronen-Synchrotron DESY, Hamburg, Germany
B.D. Burow20,
C. Coldewey,
H.J. Grabosch,
A. Lopez-Duran Viani,
A. Meyer,
K. Mönig,
S. Schlenstedt,
P.B. Straub
DESY Zeuthen, Zeuthen, Germany
G. Barbagli,
E. Gallo,
P. Pelfer
University and INFN, Florence, Italy f
G. Maccarrone,
L. Votano
INFN, Laboratori Nazionali di Frascati, Frascati, Italy f
A. Bamberger,
S. Eisenhardt21,
P. Markun,
H. Raach,
S. Wölfle
Fakultät für Physik der Universität Freiburg i.Br.,
Freiburg i.Br., Germany c
N.H. Brook22,
P.J. Bussey,
A.T. Doyle,
S.W. Lee,
N. Macdonald,
G.J. McCance,
D.H. Saxon,
L.E. Sinclair,
I.O. Skillicorn,
E. Strickland,
R. Waugh
Dept. of Physics and Astronomy, University of Glasgow,
Glasgow, U.K. o
I. Bohnet,
N. Gendner, U. Holm,
A. Meyer-Larsen,
H. Salehi,
K. Wick
Hamburg University, I. Institute of Exp. Physics, Hamburg,
Germany c
A. Garfagnini,
I. Gialas23,
L.K. Gladilin24,
D. Kçira25,
R. Klanner, E. Lohrmann,
G. Poelz,
F. Zetsche
Hamburg University, II. Institute of Exp. Physics, Hamburg,
Germany c
T.C. Bacon,
J.E. Cole,
G. Howell,
L. Lamberti26,
K.R. Long,
D.B. Miller,
A. Prinias27,
J.K. Sedgbeer, D. Sideris,
A.D. Tapper,
R. Walker
Imperial College London, High Energy Nuclear Physics Group,
London, U.K. o
U. Mallik,
S.M. Wang
University of Iowa, Physics and Astronomy Dept.,
Iowa City, USA p
P. Cloth,
D. Filges
Forschungszentrum Jülich, Institut für Kernphysik,
Jülich, Germany
T. Ishii,
M. Kuze,
I. Suzuki28,
K. Tokushuku29,
S. Yamada,
K. Yamauchi,
Y. Yamazaki
Institute of Particle and Nuclear Studies, KEK,
Tsukuba, Japan g s
S.H. Ahn,
S.H. An,
S.J. Hong,
S.B. Lee,
S.W. Nam30,
S.K. Park
Korea University, Seoul, Korea h
H. Lim,
I.H. Park,
D. Son
Kyungpook National University, Taegu, Korea h
F. Barreiro,
J.P. Fernández,
G. García,
C. Glasman31,
J.M. Hernández32,
L. Labarga,
J. del Peso,
J. Puga,
I. Redondo33,
J. Terrón
Univer. Autónoma Madrid,
Depto de Física Teórica, Madrid, Spain n
F. Corriveau,
D.S. Hanna,
J. Hartmann34,
W.N. Murray6,
A. Ochs,
S. Padhi,
M. Riveline,
D.G. Stairs,
M. St-Laurent,
M. Wing
McGill University, Dept. of Physics,
Montréal, Québec, Canada a b
T. Tsurugai
Meiji Gakuin University, Faculty of General Education, Yokohama, Japan
V. Bashkirov35,
B.A. Dolgoshein
Moscow Engineering Physics Institute, Moscow, Russia l
G.L. Bashindzhagyan,
P.F. Ermolov,
Yu.A. Golubkov,
L.A. Khein,
N.A. Korotkova,
I.A. Korzhavina, V.A. Kuzmin,
O.Yu. Lukina,
A.S. Proskuryakov,
L.M. Shcheglova36,
A.N. Solomin36,
S.A. Zotkin
Moscow State University, Institute of Nuclear Physics,
Moscow, Russia m
C. Bokel, M. Botje,
N. Brümmer,
J. Engelen,
E. Koffeman,
P. Kooijman,
A. van Sighem,
H. Tiecke,
N. Tuning,
J.J. Velthuis,
W. Verkerke,
J. Vossebeld,
L. Wiggers,
E. de Wolf
NIKHEF and University of Amsterdam, Amsterdam, Netherlands i
D. Acosta37,
B. Bylsma,
L.S. Durkin,
J. Gilmore,
C.M. Ginsburg,
C.L. Kim,
T.Y. Ling,
P. Nylander
Ohio State University, Physics Department,
Columbus, Ohio, USA p
H.E. Blaikley,
S. Boogert,
R.J. Cashmore18,
A.M. Cooper-Sarkar,
R.C.E. Devenish,
J.K. Edmonds,
J. Große-Knetter38,
N. Harnew,
T. Matsushita,
V.A. Noyes39,
A. Quadt18,
O. Ruske,
M.R. Sutton,
R. Walczak,
D.S. Waters
Department of Physics, University of Oxford,
Oxford, U.K. o s
A. Bertolin,
R. Brugnera,
R. Carlin,
F. Dal Corso,
S. Dondana,
U. Dosselli,
S. Dusini,
S. Limentani,
M. Morandin,
M. Posocco,
L. Stanco,
R. Stroili,
C. Voci
Dipartimento di Fisica dell’ Università and INFN,
Padova, Italy f
L. Iannotti40,
B.Y. Oh,
J.R. Okrasiński,
W.S. Toothacker,
J.J. Whitmore
Pennsylvania State University, Dept. of Physics,
University Park, PA, USA q
Y. Iga
Polytechnic University, Sagamihara, Japan g
G. D’Agostini,
G. Marini,
A. Nigro,
M. Raso
Dipartimento di Fisica, Univ. ’La Sapienza’ and INFN,
Rome, Italy
C. Cormack,
J.C. Hart,
N.A. McCubbin,
T.P. Shah
Rutherford Appleton Laboratory, Chilton, Didcot, Oxon,
U.K. o
D. Epperson,
C. Heusch,
H.F.-W. Sadrozinski,
A. Seiden,
R. Wichmann,
D.C. Williams
University of California, Santa Cruz, CA, USA p
N. Pavel
Fachbereich Physik der Universität-Gesamthochschule
Siegen, Germany c
H. Abramowicz41,
S. Dagan42,
S. Kananov42,
A. Kreisel,
A. Levy42,
A. Schechter
Raymond and Beverly Sackler Faculty of Exact Sciences,
School of Physics, Tel-Aviv University,
Tel-Aviv, Israel e
T. Abe,
T. Fusayasu,
M. Inuzuka,
K. Nagano,
K. Umemori,
T. Yamashita
Department of Physics, University of Tokyo,
Tokyo, Japan g
R. Hamatsu,
T. Hirose,
K. Homma43,
S. Kitamura44,
T. Nishimura
Tokyo Metropolitan University, Dept. of Physics,
Tokyo, Japan g
M. Arneodo45,
R. Cirio,
M. Costa,
M.I. Ferrero,
S. Maselli,
V. Monaco,
C. Peroni,
M.C. Petrucci,
M. Ruspa,
A. Solano,
A. Staiano
Università di Torino, Dipartimento di Fisica Sperimentale
and INFN, Torino, Italy f
M. Dardo
II Faculty of Sciences, Torino University and INFN -
Alessandria, Italy f
D.C. Bailey,
C.-P. Fagerstroem,
R. Galea,
T. Koop,
G.M. Levman,
J.F. Martin,
R.S. Orr,
S. Polenz,
A. Sabetfakhri,
D. Simmons
University of Toronto, Dept. of Physics, Toronto, Ont.,
Canada a
J.M. Butterworth, C.D. Catterall,
M.E. Hayes,
E.A. Heaphy,
T.W. Jones,
J.B. Lane
University College London, Physics and Astronomy Dept.,
London, U.K. o
J. Ciborowski,
G. Grzelak46,
R.J. Nowak,
J.M. Pawlak,
R. Pawlak,
B. Smalska,
T. Tymieniecka,
A.K. Wróblewski,
J.A. Zakrzewski,
A.F. Żarnecki
Warsaw University, Institute of Experimental Physics,
Warsaw, Poland j
M. Adamus,
T. Gadaj
Institute for Nuclear Studies, Warsaw, Poland j
O. Deppe,
Y. Eisenberg42,
D. Hochman,
U. Karshon42
Weizmann Institute, Department of Particle Physics, Rehovot,
Israel d
W.F. Badgett,
D. Chapin,
R. Cross,
C. Foudas,
S. Mattingly,
D.D. Reeder,
W.H. Smith,
A. Vaiciulis47,
T. Wildschek,
M. Wodarczyk
University of Wisconsin, Dept. of Physics,
Madison, WI, USA p
A. Deshpande,
S. Dhawan,
V.W. Hughes
Yale University, Department of Physics,
New Haven, CT, USA p
S. Bhadra,
W.R. Frisken,
R. Hall-Wilton,
M. Khakzad,
S. Menary,
W.B. Schmidke
York University, Dept. of Physics, Toronto, Ont.,
Canada a
1 now visiting scientist at DESY
2 also at IROE Florence, Italy
3 now at Univ. of Salerno and INFN Napoli, Italy
4 also at DESY
5 supported by Worldlab, Lausanne, Switzerland
6 now a self-employed consultant
7 now at Spectral Design GmbH, Bremen
8 now at EDS Electronic Data Systems GmbH, Troisdorf, Germany
9 also at University of Hamburg, Alexander von
Humboldt Research Award
10 now at Dongshin University, Naju, Korea
11 now at NASA Goddard Space Flight Center, Greenbelt, MD
20771, USA
12 now at Greenway Trading LLC
13 supported by the Polish State Committee for
Scientific Research, grant No. 2P03B14912
14 now at Massachusetts Institute of Technology, Cambridge, MA, USA
15 visitor from Florida State University
16 now at Fermilab, Batavia, IL, USA
17 now at ATM, Warsaw, Poland
18 now at CERN
19 now at ESG, Munich
20 now an independent researcher in computing
21 now at University of Edinburgh, Edinburgh, U.K.
22 PPARC Advanced fellow
23 visitor of Univ. of Crete, Greece,
partially supported by DAAD, Bonn - Kz. A/98/16764
24 on leave from MSU, supported by the GIF,
contract I-0444-176.07/95
25 supported by DAAD, Bonn - Kz. A/98/12712
26 supported by an EC fellowship
27 PPARC Post-doctoral fellow
28 now at Osaka Univ., Osaka, Japan
29 also at University of Tokyo
30 now at Wayne State University, Detroit
31 supported by an EC fellowship number ERBFMBICT 972523
32 now at HERA-B/DESY supported by an EC fellowship
No.ERBFMBICT 982981
33 supported by the Comunidad Autonoma de Madrid
34 now at debis Systemhaus, Bonn, Germany
35 now at Loma Linda University, Loma Linda, CA, USA
36 partially supported by the Foundation for German-Russian Collaboration DFG-RFBR
(grant no. 436 RUS 113/248/3 and no. 436 RUS 113/248/2)
37 now at University of Florida, Gainesville, FL, USA
38 supported by the Feodor Lynen Program of the Alexander
von Humboldt foundation
39 now with Physics World, Dirac House, Bristol, U.K.
40 partly supported by Tel Aviv University
41 an Alexander von Humboldt Fellow at University of Hamburg
42 supported by a MINERVA Fellowship
43 now at ICEPP, Univ. of Tokyo, Tokyo, Japan
44 present address: Tokyo Metropolitan University of
Health Sciences, Tokyo 116-8551, Japan
45 now also at Università del Piemonte Orientale, I-28100 Novara,
Italy, and Alexander von
Humboldt fellow at the
University of Hamburg
46 supported by the Polish State
Committee for Scientific Research, grant No. 2P03B09308
47 now at University of Rochester, Rochester, NY, USA
| a | supported by the Natural Sciences and Engineering Research Council of Canada (NSERC) |
|---|---|
| b | supported by the FCAR of Québec, Canada |
| c | supported by the German Federal Ministry for Education and Science, Research and Technology (BMBF), under contract numbers 057BN19P, 057FR19P, 057HH19P, 057HH29P, 057SI75I |
| d | supported by the MINERVA Gesellschaft für Forschung GmbH, the German Israeli Foundation, and by the Israel Ministry of Science |
| e | supported by the German-Israeli Foundation, the Israel Science Foundation, the U.S.-Israel Binational Science Foundation, and by the Israel Ministry of Science |
| f | supported by the Italian National Institute for Nuclear Physics (INFN) |
| g | supported by the Japanese Ministry of Education, Science and Culture (the Monbusho) and its grants for Scientific Research |
| h | supported by the Korean Ministry of Education and Korea Science and Engineering Foundation |
| i | supported by the Netherlands Foundation for Research on Matter (FOM) |
| j | supported by the Polish State Committee for Scientific Research, grant No. 115/E-343/SPUB/P03/154/98, 2P03B03216, 2P03B04616, 2P03B10412, 2P03B05315, 2P03B03517, and by the German Federal Ministry of Education and Science, Research and Technology (BMBF) |
| k | supported by the Polish State Committee for Scientific Research (grant No. 2P03B08614 and 2P03B06116) |
| l | partially supported by the German Federal Ministry for Education and Science, Research and Technology (BMBF) |
| m | supported by the Fund for Fundamental Research of Russian Ministry for Science and Education and by the German Federal Ministry for Education and Science, Research and Technology (BMBF) |
| n | supported by the Spanish Ministry of Education and Science through funds provided by CICYT |
| o | supported by the Particle Physics and Astronomy Research Council |
| p | supported by the US Department of Energy |
| q | supported by the US National Science Foundation |
| r | partially supported by the British Council, ARC Project 0867.00 |
| s | partially supported by the British Council, Collaborative Research Project, |
| TOK/880/11/15 |
1 Introduction
The HERA collider has made possible the exploration of deep inelastic scattering (DIS) in a new kinematic region, resulting in discoveries such as the rapid rise of the parton densities in the proton at low -Bjorken [1] and diffraction in DIS [2]. First measurements of charged and neutral-current (NC) deep inelastic electron-proton scattering were made in a previously unexplored region of large [3], where is the negative square of the four-momentum transfer between the electron and proton. Based on their 1994 –1996 data, both the H1 and ZEUS collaborations have reported [4, 5] more NC events than expected from the Standard Model at high and high . These observations have prompted considerable discussion in the particle-physics community as possible evidence for anomalies in the parton momentum distributions of the proton or of physics beyond the Standard Model.
This paper presents measurements at HERA of the NC deep inelastic positron-proton scattering differential cross-sections for 400 and and for 400, 2500, and 10000 , and their comparison to Standard Model predictions. This analysis is not optimized for the search for narrow lepton-hadron resonances. The measurements are based on 47.7 pb-1 of data collected by ZEUS from 1994 –1997 during which HERA collided 27.5 positrons with 820 protons, yielding a center-of-mass energy . The highest under study, 51200 , is much larger than the square of the -boson mass so that effects of exchange are visible.
2 Standard Model prediction
The electroweak Born–level NC DIS differential cross-section, , for the reaction can be expressed [6] as
| (1) |
where is the Bjorken scaling variable, is the QED coupling constant, and with . The structure functions and for longitudinally unpolarized beams may be described in leading order QCD as sums over the quark flavor of the product of electroweak quark couplings and quark momentum distributions in the proton
where and () are the quark (anti-quark) momentum distributions. In leading order QCD, we have . The functions and can be written as
where the weak couplings, and , are functions of the weak isospin, () for (), and the weak mixing angle, ; is the electric charge in units of the positron charge; and is proportional to the ratio of -boson and photon propagators
| (4) |
All cross-section predictions in this paper are calculated using next-to-leading order (NLO) QCD where the longitudinal structure function [7]. The contribution of to is predicted to be approximately averaged over the kinematic range considered in this paper. However, in the region of small at the lower end of the range the contribution to the cross-sections can be as large as .
Uncertainties in the predicted cross-section arise from three sources: electroweak parameters, electroweak radiative corrections, and the parton momentum distributions including their higher order QCD corrections. The electroweak parameters have been measured to high precision by other experiments [8, 9] and contribute less than uncertainty to the predicted cross-section in the full kinematic range measured at HERA [10]. Radiative corrections for initial- and final-state radiation, vertex and propagator corrections, and two-boson exchange have been calculated to at least first order [11, 12]. Higher order corrections for the kinematic region explored in this paper are expected to be less than [13]. This leaves the parton momentum distributions as the primary source of uncertainty in the predicted cross-section.
Parton momentum distributions have been determined by several groups (GRV [14], MRS [15, 16], CTEQ [17, 18]) by parameterizing the distributions at some fixed and extrapolating the results to higher using the DGLAP QCD evolution equations [19]. The parameters are fitted to data from lower energy fixed-target DIS experiments and from HERA, and, in addition, to data measured at the TEVATRON on lepton-pair production (Drell-Yan), direct photon production, W production, and jet cross-sections. Note that the HERA data included in these parameterizations make their most significant contribution at and have relatively little influence on the predicted cross-sections used in this paper. The sources of uncertainty in these fits can be divided into two main groups: uncertainties in the measurements and uncertainties in the fit itself. For the former, the statistical and systematic uncertainties are available from each experiment. For the latter, uncertainties due to the QCD evolution were estimated by varying the fit assumptions, such as the value of and higher twist.
Although the comprehensive parton momentum distribution fits from GRV, MRS, and CTEQ make extensive use of available data, they lack a complete estimate of uncertainties in the distributions. To obtain such an estimate, a NLO QCD fit was performed [20] to the DIS measurements of for proton and deuteron data from SLAC [21], BCDMS [22], NMC [23], E665 [24], H1 and ZEUS [25, 26], the measurements of from neutrino measurements by CCFR [27], and the data from E866 [28]. Included in the fit were statistical and correlated systematic errors from each experiment. Also considered were the effects of a change of from 0.113 to 0.123, a variation in the strange quark content of the proton, a variation of the factorization and renormalization scales in the range , and of corrections for nuclear effects, all of which produced uncertainties of typically less than . The results are in good agreement with the MRST [16] and CTEQ4 [18] fits, and differences are typically smaller than the extracted uncertainties. The fit yields uncertainties in the cross-section of approximately for = 400 and at the highest under study.
Other uncertainties were also investigated. For example, charm-threshold effects, calculated from three different models of charm evolution in the proton as supplied by CTEQ [29], produced cross-sections that differed by less than . An analysis of the stability of perturbative calculations of the production of bottom- and charm-quarks at HERA [30] showed negligible effects. The MRST [16] fit incorporating the latest prompt photon data at high from E706 [31] and data from E866 [28] produced cross-sections that were lower than those calculated using CTEQ4 by at = 400 , increasing to a maximum of at = 10000 . The CTEQ4HJ [18] fit, specifically tuned to reproduce the jet high transverse energy cross-section reported by CDF [32], produced changes in the cross-section of less than except at the highest = 50000 , where it yielded an increase of . The CTEQ5 [33] fit incorporating more data than the CTEQ4 fit, in particular introducing an improved handling of and using E866 data and a measurement of charge asymmetry in W-production at the TEVATRON [34], gave cross-sections that were higher by at = 400 and lower by at = 10000 .
We conclude from these studies that the parton densities give a total uncertainty on the Standard Model prediction of the NC DIS differential cross-section of for = 400 increasing to at the highest in the –range covered by this measurement. In the following, uncertainties in the parton momentum distributions are taken from the ZEUS NLO QCD fit [20].
3 The ZEUS experiment
ZEUS [35] is a multipurpose magnetic detector designed to measure interactions at HERA. The primary components used for this analysis are the compensating uranium-scintillator calorimeter (CAL), the central tracking detector (CTD), and the luminosity detector.
The ZEUS coordinate system is right-handed with the axis pointing in the direction of the proton beam (forward) and the axis pointing horizontally toward the center of HERA. The polar angle is zero in the direction.
The CAL [36] covers of the total solid angle. It is divided into three parts with a corresponding division in as viewed from the nominal interaction point: forward (FCAL, ), barrel (BCAL, ), and rear (RCAL, ). Each section is subdivided into towers which subtend solid angles between 0.006 and 0.04 steradian. Each tower is longitudinally segmented into an electromagnetic (EMC) and one (RCAL) or two (FCAL, BCAL) hadronic sections (HAC). The electromagnetic section of each tower is further subdivided transversely into two (RCAL) or four (BCAL, FCAL) cells. Under test beam conditions the calorimeter resolutions are for electrons and for hadrons. The calorimeter has a time resolution of better than 1 ns for energy deposits above 4.5 .
A presampler detector is mounted in front of FCAL and RCAL. It consists of scintillator tiles matching the calorimeter towers and measures signals from particle showers in the material between the interaction point and the calorimeter.
Tracking information is provided by the CTD [37] operating in a 1.43 T solenoidal magnetic field. The interaction vertex is measured with a typical resolution along (transverse to) the beam direction of 0.4 (0.1) cm. The CTD is used to reconstruct the momenta of tracks in the polar angle region . The transverse momentum () resolution for full-length tracks can be parameterized as , with in GeV.
The luminosity is measured using the Bethe-Heitler reaction [38]. The resulting small angle energetic photons are measured by the luminosity monitor, a lead-scintillator calorimeter placed in the HERA tunnel 107 m from the interaction point in the positron beam direction.
4 Monte Carlo simulation
Monte Carlo simulations (MC) are used to determine the efficiency for selecting events, to determine the accuracy of kinematic reconstruction, to estimate the background rate, and to extrapolate the measured cross-sections to the full kinematic phase space. A sufficient number of events is generated to ensure that errors from MC statistics can be neglected. The MC samples are normalized to the total integrated luminosity of the data.
The ZEUS detector response is simulated with a program based on GEANT [39]. The generated events are passed through the simulated detector, subjected to the same trigger requirements as the data, and processed by the same reconstruction programs.
The vertex distribution is a crucial input to the MC as this is necessary to estimate the event selection efficiency. The latter is strongly correlated with the -coordinate of the event vertex, as the reconstructed values of , and other quantities depend on the measured vertex position. For the 1995 to 1997 data sets, the underlying distribution of the -coordinate of the event vertex is determined using a minimum-bias sample of low neutral-current DIS events. For 1994 data this method is compared to the estimate from a special minimum-bias soft photoproduction trigger, where very good agreement in shape is found. The uncertainty in the shape of the vertex -distribution is related to the fraction of collisions from RF buckets adjacent to that containing the main proton beam. The effect of this uncertainty on the normalization of the data sample in the vertex range -50 to +50 cm is estimated to be less than .
NC DIS events including radiative effects are simulated using the HERACLES 4.5.2 [11] program with the DJANGO6 2.4 [40] interface to the hadronization programs. In HERACLES, corrections for initial- and final-state radiation, vertex and propagator corrections, and two-boson exchange are included. The QCD cascade and the hadronic final state are simulated using the color-dipole model of ARIADNE 4.08 [41] and, as a systematic check, with the MEPS model of LEPTO 6.5 [42]. Both programs use the Lund string model of JETSET 7.4 [43] for the hadronization.
Photoproduction background is estimated using events simulated with HERWIG [44]. In addition, a large sample of prompt photon events (), is generated with HERWIG.
5 Reconstruction of kinematic variables
5.1 Event characteristics
Neutral-current DIS at the high- values discussed here produces striking events, relatively easy to distinguish from the potentially large backgrounds of quasi-real photoproduction ( 0) and beam-gas interactions. The events are characterized by a high-energy isolated positron in the detector. For 400 , most of the positrons have an energy near the positron beam energy and are restricted to a polar angle below . As increases, the positrons are produced with higher energies, up to several hundred GeV, and at smaller polar angles.
The variables , and are used for event selection. These are defined as
| (5) |
where the sum runs over all calorimeter energy deposits (uncorrected in the trigger, but corrected energies in the offline analysis as discussed below) with polar angle . At the generator level GeV, i.e. twice the positron beam energy, which follows from energy-momentum conservation. Undetected particles which escape through the forward beam hole give a negligible change in while particle loss through the the rear beam hole, e.g. from initial state bremsstrahlung or for photoproduction background, can lead to a substantial reduction of . The net transverse momentum, , and the transverse energy, , are defined by
| (6) | ||||||
| (7) |
where is the azimuthal angle and the sums run, as above, over all energy deposits in the calorimeter. High- events in which the positron strikes the BCAL or FCAL ( 1000 ) are characterized by large .
In the determination of the DIS kinematics, the CAL energy deposits are separated into those associated with the identified scattered positron, and all other energy deposits. The sum of the latter is referred to as the hadronic energy.
5.2 The double-angle method
, , and are measured using the double-angle method [45]
| (8) | ||||||
| (9) | ||||||
| (10) |
where () is the energy of the positron (proton) beam, is the polar angle of the scattered positron, and , in the naïve quark parton model picture of DIS, is the polar angle of the struck quark. The determination of the angles and is discussed in Sect. 5.3 and 5.4, respectively.
The double-angle method is essentially insensitive to errors in the absolute energy scale of the calorimeter. However it is sensitive to QED radiation and an accurate simulation of the hadronic final state is necessary. At 400 the hadronic final state is sufficiently energetic that model uncertainties of fragmentation and the treatment of the proton remnant are less important than at lower .
To validate the performance of the double-angle method, the reconstructed kinematic variables of MC events are compared to the true hadron variables , and as defined by the four-momentum transfer to the hadronic system
| (11) |
where is the four-momentum of the initial proton and . The resolution in the kinematic variables is determined accordingly (see Sect. 7) and demonstrates (not shown here) that the double-angle method performs better than other methods for 400 .
5.3 Positron identification
A key signature of the events under study is the presence of an isolated high-energy positron. In order to identify and reconstruct the positron, while rejecting events in which other final state particles mimic it, an algorithm is used which combines calorimeter and CTD information.
In a first step, calorimeter “clusters” are formed by grouping all CAL cells with energy depositions into cones relative to the event interaction point, which are centered around cells with a local energy maximum [46]. All clusters are treated as positron candidates. The cluster energy, , is the sum of the cell energies belonging to the cluster. The center of each cluster is calculated by weighting each tower member by a logarithmic function of its energy. The cluster angle, , is set equal to the polar angle obtained from the center position of the cluster and the event vertex obtained from the tracks measured with the CTD. For clusters with polar angle111We do not consider candidates with (which are also beyond the CTD acceptance limit), since they correspond to values below the range of this analysis. within the CTD acceptance (), a matching track is required. A track is considered to match if the distance of closest approach (DCA) between the extrapolation of the track into the calorimeter and the position of the cluster center is less than cm, where the r.m.s. resolution in the DCA is 1.8 cm.
In the second step, several quantities, , are calculated for each positron candidate: the fraction of the cluster energy in the hadronic sections of the calorimeter; the parameters related to lateral energy profiles; and the total energy in all calorimeter cells not associated with the cluster but lying within a cone in pseudorapidity, , and azimuthal angle, , of radius , centered on the cluster. If a matching track is present, the polar and azimuthal angle differences between the track and the cluster position, and the quantity , where is the track momentum, are evaluated.
Finally, for each a probability is derived, designed to be uniformly distributed between zero and one for positrons. Candidates are accepted as positrons if the product of the exceeds a threshold determined from MC studies. Since the CAL energy resolution is better than that of the CTD for tracks above 10 , for accepted candidates, the positron energy, , is set equal to the cluster energy, , comprising typically six cells. The positron angle, , is determined from the associated track if the positron cluster is within the CTD acceptance, and otherwise set equal to . The resolution in is typically 0.1∘. Sect. 6.2 contains further selection criteria applied to the positron candidates.
5.4 Reconstruction of the hadronic final state
Energy depositions of the hadronic final state are used to evaluate the angle . For this purpose calorimeter clusters are used as just described. The angle is then calculated for the event according to
| (12) |
where and are calculated using (5) and (6) with sums running over the calorimeter clusters in the same manner as and , but excluding the positron.
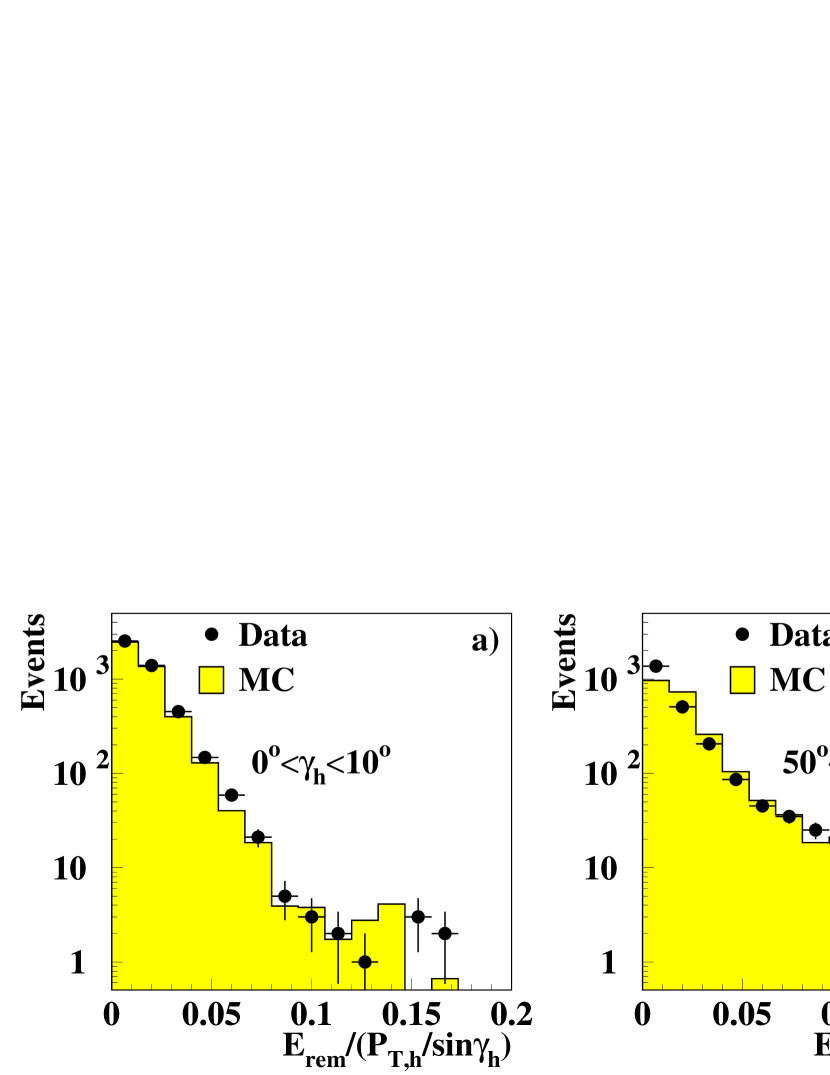
MC studies of the calorimeter response indicate that the uncorrected calculated with (12) is biased by redirected hadronic energy from interactions in material between the primary vertex and the calorimeter or by backsplash from the calorimeter (albedo)222High energy hadrons interacting in a calorimeter can produce with a non-negligible probability particles at large angles with respect to the direction of the main shower. Some of these particles travel backwards and generate energy deposits far away from their primary source in the calorimeter which is referred to as backsplash.. To minimize this bias, clusters with energy below 3 and with polar angles larger than are removed. The value of , which is a function of , is derived from a NC MC sample by requiring that less than of the clusters not related to the above effects be removed. This yields a reconstruction of closest to the true value as given by the MC. The agreement of the distribution of removed energies for different -ranges between data and MC is reasonable as shown in Fig. 1(a) and (b). After this first pass of cluster removal the value of is re-calculated and the procedure is repeated until it converges, typically after two or three passes. Removing calorimeter clusters in this manner substantially improves the resolution and bias of the double-angle variables for small values of (corresponding to small values of ) as shown from the ARIADNE MC in Fig. 1(c) and (d) and leaves them largely unchanged for large values of . A similar result is achieved with the LEPTO MC (not shown here).
5.5 Energy correction and calorimeter performance
Correction for energy loss: All energies of clusters from both the positron and the hadronic final state are corrected for energy loss in the material between the interaction point and the calorimeter. All hadronic clusters and the positron clusters in BCAL and FCAL are corrected based on the material maps implemented in the detector simulation package. The presampler is used to correct positrons entering the RCAL. This correction is based on the measured positron energy, the amount of material in front of the RCAL and the presampler signal.
Non-uniformity correction for positrons: In Fig. 2(a) the ratio of the positron energy corrected as described above to the double-angle prediction is shown. At boundaries of calorimeter cells and modules there are dips in the measured energy response. This effect is larger in data than in MC. To account for this effect a correction is obtained from fits to the non-uniformity patterns in the BCAL. After correction, the data are well reproduced by the MC as shown in Fig. 2(b). A similar correction is used for geometrical effects in the azimuthal angle.
Calorimeter energy scale: The uncertainty in the energy scale of the scattered positron is determined after applying the corrections described above. For scattered positrons in low DIS events ( due to the requirement ), the energy is strongly correlated with the scattering angle, and a comparison of the predicted energy to the measured energy in the calorimeter is made. This method is described in detail elsewhere [26]. In the range of , the momentum of the positrons can be determined by the CTD. The average track momentum minus calorimeter energy is used as an independent check of the energy measured in the CAL for energies up to 30 . For positrons with energies above 30 , or those scattered to extreme forward directions, a comparison of the energy predicted from double-angle variables to the measured energy is made. In kinematic regions where the other methods can be used to check the CAL energy scale, the double-angle results are in agreement with the other methods to better than . As a result of these studies, the uncertainty in the value of the energy of the scattered positron in the RCAL is at 10 , decreasing linearly to at 27.5 and above, in the BCAL and in the FCAL.
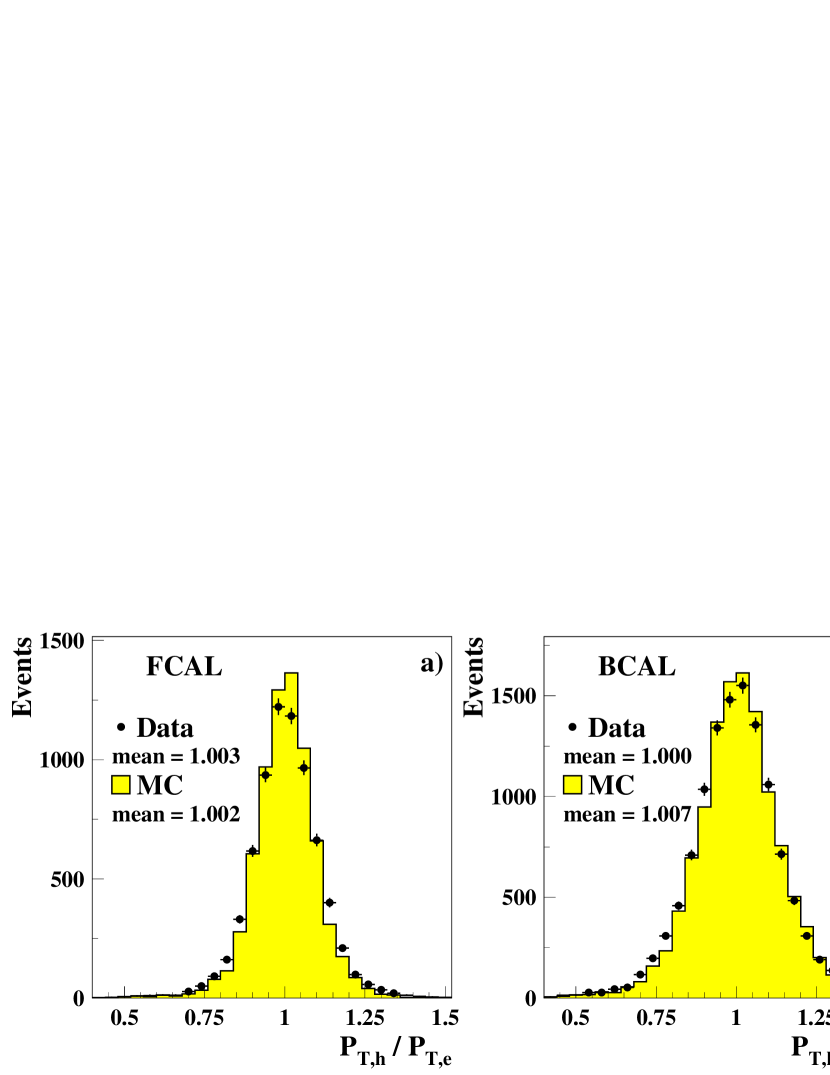
The uncertainty in the scale of the hadronic energy has been studied. After applying the corrections to the energy described above, the ratio of the hadronic transverse momentum, , to the transverse momentum carried by the positron found in the BCAL, is examined event by event. For transverse momenta above 20 , the ratio is to within both for data and MC, as expected from momentum conservation (see Fig. 3). For lower transverse energies, the ratio is below by up to several percent due to hadronic energy loss. The comparisons between MC predictions of the transverse momentum ratio and the data agree to within 1-. A comparison with corresponding results using the ratio of to the transverse momentum predicted from double-angle variables also shows good agreement. As a result of these studies, the uncertainty in the hadronic energy scale is determined to be in the FCAL and BCAL, of which comes from the uncertainty of the positron measurement. The dominant remaining uncertainty comes from comparison of MC results for simulations of hadronic final states using ARIADNE [41] and HERWIG [44]. The uncertainty is in the RCAL where the hadronic energy is lower than in FCAL and BCAL due to kinematic constraints.
Positron energy resolution: After all corrections, the resolution in positron energy is evaluated by comparing the width of the distribution of the ratio of corrected energy to the value predicted from the double-angle method. Since the resolution is smaller in the MC than in data, the MC energies in BCAL and RCAL are smeared accordingly. For RCAL a constant relative smearing of is applied while for BCAL the dependence of the resolution on the calorimeter non-uniformity is taken into account.
Hadronic energy resolution: A similar method, based on , is used to determine the resolution in hadronic energy. Again, the resolution is found to be smaller in the MC than in data. A smearing is applied accordingly to clusters in MC for all calorimeter parts.
5.6 Detector alignment
The polar and azimuthal angles of the scattered positron can be measured with the tracking detectors as well as with the calorimeter. Comparisons of the position of calorimeter non-uniformities resulting from the cell structure (see Sect. 5.5) and the extrapolated positron position from the CTD allow the BCAL and RCAL to be aligned in with respect to the CTD to 1 and to 2 mm, respectively, and to be aligned in transverse direction to 2 and to 1 mm, respectively.
6 Event selection
6.1 Trigger
The ZEUS trigger operates at three levels [35]. For the portions of the trigger relevant to this analysis, the requirements were strictest during 1997 and are described here. The first-level trigger requires a total electromagnetic energy of at least 3.4 in the RCAL or 4.8 in the BCAL, or 30 , where is the total transverse energy excluding the two rings of calorimeter towers nearest to the forward beampipe. The requirement is designed to tag high- events by their large while rejecting beam-gas background having large energy deposits at low polar angles. The major requirement at the second-level trigger is 29 , where is the energy measured in the luminosity monitor. This requirement suppresses photoproduction. Backgrounds are further reduced at the second-level trigger by removing events with calorimeter timing inconsistent with an interaction. For the third-level trigger, events are reconstructed on a computer farm, and the requirements are similar to the offline cuts described below, though looser and using a simpler and generally more efficient (but less pure) positron finder.
6.2 Offline selection
The following criteria are applied offline (see also Sect. 5 and [5]):
-
•
To ensure that event quantities can be accurately determined, a reconstructed vertex with cm is required, a range consistent with the interaction region.
-
•
To suppress photoproduction events where the scattered positron escapes through the beam hole in the RCAL, is required to be greater than 38 . This cut also reduces the number of events with initial-state QED radiation. The requirement removes cosmic ray background.
-
•
Positrons are identified based on calorimeter cluster quantities and tracking.
-
–
To ensure high purity, the positron is required to have an energy of at least 10 ; in this case the identification efficiency exceeds , as shown by MC studies.
-
–
To reduce background, isolated positrons are selected by requiring no more than 5 in calorimeter cells not associated with the scattered positron in an cone of radius 0.8 centered on the positron.
-
–
In addition, each positron with must be matched to a charged track of at least 5 momentum.
-
–
For positrons beyond the forward tracking acceptance (), the tracking requirement in the positron selection is replaced by a cut on the transverse momentum of the positron and by the requirement .
-
–
A fiducial volume cut is applied to the positron position. This excludes the upper part of the central RCAL area ( cm2) occluded by the cryogenic supply for the solenoid magnet as well as the transition region between the CAL parts corresponding to a polar angle of the positron of and .
If more than one positron candidate in an event passes these cuts ( of the events), the one with the highest probability is assumed to be the DIS positron.
-
–
-
•
Elastic Compton scattering events () are removed by searching for an additional photon candidate and discarding the event if this and the positron candidate account for all the calorimeter energy in the event except for at most 2 .
-
•
To further reduce background from photoproduction, estimated from the positron energy and angle is required to be .
-
•
The net transverse momentum is expected to be close to zero and is measured with an error approximately proportional to . To remove cosmic rays and beam-related background, is required to be less than .
The efficiency of these cuts for selecting DIS events with 400 as determined by MC is, on average, . It is approximately uniform over the kinematic phase space except for the region of high and low where the efficiency decreases due to the positron energy requirement. Uncertainties in the simulation of the efficiency arising from the diffractive contribution to the cross-section which is not included in the MC are neglected since the diffractive contribution is small for 400 .
6.3 Final event sample
After the event selection 37438 events with 400 remain. Distributions from data and signal MC are compared in Fig. 4. Shown are the following: the positron energy; the momentum of the positron track; the energy not assigned to the positron in an cone of 0.8; the position of the event vertex; the -distribution; the scattering angle of the positron, ; and , the angle of the hadronic system as obtained from (12). Good agreement between data and MC is seen in most variables. Slight disagreements between data and MC at lower positron energies and at low values of may indicate simulation errors in either fragmentation or detector response and are accounted for in the systematic uncertainties (see Sect. 8).
The photoproduction background is estimated to be less than over the full phase space and less than at high . Background from prompt photon events is negligible.
Backgrounds not related to reactions, such as cosmic rays or beam-related background, are investigated by studying events in the tails of distributions of the calorimeter timing and of , and events from unpaired positron or proton bunches. No evidence for such background is observed and an upper limit of at low , rising to at high , is placed on any such contamination.
7 Cross-section determination
The single differential cross-sections are determined using bin-by-bin unfolding. The measured cross-section in a particular bin, , is determined from
| (13) |
where is the number of observed events in the bin, is the estimated number of background events, is the acceptance and is the integrated luminosity. The acceptance, defined from the MC as the number of events reconstructed within the bin divided by the number of events generated in that bin, derives from the selection efficiency and the purity in the bin.
The measured cross-section includes the radiative effects discussed in Sect. 2. The correction factor to provide the Born level cross-section is defined as
| (14) |
The numerator is obtained by numerically integrating (1) over the bin with fixed , = 91.175 , and = 0.232. The value of , the bin cross-section including radiation, is calculated using the HERACLES MC. The measured Born level cross-section is then given by
| (15) |
Finally, the quoted differential cross-section, for example , is calculated as
| (16) |
A similar procedure is used for and . In this manner the effects of all the selection cuts are corrected (Sect. 6) and the cross-sections are extrapolated to the full kinematic range. In particular the MC is used to extrapolate beyond the -region restricted by the cut.
For the differential cross-section the selected events are divided into 20 bins in . The first 12 of these bins divide the range of 400 to 3200 into bins of equal width. The remaining 8 bins divide the range of 3200 to 51200 using bins that are twice as wide. For , the events are divided in into five bins per decade in the range for 400 , for 2500 and for 10000 . These limits restrict the analysis to a region of small bin-to-bin migration. To measure the differential cross-section , the selected events are divided into bins of width 0.05 for 400 and 2500 and bins twice as large for 10000 . The values at which and are quoted, and , are chosen to be near the logarithmic center of each bin. The cross-section is quoted at the center of each bin.
Typical bin purities are , where the purity quantifies migration effects and is defined as the ratio of the number of events generated and measured in the bin to the number of events measured in the bin.
For 400 , the resolution given by the r.m.s. of is approximately constant at . is slightly biased towards higher values, mainly due to the effect of initial-state QED radiation.
The distribution in has an r.m.s. of for . In the remaining part of the considered range the r.m.s. increases to . The distribution in () has an r.m.s. of 0.05, independent of .
The statistical errors are calculated using the square root of the number of measured events for and otherwise from Poisson confidence intervals around .
8 Systematic uncertainties
Systematic uncertainties associated with detector effects are estimated by re-calculating the cross-section after re-weighting and modifying the MC to account for discrepancies between data and MC in reconstruction and efficiencies. Cut values are varied where this method is not applicable. The individual uncertainties are added in quadrature separately for the positive and negative deviations from the nominal cross-section values to obtain the total systematic uncertainty. The uncertainty on the luminosity of the combined 1994 –1997 sample is and is not included in the total systematic uncertainty. The remaining uncertainties are discussed in detail below333Note that the limits of error referred to are on the absolute magnitude of the error.:
-
•
The main uncertainty in the trigger chain is expected to come from the first level. Re-weighting the MC efficiency to that derived from data results in systematic uncertainties below .
-
•
The positron identification efficiency predicted by the MC is checked with a data sample of NC DIS events selected using independent requirements such as high in the trigger and an isolated high- track which is associated with the scattered positron. The efficiency curves from MC and data agree to better than without a bias. For lower positron energies, the efficiency is checked using elastic QED Compton scattering events (see Sect. 6.2). The difference in the efficiencies between data and MC is found to be smaller than at the smallest electron energy. In addition, loose cuts for forward, high-energy positrons beyond the tracking acceptance are used to select candidates which are then inspected. The results are consistent with the MC.
-
•
The uncertainty in the positron energy scale (as described in Sect. 5.5) results in systematic variations in the cross-section of at high and in negligible uncertainties otherwise. Varying the positron identification efficiency according to the elastic QED Compton scattering events and the track finding efficiency, as derived from a comparison between data and MC, produces uncertainties of at most . The positron isolation requirement is estimated by varying the cut value by 2 and causes systematic uncertainties of up to . Uncertainties in the measurement of the positron angle produce a systematic variation of up to ; not using the fiducial cut resulted in variations of less than .
-
•
The uncertainty associated with the reconstruction of is investigated as follows: by varying the calorimeter energy scale separately for RCAL, BCAL, FCAL according to the energy scale uncertainty described in Sect. 5.5; by varying the parameter in the correction described in Sect. 5.4 in a range still compatible with an optimal reconstruction of ; by changing the energy of the calorimeter cells adjacent to the forward beampipe (and not associated with the current jet) based on the uncertainty estimated from a data-MC comparison reflecting uncertainties in the simulation of the proton remnant; by excluding events with rad to check for the effect of loss of hadronic energy through the forward beam hole of the calorimeter; by not using the modified hadronic energy resolution in the MC (see Sect. 5.5); and by exploring the differences between predictions from the LEPTO [42] and ARIADNE [41] models of fragmentation. The last mentioned effect gives the dominating contribution to the systematic uncertainty. The net result is an estimated systematic uncertainty of less than in the differential cross-sections at low and low , increasing to approximately at high or high .
-
•
The uncertainty arising from the limited knowledge of the shape of the vertex distribution in the coordinate (see Sect. 4) is at most .
-
•
Systematic uncertainties due to background removal are estimated by varying the cuts on and in a range that changes the expected background by more than and varying the cut on such that signal events are strongly affected. The uncertainties in the cross-section are below for most of the kinematic range; they increase to at high due to the cut. The systematic uncertainty arising from a possible underestimation of the photoproduction background is obtained from the effect of doubling the background predicted from the MC. This results in negligible changes in the cross-sections for most of the kinematic range, except at high where a change of is found.
An important cross check is the determination of the cross-section using the positron variables [45] rather than the double-angle variables. The results from the two methods agree to better than for all points.
9 Results
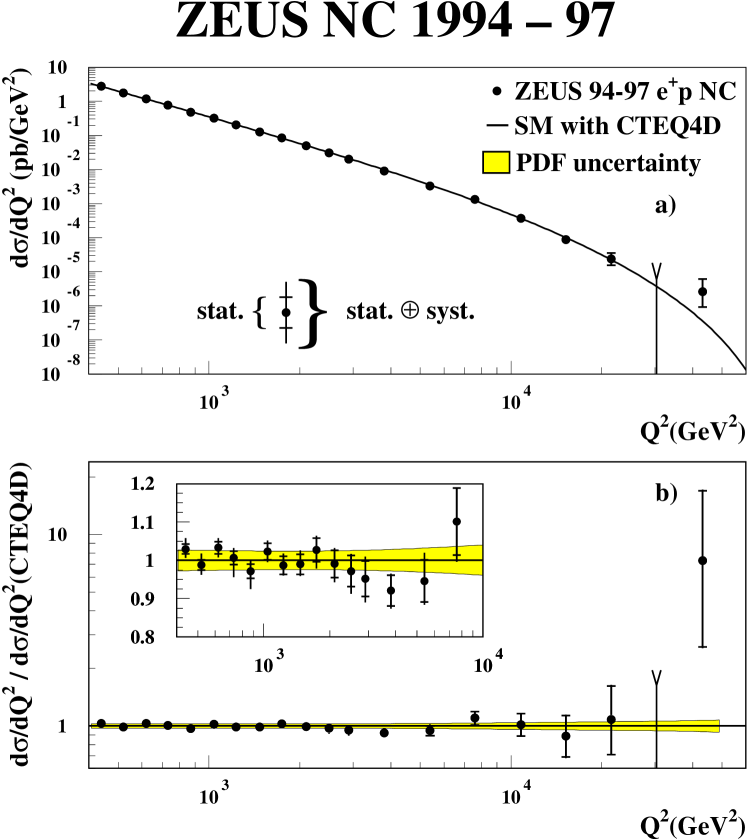
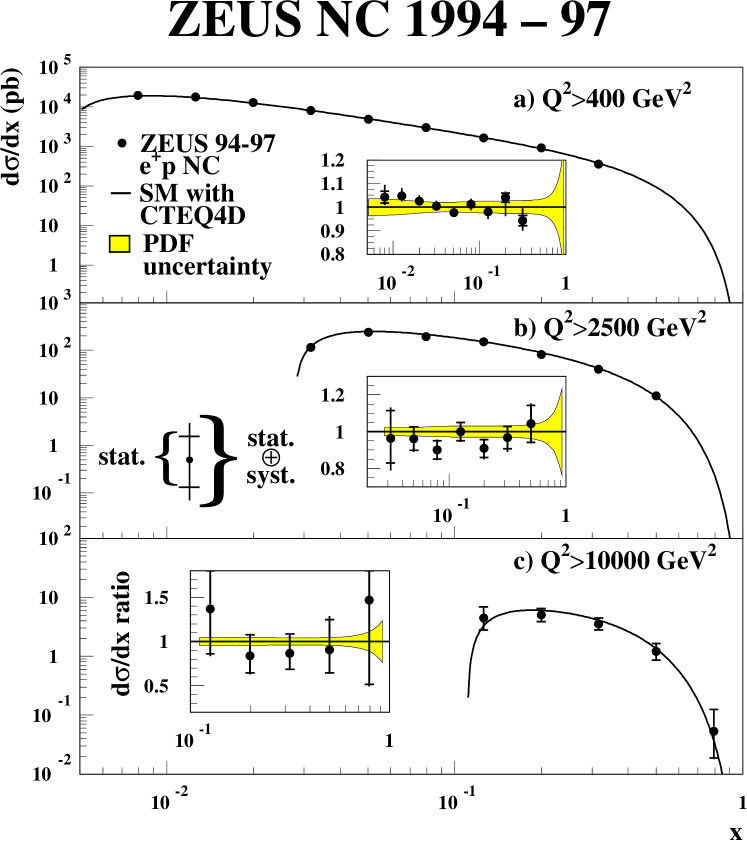
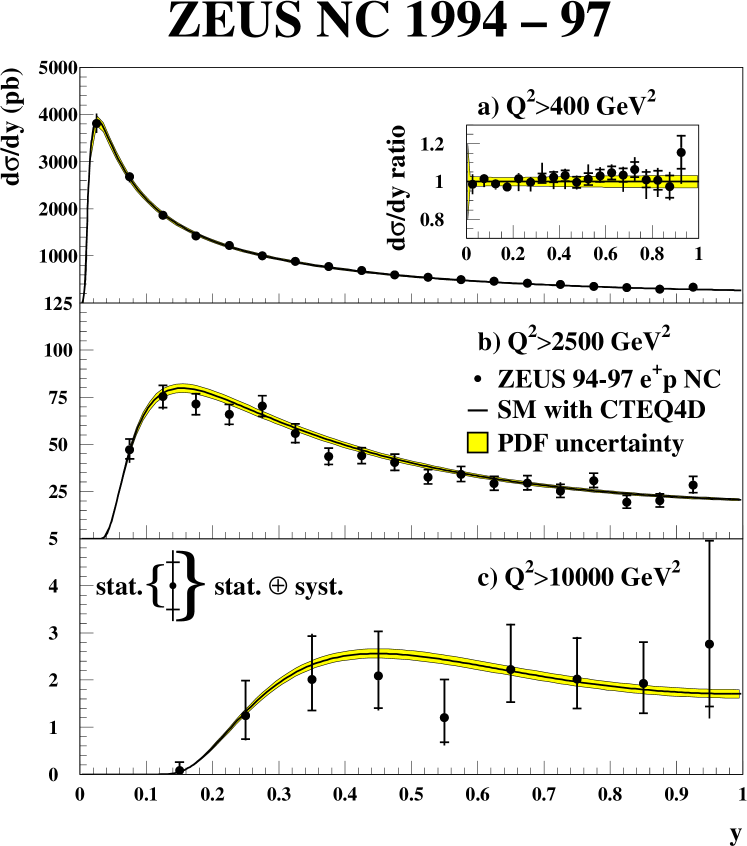
The differential cross-sections for NC scattering, , and are presented in Figs. 5 to 7 and Tables 1 to 4 as functions of , and , respectively. The cross-section decreases by six orders of magnitude between = 400 and 40000 . This decrease is dominated by the photon propagator. The cross-section is shown for different regions, above 400, 2500 and 10000 GeV2, respectively. A slow fall-off is observed towards followed by a rapid drop towards . The selection 10000 limits the NC process by kinematics to the region where the contribution from valence quarks () is expected to dominate. The cross-section is presented for the same regions in as used for . For 400 the bulk of the cross-section is concentrated at small values of . For 10000 the cross-section is approximately constant with .
The predictions of the Standard Model (solid curves with PDF uncertainties, see Sect. 2) give a good description of all measured cross-sections, except for in the highest bin with 36200 where two events are observed while 0.27 are predicted by the SM. These events were reported previously [5] as part of an excess seen at high and high , obtained from the first half of the data. No additional events were observed in the high- bin after doubling the integrated luminosity. As mentioned earlier, the present analysis is not optimized for the detection of narrow high-mass lepton-hadron resonances; an analysis of this type is in progress.
NC scattering at high is sensitive to the contribution from the . According to the SM, the contribution reduces the cross-section for 10000 by about . The presence of the contribution in NC deep inelastic scattering was first demonstrated at around 1-2 through the observation of an asymmetry in the scattering of polarized electrons on deuterons [47]. The high precision data from the present analysis provide sensitivity in the inclusive NC DIS cross-section to the contribution at high . This is of particular interest as this measurement in the space-like region is complementary to the time-like production of the in and annihilation and thus is an important test of the Standard Model. In Fig. 8 the measured cross-sections are compared with the SM predictions, varying the mass of in the propagator (see (4)), to values of GeV and infinity, while keeping the couplings fixed. Figure 8(a) shows the ratio of the measured cross-section to the prediction of the SM and Fig. 8(b) presents as a function of for 10000 . After separately normalizing the SM prediction with or without exchange to the data in the full range available (and thus essentially eliminating uncertainties arising from either the luminosity measurement or the PDFs), values are calculated from the cross-sections in a range sensitive to -exchange ( for and for 10000 ). Considering statistical errors only, the SM prediction yields 10.3 for 10 degrees of freedom, corresponding to a probability prob(SM). In contrast, omitting the contribution to the cross-section, yields 26.4, i.e. prob(SM without ). Taking into account each source of systematic uncertainties at a time induces variations in the range 8.9-11.8 (22-29) for the SM prediction with (without) exchange, implying prob(SM without ).
10 Summary
We have studied deep inelastic neutral-current scattering based on data collected during 1994 –1997 with a total luminosity of 47.7 pb-1. The differential cross-sections (for 400 51200 ) and , (for 400, 2500, 10000 ) have been measured with typical statistical and systematic errors of 3- for 10000 . The cross-section falls by six orders of magnitude between = 400 and 40000 . The predictions of the Standard Model are in very good agreement with the data. Complementing the observations of time-like contributions to fermion-antifermion annihilation, these data provide direct evidence for the presence of exchange in the space-like region explored by deep inelastic scattering.
Acknowledgments
This measurement was made possible by the inventiveness and the diligent efforts of the HERA machine group and the DESY computing staff. The strong support and encouragement of the DESY directorate has been invaluable. The design, construction, and installation of the ZEUS detector has been made possible by the ingenuity and dedicated effort of many people from inside DESY and from the home institutes who are not listed as authors. Their contributions are acknowledged with great appreciation.
This paper was completed shortly after the tragic and untimely death of Prof. Dr. B. H. Wiik, Chairman of the DESY directorate. All members of the ZEUS collaboration wish to acknowledge the remarkable rôle which he played in the success of both the HERA project and of the ZEUS experiment. His inspired scientific leadership, his warm personality and his friendship will be sorely missed by us all.
References
- [1] H1 Collab., I. Abt et al., Nucl. Phys. B407 (1993) 515; ZEUS Collab., M. Derrick et al., Phys. Lett. B316 (1993) 412; H1 Collab., T. Ahmed et al., Nucl. Phys. B439 (1995) 471; ZEUS Collab., M. Derrick et al., Z. Phys. C69 (1996) 607.
- [2] ZEUS Collab., M. Derrick et al., Phys. Lett. B315 (1993) 481; H1 Collab., T. Ahmed et al., Nucl. Phys. B429 (1994) 477; H1 Collab., T. Ahmed et al., Phys. Lett. B348 (1995) 681; ZEUS Collab., J. Breitweg et al., Euro. Phys. J. C6 (1999) 43.
- [3] H1 Collab., S. Aid et al., Phys. Lett. B379 (1996) 319; ZEUS Collab., M. Derrick et al., Phys. Rev. Lett. 75 (1995) 1006.
- [4] H1 Collab., C. Adloff et al., Z. Phys. C74 (1997) 191.
- [5] ZEUS Collab., J. Breitweg et al., Z. Phys. C74 (1997) 207.
- [6] G. Ingelman and R. Rückl, Phys. Lett. B201 (1988) 369; A.M. Cooper-Sakar, R. Devenish, and A. de Roeck, Int. J. Mod. Phys. A13 (1998) 3385.
- [7] G. Altarelli and G. Martinelli, Phys. Lett. B76 (1978) 89.
- [8] LEP Collabs., Nucl. Instrum. Methods A378 (1996) 101.
- [9] Particle Data Group, C. Caso et al., Eur. Phys. J. C3 (1998) 1.
- [10] W. Hollik et al., Proc. of the Workshop “Physics at HERA”, vol. 2, Eds. W. Buchmüller and G. Ingelman, DESY (1991) 923.
-
[11]
A. Kwiatkowski, H. Spiesberger, and
H.-J. Möhring, Comp. Phys. Commun. 69 (1992) 155;
H. Spiesberger, heracles – An Event Generator
for Interactions at HERA Including Radiative Processes
(Version 4.6), 1996, available on WWW:
http://www.desy.de/hspiesb/heracles.html - [12] A. Arbuzov et al., Comp. Phys. Commun. 94 (1996) 128.
- [13] H. Spiesberger et al., Proc. of the Workshop “Physics at HERA”, vol. 2, Eds. W. Buchmüller and G. Ingelman, DESY (1991) 798.
- [14] M. Glück, E. Reya, and A. Vogt, Z. Phys. C67 (1995) 433.
- [15] A.D. Martin, R.G. Roberts, and W.J. Stirling, Int. J. Mod. Phys. A10 (1995) 2885.
- [16] A.D. Martin, R.G. Roberts, W.J. Stirling, and R.S. Thorne, Eur. Phys. J. C4 (1998) 463.
- [17] H.L. Lai et al., Phys. Rev. D51 (1995) 4763.
- [18] H.L. Lai et al., Phys. Rev. D55 (1997) 1280.
- [19] V.N. Gribov and L.N. Lipatov, Sov. J. Nucl. Phys. 15 (1972) 438; L.N. Lipatov, Sov. J. Nucl. Phys. 20 (1975) 94; Y.L. Dokshitzer, Sov. Phys. JETP 46 (1977) 641; G. Parisi, Proc. 11th Recontre de Moriond, Ed. J. Tran Thanh Van (1976) 83; G. Altarelli and G. Parisi, Nucl. Phys. B126 (1977) 298; G. Curci, W. Furmanski, and R. Petronzio, Nucl. Phys. B175 (1980) 27; W. Furmanski and R. Petronzio, Phys. Lett. B97 (1980) 437; W. Furmanski and R. Petronzio, Z. Phys. C11 (1982) 293; G. Altarelli, Phys. Rep. 81 (1982) 1.
- [20] M. Botje, A QCD analysis of HERA and fixed target structure function data, DESY 99-038, NIKHEF-99-011 (in preparation).
- [21] L.W. Whitlow et al., Phys. Lett. B282 (1992) 475.
- [22] BCDMS Collab., A.C. Benvenuti et al., Phys. Lett. B223 (1989) 485; ibid. B237 (1990) 592.
- [23] NMC Collab., M. Arneodo et al., Nucl. Phys. B483 (1997) 3; ibid. B487 (1997) 3.
- [24] E665 Collab., M.R. Adams et al., Phys. Rev. D54 (1996) 3006.
- [25] H1 Collab., S. Aid et al., Nucl. Phys. B470 (1996) 3.
- [26] ZEUS Collab., M. Derrick et al., Z. Phys. C72 (1996) 399.
- [27] CCFR Collab., W. Seligman et al., Phys. Rev. Lett. 79 (1997) 1213.
- [28] E866 and NuSea Collab., E.A. Hawker et al., Phys. Rev. Lett. 80 (1998) 3715.
- [29] H.L. Lai and W.K. Tung, Z. Phys. C74 (1997) 463.
- [30] M. Glück, E. Reya, and M. Stratmann , Nucl. Phys. B422 (1994) 37.
- [31] E706 Collab., L. Apanasevich et al., Phys. Rev. Lett. 81 (1998) 2642.
- [32] CDF Collab., F. Abe et al., Phys. Rev. Lett. 79 (1997) 2198.
- [33] H.L. Lai et al., preprint MSU-HEP-903100 and hep-ph/9903282v2 (1999).
- [34] CDF Collab., F. Abe et al., Phys. Rev. Lett. 81 (1998) 5754.
- [35] The ZEUS Detector, Status Report 1993, DESY (1993).
- [36] M. Derrick et al., Nucl. Instrum. Methods A309 (1991) 77; A. Andresen et al., Nucl. Instrum. Methods A309 (1991) 101; A. Caldwell et al., Nucl. Instrum. Methods A321 (1992) 356; A. Bernstein et al., Nucl. Instrum. Methods A336 (1993) 23.
- [37] N. Harnew et al., Nucl. Instrum. Methods A279 (1989) 290; B. Foster et al., Nucl. Phys. B (Proc. Suppl.) 32 (1993) 181; B. Foster et al., Nucl. Instrum. Methods A338 (1994) 254.
- [38] J. Andruszków et al., DESY 92-066 (1992); ZEUS Collab, M. Derrick et al., Z. Phys. C63 (1994) 391.
- [39] R. Brun et al., CERN-DD/EE/84-1 (1987).
-
[40]
K. Charchuła, G.A. Schuler, and H. Spiesberger,
Comp. Phys. Commun. 81 (1994) 381;
H. Spiesberger, django6 version 2.4 – A Monte Carlo
Generator for Deep Inelastic Lepton Proton Scattering Including
QED and QCD Radiative Effects, 1996, available on WWW:
http://www.desy.de/hspiesb/django6.html - [41] L. Lönnblad, Comp. Phys. Commun. 71 (1992) 15.
- [42] G. Ingelman, A. Edin, and J. Rathsman, Comp. Phys. Commun. 101 (1997) 108.
- [43] S. Sjöstrand, Comp. Phys. Commun. 39 (1986) 347; S. Sjöstrand and M. Bengtsson, Comp. Phys. Commun. 43 (1987) 367; S. Sjöstrand, Comp. Phys. Commun. 82 (1994) 74.
- [44] G. Marchesini et al., Comp. Phys. Commun. 67 (1992) 465.
- [45] S. Bentvelsen, J. Engelen, and P. Kooijman, Proc. of the Workshop “Physics at HERA”, vol. 1, Eds. W. Buchmüller and G. Ingelman, DESY (1991) 23; K. C. Hoeger, ibid. 43.
- [46] G. Briskin, PhD Thesis, University of Tel Aviv (1998), DESY internal report DESY-THESIS-1998-036.
- [47] C.Y. Prescott et al., Phys. Lett. B77 (1978) 347; ibid. B84 (1979) 524.
| range | (pb/) | |||||||||||
|---|---|---|---|---|---|---|---|---|---|---|---|---|
| () | () | measured | SM | |||||||||
| 400.0 – | 475.7 | 440 | 8504 | 2.4 | 0.79 | 0.94 | ||||||
| 475.7 – | 565.7 | 520 | 6319 | 2.4 | 0.77 | 0.92 | ||||||
| 565.7 – | 672.7 | 620 | 5008 | 2.8 | 0.76 | 0.94 | ||||||
| 672.7 – | 800.0 | 730 | 3951 | 3.2 | 0.80 | 0.94 | ||||||
| 800.0 – | 951.4 | 870 | 3210 | 6.7 | 0.87 | 0.93 | ||||||
| 951.4 – | 1131.4 | 1040 | 2641 | 3.2 | 0.89 | 0.94 | ||||||
| 1131.4 – | 1345.4 | 1230 | 2000 | 1.2 | 0.90 | 0.92 | ||||||
| 1345.4 – | 1600.0 | 1470 | 1531 | 1.6 | 0.91 | 0.93 | ||||||
| 1600.0 – | 1902.7 | 1740 | 1204 | 2.0 | 0.91 | 0.92 | ||||||
| 1902.7 – | 2262.8 | 2100 | 863 | 0.4 | 0.91 | 0.93 | ||||||
| 2262.8 – | 2690.9 | 2500 | 629 | 0.4 | 0.92 | 0.94 | ||||||
| 2690.9 – | 3200.0 | 2900 | 455 | 1.2 | 0.91 | 0.94 | ||||||
| 3200.0 – | 4525.5 | 3800 | 565 | 3.1 | 0.91 | 0.93 | ||||||
| 4525.5 – | 6400.0 | 5400 | 303 | 0.0 | 0.91 | 0.91 | ||||||
| 6400.0 – | 9050.0 | 7600 | 162 | 0.0 | 0.90 | 0.93 | ||||||
| 9050.0 – | 12800.0 | 10800 | 63 | 0.0 | 0.86 | 0.93 | ||||||
| 12800.0 – | 18102.0 | 15200 | 20 | 0.0 | 0.81 | 0.93 | ||||||
| 18102.0 – | 25600.0 | 21500 | 8 | 0.0 | 0.86 | 0.96 | ||||||
| 25600.0 – | 36203.0 | 30400 | 0 | 0.0 | 0.86 | 0.90 | ||||||
| 36203.0 – | 51200.0 | 43100 | 2 | 0.0 | 0.89 | 1.00 | ||||||
| range | (pb) | ||||||||||||
| () | measured | SM | |||||||||||
| 400 | (0.63 – | 0.00794 | 2307 | 6.3 | 0.67 | 0.98 | |||||||
| (0.10 – | 0.0126 | 4352 | 11.0 | 0.84 | 0.94 | ||||||||
| (0.16 – | 0.0200 | 5026 | 6.7 | 0.85 | 0.94 | ||||||||
| (0.25 – | 0.0316 | 5283 | 2.7 | 0.87 | 0.92 | ||||||||
| (0.40 – | 0.0501 | 5028 | 2.7 | 0.87 | 0.92 | ||||||||
| (0.63 – | 0.0794 | 4782 | 0.0 | 0.86 | 0.93 | ||||||||
| 0.10 – 0.16 | 0.126 | 4219 | 0.4 | 0.86 | 0.92 | ||||||||
| 0.16 – 0.25 | 0.200 | 3512 | 0.0 | 0.82 | 0.92 | ||||||||
| 0.25 – 0.40 | 0.316 | 2276 | 0.4 | 0.87 | 0.92 | ||||||||
| 2500 | (0.25 – | 0.0316 | 58 | 1.2 | 0.72 | 1.01 | |||||||
| (0.40 – | 0.0501 | 252 | 2.7 | 0.91 | 0.95 | ||||||||
| (0.63 – | 0.0794 | 340 | 0.0 | 0.94 | 0.93 | ||||||||
| 0.10 – 0.16 | 0.126 | 421 | 0.0 | 0.93 | 0.91 | ||||||||
| 0.16 – 0.25 | 0.200 | 356 | 0.0 | 0.93 | 0.92 | ||||||||
| 0.25 – 0.40 | 0.316 | 265 | 0.4 | 0.87 | 0.91 | ||||||||
| 0.40 – 0.63 | 0.501 | 112 | 0.0 | 0.84 | 0.93 | ||||||||
| 10000 | 0.10 – 0.16 | 0.126 | 7 | 0.0 | 0.62 | 1.06 | 3.3 | ||||||
| 0.16 – 0.25 | 0.200 | 19 | 0.0 | 0.82 | 0.94 | 6.0 | |||||||
| 0.25 – 0.40 | 0.316 | 23 | 0.0 | 0.88 | 0.91 | 4.1 | |||||||
| 0.40 – 0.63 | 0.501 | 12 | 0.0 | 0.85 | 0.93 | 1.3 | |||||||
| 0.63 – 1.00 | 0.794 | 2 | 0.0 | 0.92 | 0.95 | ||||||||
| range | (pb) | ||||||||||
|---|---|---|---|---|---|---|---|---|---|---|---|
| () | measured | SM | |||||||||
| 400 | 0.00 – 0.05 | 0.025 | 5613 | 0.0 | 0.80 | 0.95 | |||||
| 0.05 – 0.10 | 0.075 | 5844 | 0.4 | 0.84 | 0.94 | ||||||
| 0.10 – 0.15 | 0.125 | 4128 | 0.4 | 0.86 | 0.93 | ||||||
| 0.15 – 0.20 | 0.175 | 3231 | 0.0 | 0.88 | 0.93 | ||||||
| 0.20 – 0.25 | 0.225 | 2685 | 0.0 | 0.86 | 0.93 | ||||||
| 0.25 – 0.30 | 0.275 | 2226 | 0.0 | 0.85 | 0.92 | ||||||
| 0.30 – 0.35 | 0.325 | 1939 | 0.0 | 0.85 | 0.92 | ||||||
| 0.35 – 0.40 | 0.375 | 1731 | 2.4 | 0.87 | 0.93 | ||||||
| 0.40 – 0.45 | 0.425 | 1547 | 1.6 | 0.86 | 0.91 | ||||||
| 0.45 – 0.50 | 0.475 | 1389 | 0.0 | 0.90 | 0.92 | ||||||
| 0.50 – 0.55 | 0.525 | 1308 | 1.2 | 0.91 | 0.91 | ||||||
| 0.55 – 0.60 | 0.575 | 1205 | 3.6 | 0.91 | 0.91 | ||||||
| 0.60 – 0.65 | 0.625 | 1104 | 0.4 | 0.92 | 0.92 | ||||||
| 0.65 – 0.70 | 0.675 | 978 | 0.8 | 0.89 | 0.91 | ||||||
| 0.70 – 0.75 | 0.725 | 849 | 2.8 | 0.84 | 0.94 | ||||||
| 0.75 – 0.80 | 0.775 | 676 | 1.2 | 0.74 | 0.92 | ||||||
| 0.80 – 0.85 | 0.825 | 460 | 2.4 | 0.55 | 0.93 | ||||||
| 0.85 – 0.90 | 0.875 | 311 | 5.1 | 0.41 | 0.94 | ||||||
| 0.90 – 0.95 | 0.925 | 209 | 5.9 | 0.24 | 0.96 | ||||||
| range | (pb) | |||||||||||
| () | measured | SM | ||||||||||
| 2500 | 0.05 – 0.10 | 0.075 | 93 | 0.0 | 0.88 | 1.02 | ||||||
| 0.10 – 0.15 | 0.125 | 172 | 0.4 | 0.92 | 0.95 | |||||||
| 0.15 – 0.20 | 0.175 | 171 | 0.0 | 0.93 | 0.93 | |||||||
| 0.20 – 0.25 | 0.225 | 158 | 0.0 | 0.94 | 0.94 | |||||||
| 0.25 – 0.30 | 0.275 | 169 | 0.0 | 0.94 | 0.93 | |||||||
| 0.30 – 0.35 | 0.325 | 135 | 0.0 | 0.95 | 0.94 | |||||||
| 0.35 – 0.40 | 0.375 | 108 | 0.0 | 0.94 | 0.91 | |||||||
| 0.40 – 0.45 | 0.425 | 114 | 0.0 | 0.96 | 0.88 | |||||||
| 0.45 – 0.50 | 0.475 | 99 | 0.0 | 0.95 | 0.92 | |||||||
| 0.50 – 0.55 | 0.525 | 85 | 0.0 | 0.97 | 0.89 | |||||||
| 0.55 – 0.60 | 0.575 | 86 | 0.0 | 0.93 | 0.88 | |||||||
| 0.60 – 0.65 | 0.625 | 72 | 0.0 | 0.93 | 0.90 | |||||||
| 0.65 – 0.70 | 0.675 | 72 | 0.0 | 0.92 | 0.89 | |||||||
| 0.70 – 0.75 | 0.725 | 62 | 0.0 | 0.94 | 0.91 | |||||||
| 0.75 – 0.80 | 0.775 | 74 | 0.0 | 0.93 | 0.92 | |||||||
| 0.80 – 0.85 | 0.825 | 44 | 1.6 | 0.85 | 0.93 | |||||||
| 0.85 – 0.90 | 0.875 | 44 | 1.2 | 0.83 | 0.92 | |||||||
| 0.90 – 0.95 | 0.925 | 55 | 1.2 | 0.74 | 0.93 | |||||||
| 10000 | 0.1 – 0.2 | 0.15 | 1 | 0.0 | 1.06 | 1.08 | ||||||
| 0.2 – 0.3 | 0.25 | 6 | 0.0 | 0.98 | 0.95 | 1.3 | ||||||
| 0.3 – 0.4 | 0.35 | 9 | 0.0 | 0.92 | 0.97 | 2.3 | ||||||
| 0.4 – 0.5 | 0.45 | 9 | 0.0 | 0.82 | 0.90 | 2.6 | ||||||
| 0.5 – 0.6 | 0.55 | 5 | 0.0 | 0.80 | 0.92 | 2.4 | ||||||
| 0.6 – 0.7 | 0.65 | 10 | 0.0 | 0.86 | 0.91 | 2.2 | ||||||
| 0.7 – 0.8 | 0.75 | 10 | 0.0 | 0.95 | 0.92 | 2.0 | ||||||
| 0.8 – 0.9 | 0.85 | 9 | 0.0 | 0.93 | 0.95 | 1.8 | ||||||
| 0.9 – 1.0 | 0.95 | 4 | 0.0 | 0.31 | 1.01 | 1.7 | ||||||


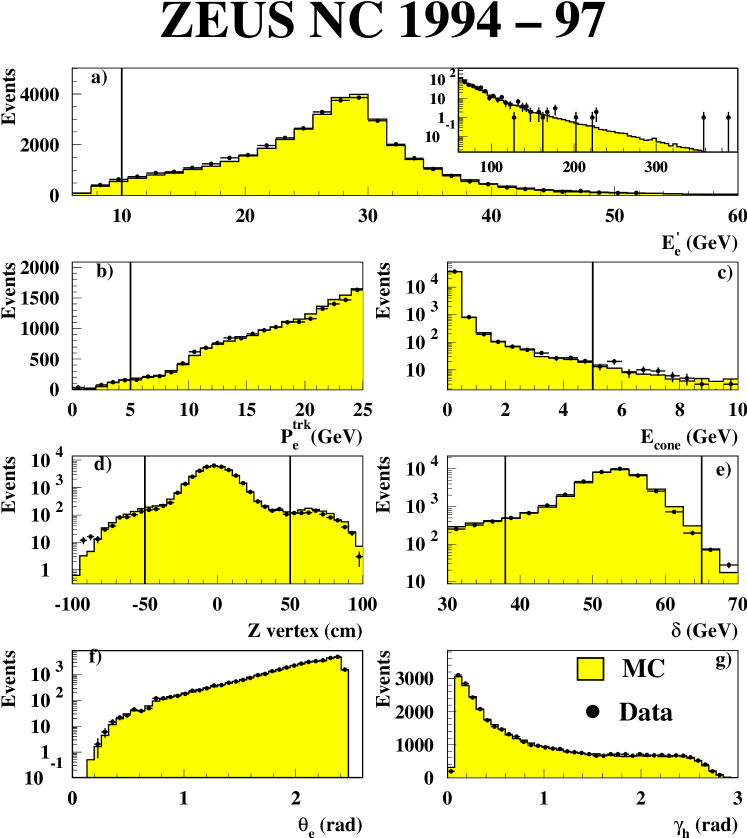
(a) , the energy of the scattered positron; the inset shows the high energy part of the distribution; (b) , the momentum of the positron track; (c) the energy not assigned to the positron in an - cone of 0.8; (d) the position of the event vertex; (e) ; (f) , the angle of the positron; and (g) , the angle of the hadronic system. Only events which pass all event selection cuts are plotted in (e) and (f); in (a)–(e), events are plotted which pass all other event selection cuts except those on the variable displayed; the cuts to be applied to this variable are indicated by the vertical lines.