EUROPEAN LABORATORY FOR PARTICLE PHYSICS
CERN-OPEN-99-010
May 18, 1999
Study of a Long Baseline
Appearance Neutrino
Oscillation Experiment in the
Quasi-Elastic Regime
Mathieu Douceta, Jaap Panmana and Piero Zucchellia,b
a CERN, Geneva, Switzerland
b On leave of absence from INFN - Sezione di Ferrara
Abstract
We present a study for a design of a long baseline appearance experiment to probe the high and low region relevant to explain the atmospheric neutrino anomaly. The experiment relies on a good identification of quasi-elastic interactions, which is a clean topology that has an important contribution in the lowest part of the region probed. The detector we studied is a fine grained liquid scintillator detector of 15 kilotons, optimized to detect electrons from decays, while rejecting backgrounds from in interactions and electrons from the beam contamination. As a reference, the proposed neutrino beam from CERN to Gran Sasso was used.
1 Introduction
The question of whether or not neutrinos have a mass has been in the mind of physicists for some time. If the neutrinos have non-degenerate masses and are mixed, neutrino oscillations could in principle be observed. The study of this phenomenon, by which transitions between neutrino flavours are possible, constitutes a very precise way to determine the mass states of the neutrinos.
Although there have been some indications from solar neutrino experiments (Homestake [1], GALLEX [2], SAGE [3], Kamiokande [4] and Super-Kamiokande [5]) that the neutrinos indeed could oscillate, the recent results from the Super-Kamiokande [6] atmospheric neutrino experiment gave the strongest indications, by showing evidence for disappearance. Other atmospheric neutrino experiments have obtained results compatible with this hypothesis (Kamiokande [7], MACRO [8] and SOUDAN2 [9]). Furthermore, the LSND [10] short-baseline appearance experiment found indications for oscillating to .
Now that the first indications for neutrino oscillations have been found, the confirmation of the oscillation signals and the determination of the oscillation parameters represent important objectives. This year already, the K2K [11] long baseline disappearance experiment will shed some light on the situation. At the end of the data taking, it will be able to probe the region above eV2. The MINOS [12] experiment at Fermilab, which will start taking data early next century, also aims to probe the atmospheric region.
Given the CHOOZ [13] result, which excludes the interpretation of the atmospheric neutrino data as oscillations above eV2, a plausible interpretation of these data is oscillations. Proposals for several experiments to detect appearance using the proposed NGS [14] neutrino beam from CERN to Gran Sasso are being prepared.
Prompted by the recent efforts, both at Fermilab and at CERN, to develop long baseline projects with the NuMi [12] and NGS beams, the purpose of the present paper is to study the possibilities for a simple appearance experiment to probe the region of the atmospheric neutrino experiments. We argue that a totally active scintillator detector in a long baseline beam would provide an efficient way to verify the oscillation claim from the Super-Kamiokande data.
The present study is based on the parameters of the proposed NGS beam. This beam has a mean energy of about 18 GeV and a baseline of about 735 km, corresponding to the distance between CERN and the Gran Sasso laboratory. In order to understand the role of the baseline, we also study the performances of the same neutrino detector when positioned 3000 km away from the same neutrino source.
In these conditions, low values (below eV2) are such that the oscillated energy spectrum peaks at low energy (below 10 GeV). At these energies, the quasi-elastic interactions have a significant contribution to the total event rate. An experiment aiming to reach very low values of could thus be optimized for the detection of quasi-elastic processes, since they represent a very clean signal compared to the deep-inelastic processes. An efficient way of studying those interactions is to focus on the events where the produced decays to an electron 111The branching ratio of the decay to electron is about 18% [15]. ( , with ). The signature of these interactions is similar to the quasi-elastic ( ) events that I216 [16] aims to study to search for appearance. Figure 1 shows the two topologies involved for (a) and (b) appearance experiments. The I216 experiment would be looking for appearance in a beam by comparing the ratio of and quasi-elastic interactions in detector modules at two locations (130 m and 885 m from the target). The current design of the modules consists in fine grained fully active scintillator calorimeters amounting to an overall mass of 500 tons. This experiment would use the CERN-PS to get a neutrino beam of energy of about 1.5 GeV. In the present study, we use one of the detector designs of I216 (to be described later) and apply it to the detection of interactions.

Although addressing the question of neutrino oscillations in the atmospheric region is of great importance, the verification of the oscillation claim of LSND is no less important. The KARMEN [17] experiment is trying to clarify the issue, and other projects have been proposed (MiniBoone [18] and I216 itself). According to this study, we conclude that the use of a single detector technology could allow to search for neutrino oscillations both in the LSND region and the atmospheric region by doing a short baseline experiment as a first step to a long baseline appearance experiment.
2 Description of the detector
In the studies related to the I216 Letter of Intent [16], it was realized that a fully active liquid scintillator detector with a granularity of the order of a few centimetres fulfils the general requirements for electron identification and topological reconstruction necessary for a appearance search. We want to apply the same technique to the detection of interactions with subsequent decay , in a detector about thirty times larger (15 ktons). It should be noted that liquid scintillator detectors have already been successfully used in a wide range of experiments (for example: CHOOZ [13] and MACRO [8]), and foreseen for future large scale applications (for example: KamLAND [19] and Borexino [20]).
2.1 Detector design
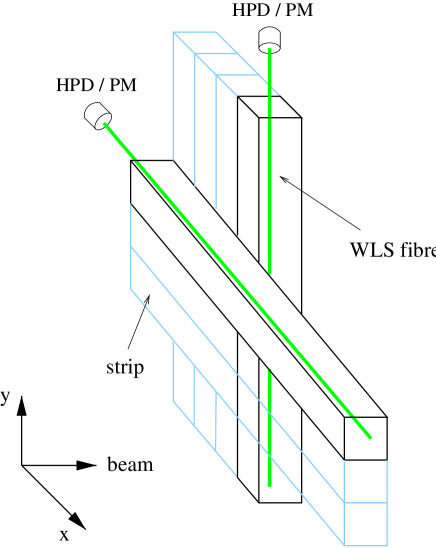
Because of the large scale, a simple and modular structure should be adopted (see figure 2). The active target consists of an oil based scintillating mixture contained in a large vessel. The granularity is provided by optical separators immersed in the liquid. These separators are structured in planes of parallel strips. The planes are perpendicular to the beam direction. The strips of a given plane are orthogonal to those of the adjacent planes in order to be able to do bi-dimensional reconstruction. The light collection is accomplished by wavelength-shifting (WLS) fibres placed inside each strip. The light from the fibres is readout by multi-pixel photon detectors. The general detector characteristics are reported in table 1 and discussed in the following sub-sections.
| Mass | 15 ktons |
|---|---|
| Modules | 4 |
| Module width | 10 m |
| Module length | 42 m |
| Sampling | 4 cm |
| Granularity | 4 cm |
| Planes per module | 1042 |
| Strips per module | 260417 |
| Photodetectors per module | 2035 |
2.1.1 The active medium
Mineral oil scintillator has been studied in great detail, and excellent performances in stability, light yield and attenuation lengths have already been reached in the past. Contrary to surface readout detectors (for instance KamLAND and Borexino), where the attenuation length of the liquid plays an important role because the light must travel a large distance, the light emitted by the scintillator in the case of a WLS fibre readout is captured locally inside the fibre. The attenuation length of the liquid can then be shorter, which gives more freedom in the choice of the mixture.
A very recent development of oil based liquid scintillator consists in using new solvents like PXE (phenyl-o-xylylethane) [21] and LAB (linear alkylbenzenes) [22]. Mixtures using these solvents can have very good scintillation properties (for example, 87% of anthracene light output can be reached with the Bicron scintillator BC599-16 [23]). Their physical properties are well suited for a very large scintillating WLS fibre detector. They are non-toxic, non-flammable (flash point above 145o) and good insulators. Both solvents mentioned here are produced in large quantities for industrial applications. These physical properties are crucial if the photodetectors are to be placed inside the scintillating mixture without any specific precaution concerning high voltages and power dissipation.
2.1.2 Granularity
In this study, we fix the longitudinal sampling frequency to 4 cm (corresponding to 1/13 radiation length) with a transverse granularity of 4 cm, to allow for topological reconstruction of the events. With such a granularity, the detector could be placed above ground. According to simulation and laboratory tests [24], the proper reflectivity of the walls can be obtained in various ways and with different materials (for example: aluminium painted with , or extruded polypropylene).
2.1.3 Wavelength shifting fibres
The WLS fibre readout technology allows to collect the scintillating light from a large volume (the volume of a scintillator strip) with good efficiency onto a small surface (the fibre diameter at one end). This is crucial in our large scale application, because a significant fraction of the overall cost is given by the photodetectors. It is then important to maximize the amount of active mass which is read by a given photocathode surface. For this reason, we want to have strips as long as possible while having enough photoelectrons to measure the ionization loss. We assume a strip length of 10 meters and a single-sided readout with a mirror on the opposite side of the fibre. From studies done for MINOS [12], we expect that a measured signal of an average of 10 photoelectrons 222We assume a typical quantum efficiency for the photodetector (see next paragraph). for a minimum ionizing particle passing through the far end of a strip could be achieved with current technology.
2.1.4 Photodetectors
Multi-anode phototubes and hybrid-photodiodes (HPD) are commercially available. They allow to read a large number of channels, up to a few hundreds, on a single device. In the case of HPD’s, the cost is mainly proportional to the surface of the photocathode rather than to the number of channels. Typical quantum efficiencies at a wavelength of 520 nm (the peak value of the emission spectrum of the WLS fibre) is in the region of 13% to 20%. We have checked that these commercial photodetectors can be immersed in the mentioned liquid mixtures. This aspect is crucial to minimize the length of the WLS fibres outside the strip and the consequent light losses.
2.1.5 Infrastructure, civil engineering and cost
The feasibility of a 15 kiloton detector also depends on civil engineering issues like safety, assembling, environmental impact and design costs. Industrial oil containers 333Among these, the use of an oil tanker is a possibility. have capacities largely exceeding our requests and would be suited for our application. These could then be recycled for other purposes after the experiment is finished. The overall detector can be split into four modules of about 101040 m3. An estimate of the costs of the main items of such a detector is given in table 2, based on informal contacts with manufacturers. The containers and the infrastructure are not included.
| Item | Unit cost [CHF] | Amount | Price [MCHF] |
|---|---|---|---|
| Photodetectors | 14.0/channel | 1041667 | 14.6 |
| WLS fibres | 1.0/meter | 10417 km | 10.4 |
| Liquid Scintillator | 1.0/kg | 15 ktons | 15.0 |
| Electronics | 10.0/channel | 1041667 | 10.4 |
| Total | 50.4 | ||
3 Event selection and background rejection
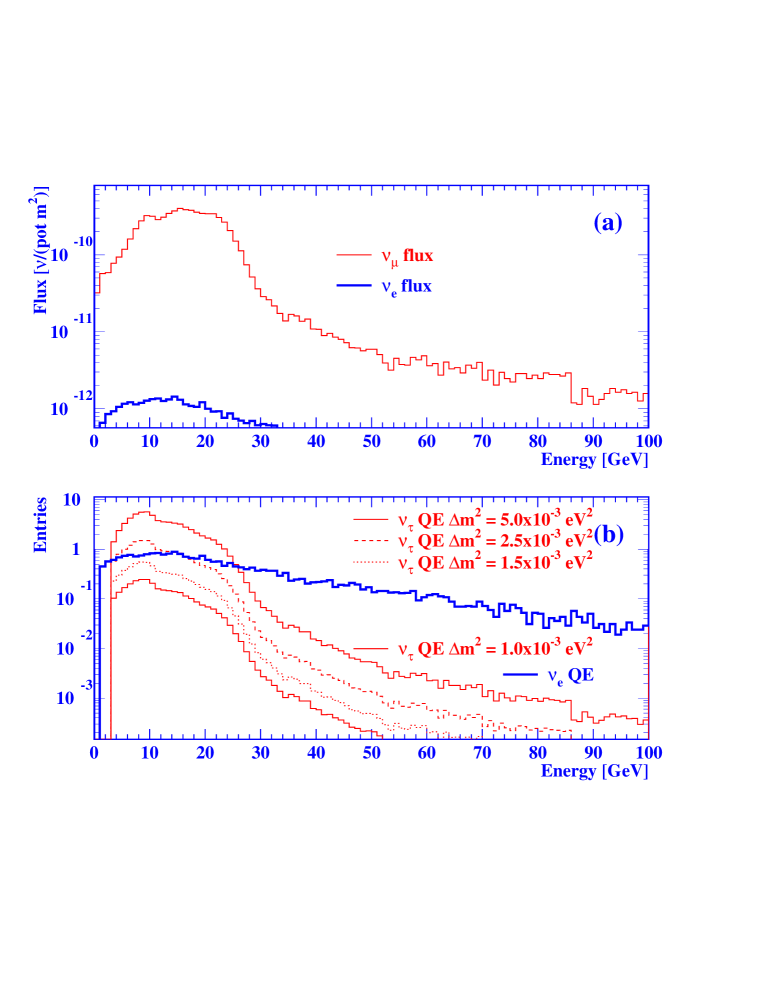
The flux components of the NGS neutrino beam are reported in table 3. The expected event rates for pure quasi-elastic, resonances and deep inelastic processes 444We define the deep-inelastic processes as those which occur above GeV2. were computed using the latest version of the NGS neutrino beam [25] (they are given in table 4). The number of interactions for several values of are shown. The rates are given per kiloton assuming four years of NGS beam at protons on target per year.
| Source | total flux [] | relative importance |
|---|---|---|
| 100% | ||
| 2.2%⋆ | ||
| 0.6% | ||
| 0.08%⋆ |
From table 4, it can be seen that the quasi-elastic processes for oscillated are a significant fraction of the total number of interactions. Furthermore, the resonant interactions, which also make an important fraction of the total number of events, can also have a topology similar to the quasi-elastic processes. Therefore, we focus our analysis on the clean quasi-elastic topology where the decays to an electron. We define this topology as an electromagnetic shower and at most one additional charged track in the final state. We shall see how it is possible to have a good efficiency by a simple selection of these events while rejecting an important fraction of the background coming from the contamination of the beam as well as the other sources of background.
The selection of events could be refined by studying other event properties such as missing transverse momentum. Crucial experimental data giving information about the properties of the background, including cross-section measurements, could in principle come from another experiment like I216, where oscillations are excluded at large mixing angle.
It should be mentioned that other decay channels of the can be studied in addition to the electronic channel. For instance, the decay in quasi-elastic interactions was studied in CHARM II [26] for a oscillation search at high sensitivity. This channel could provide a signal independent of the contamination of the beam.
| Source | Events/kton |
|---|---|
| QE [ eV2] | 25.2 (4.49) |
| QE [ eV2] | 6.79 (1.21) |
| QE [ eV2] | 4.39 (0.78) |
| QE [ eV2] | 1.11 (0.20) |
| RES [ eV2] | 53.2 (9.47) |
| RES [ eV2] | 14.7 (2.61) |
| RES [ eV2] | 9.49 (1.69) |
| RES [ eV2] | 2.41 (0.43) |
| DIS [ eV2] | 156 |
| DIS [ eV2] | 40.0 |
| DIS [ eV2] | 14.5 |
| DIS [ eV2] | 6.45 |
| QE+RES | 1060 |
| RES (NC) | 190 |
| QE+RES | 6.4 |
| DIS | 8320 |
| DIS | 74 |
Several processes can produce events that mimic the quasi-elastic topology of the signal. The following contaminations were studied:
-
•
contamination
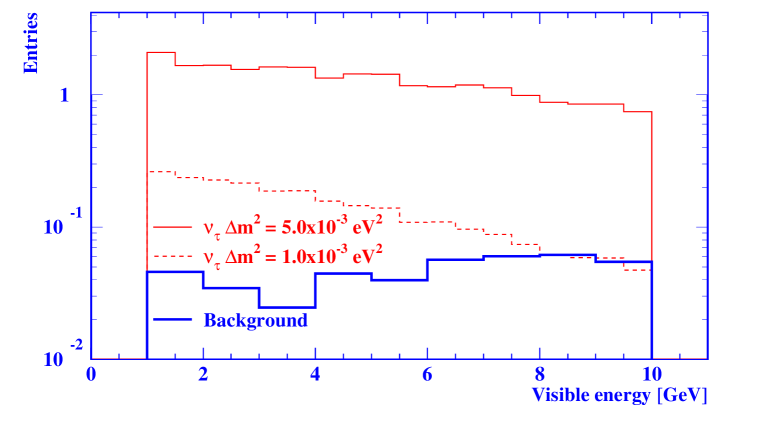
The main source of background for an appearance experiment selecting quasi-elastic interactions where the decays to an electron is the contamination of the beam. As can be seen in table 3, this contamination is of the order of 0.6% of the component. Figure 3(a) shows the spectrum of and of the NGS beam.Figure 3(b) shows the neutrino energy distributions of quasi-elastic events and of quasi-elastic events where the decays to an electron, assuming different values of . It can be seen that the neutrino energy distribution of the background from the contamination of the beam is harder than the one of the oscillated quasi-elastic events.
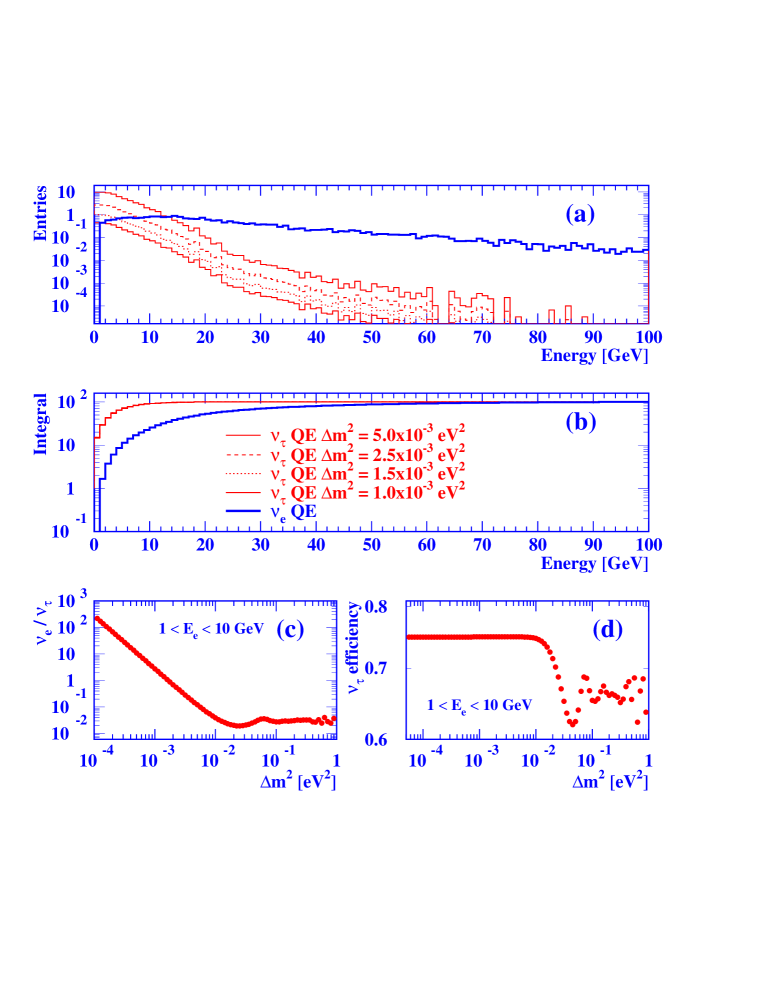
One method to reject this background is to cut on the energy of the identified electron. Since the oscillation probability favors the low energy range of the spectrum, and since the electron of the signal comes from the decay of a , the electrons of the signal will have a much lower energy than the electrons of pure quasi-elastic processes. Figure 4(a) shows the electron energy distributions from both quasi-elastic interactions and decays from quasi-elastic interactions. Figure 4(b) shows the normalized integral of these distributions between zero and a given value of the electron energy (x-axis). A cut at 1 GeV, which will be described later in the text, has been applied before integrating. Since the energy distributions of the electron are similar for all the values considered, the four curves of the signal are overlapping and cannot be distinguished. Another important feature of this figure is that the integral of the signal rises very rapidly at low energy whereas the background rises slowly. A cut on the energy of the electron can thus reduce the background efficiently while keeping most of the signal. For instance, for a cut at 10 GeV, 75% of the signal is kept while 70% of the background is rejected. Figure 4(c) shows the ratio of the number of background events and the number of signal events as a function of , for a cut at 10 GeV. Figure 4(d) shows the signal selection efficiency for a 10 GeV cut as a function of . The final choice of the energy cut should be done by maximizing the sensitivity of the experiment, which will critically depend on the choice of other event selection criteria, baseline and detector mass. We have checked a posteriori that the sensitivity does not change significantly if the maximum allowed lepton energy varies in the interval between 4 and 12 GeV (with a 735 km baseline and a 15 kiloton detector). Therefore, in the present study, we fix the upper limit of the lepton energy to be 10 GeV independently of the baseline. We conclude from figure 4 that a good rejection of quasi-elastic events can be achieved by a simple energy cut. Additional criteria to reject the contamination could be based on the kinematics of the events (for instance, the angle of the lepton with respect to the beam), but have not been used in this analysis.
-
•
in NC processes
The conversion of the photons coming from a decay in a neutral-current process can fake the electron signature. To reject this background, we apply a combination of topological cuts on the signal recorded in the scintillator. Assuming that the vertex position is known, a can mimic an electron in the following conditions:-
–
at least one photon converts in a strip adjacent to the vertex position, while the two electromagnetic showers of the photons overlap.
-
–
one photon converts in a strip adjacent to the vertex position, while the other is missed (for example in an asymmetric decay of the ).
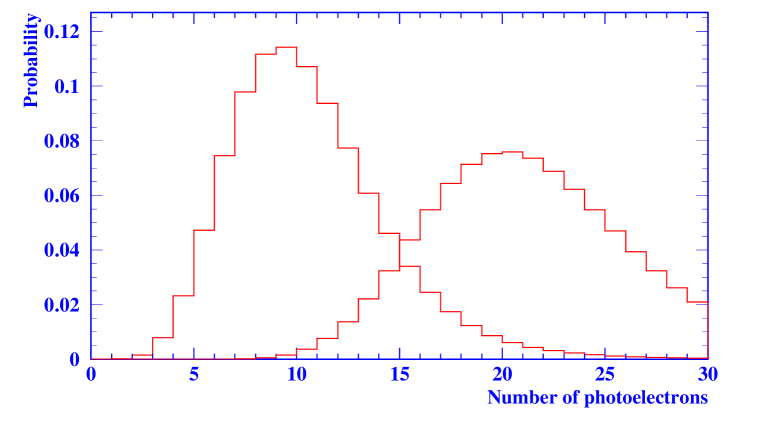
In the cases stated above, the pulse height of the signal recorded in the scintillator can be used to discriminate between the passage of a single electron (which will behave as a minimum ionizing particle in the first tenths of a radiation length) and two electrons coming from a photon conversion. With a statistics of 10 photoelectrons per minimum ionizing particle passing through a strip, it is possible to reject 92% of the two-electron background using the information of the first strip only (see figure 5). The selection efficiency of the signal is then about 86%.
-
–
Given the previous considerations, the selection of events with a quasi-elastic topology where the decays to an electron is the following:
-
1.
The event must have a pure quasi-elastic topology, with a visible vertex identified by an electromagnetic shower and at most one charged track (assumed to be the proton). In the case where the proton track is not seen, we require a large pulse height corresponding to a heavily ionizing stopping particle. This peak will then be identified as the vertex. To ensure a well defined topology, we require that the proton track should not interact.
-
2.
The electromagnetic shower should be connected to the vertex.
-
3.
The visible energy of the electromagnetic shower should be between 1 GeV and 10 GeV to ensure that it comes from a decay, and not from a quasi-elastic event. The lower cut on the energy also cuts events, which peak at low energy.
-
4.
The energy deposit of the electromagnetic shower in the first plane should be compatible with a single minimum ionizing particle.
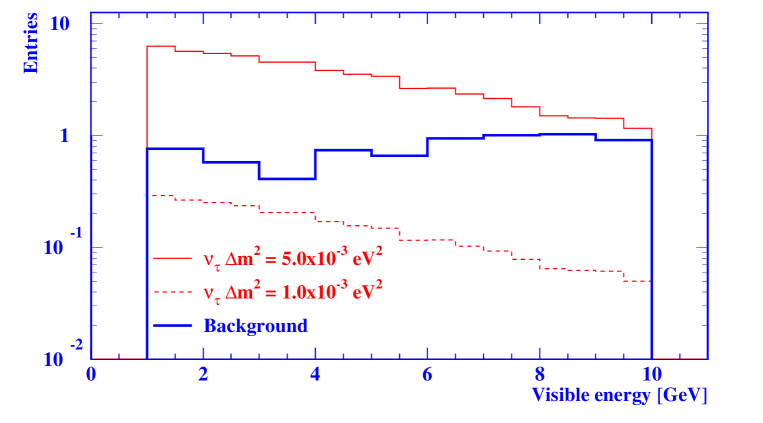
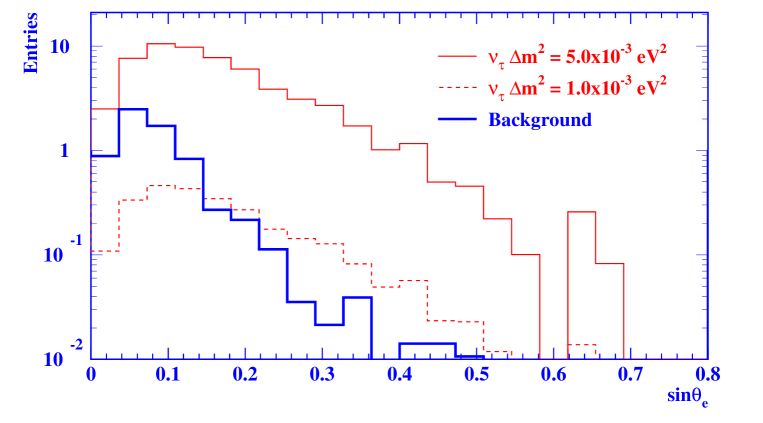
The selection efficiencies for signal and background were evaluated using a quasi-elastic and resonant interaction generator [27] and a Monte Carlo parametrized to simulate the detector response and reconstruction. Table 5 shows the different rates of events as computed using the cuts mentioned above. The energy distribution of the selected events is shown in figures 6 and 7 for the two baselines under study. Additional criteria could still be explored, as mentioned earlier. As an example, figure 8 shows the angular distribution of the lepton with respect to the beam direction for the signal and the background.
| Source | Events/kton | efficiency |
|---|---|---|
| QE+RES [ eV2] | 3.91 | 28% |
| QE+RES [ eV2] | 1.07 | 28% |
| QE+RES [ eV2] | 0.69 | 28% |
| QE+RES [ eV2] | 0.18 | 28% |
| QE+RES | 0.44 | 6.9% |
| RES (NC) | 0.042 | 0.022% |
4 Sensitivity to neutrino oscillations
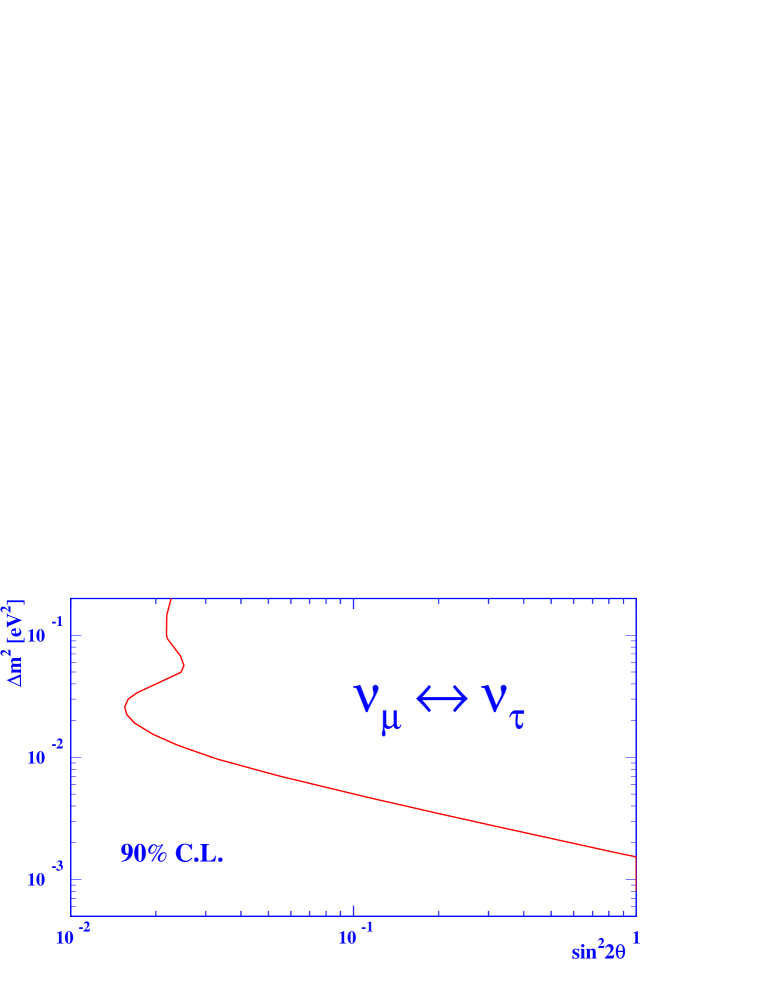
The sensitivity is the “average upper limit that would be obtained by an ensemble of experiments with the expected background and no true signal”, and has been computed by using the statistical techniques reported in reference [28]. The sensitivity of the proposed experiment has been computed for a detector of 15 kilotons and a baseline of 735 km. The resulting sensitivity plot is shown in figure 10. The systematic uncertainty on the contamination of the beam is assumed to be of the order of 5%.
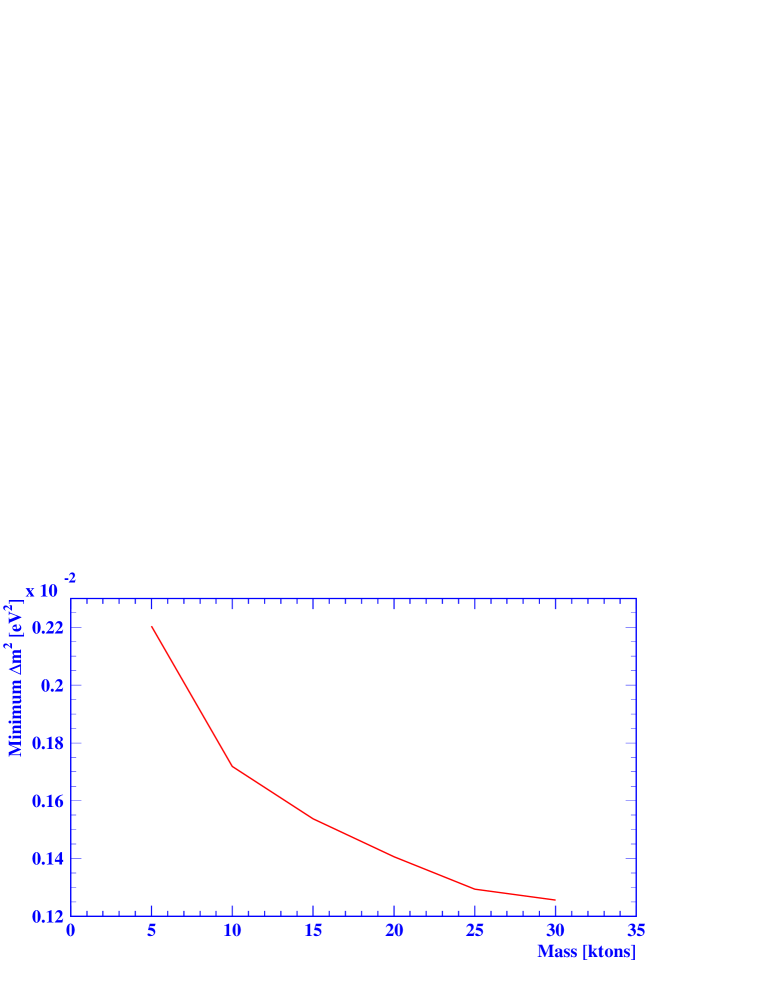
We studied the possible improvements that can be achieved by varying the mass and the baseline. Figure 9 shows the lowest reachable by the experiment at 735 km as a function of its mass. Since the experiment is not background-free, the minimum value does not scale as .
When , the oscillation probability is such that the gain in the number of oscillated compensates exactly for the loss of neutrino flux as the baseline is increased: . On the other hand, the background is proportional to the flux, which decreases like . The minimum value that can be probed with a given experiment having a non-negligible background thus decreases by increasing the distance from the neutrino source, at the price of a reduced maximum sensitivity. Figure 11 shows the sensitivity plot for the same detector in the same beam, when it is positioned 3000 km away from the neutrino source. It should be stressed that the systematic uncertainties on the background (dominated by interactions) are in this case less significant with respect to the 735 km baseline experiment, since the signal to background ratio improves by a factor .
5 Conclusion
We believe that the liquid scintillator detector technology could be used to build a large detector to search for oscillations in the atmospheric region with a long baseline beam. Whenever , with the current beam designs, the quasi-elastic regime has a significant contribution to the overall interaction rate of the oscillated . In this study, we have concentrated on a simple selection of quasi-elastic interactions where the subsequently decays to an electron. A 15 kiloton detector running for four years at 735 km from the neutrino source of a beam similar to the proposed NGS, can probably achieve a minimum of about 1.5 eV2 at 90% C.L. in appearance mode. This result could improve down to about 1.1 eV2 if the baseline were increased to 3000 km. Additional channels in the quasi-elastic regime, as well as the analysis of deep inelastic events, could improve the potential of the experiment in both appearance and disappearance modes.
Acknowledgments
We would like to thank our CHORUS and I216 colleagues for useful discussions. We are grateful to J.-P. Fabre, P. Migliozzi and S. Ricciardi for constructive comments and valuable information. We would also like to thank V. Palladino and N. Vassilopoulos for providing us with the beam spectrum.
References
- [1] B.T. Cleveland, Nucl. Phys. (Proc. Suppl.) B38 (1995) 47-53.
- [2] GALLEX Collaboration, W. Hampel et al., Phys. Lett. B420 (1998) 114-126.
- [3] J.N. Abdurashitov et al., Phys. Rev. Lett. 77 (1996) 4708-4711.
- [4] Kamiokande Collaboration, Y. Fukuda et al., Phys. Rev. Lett. 77 (1996) 1683-1686.
- [5] Y. Fukuda et al., Phys. Rev. Lett. 81 (1998) 1158-1162.
- [6] Super-Kamiokande Collaboration, Y. Fukuda et al., Phys. Rev. Lett. 81 (1998) 1562-1567.
- [7] Y. Fukuda et al., Phys. Lett. B335 (1994) 237-245.
- [8] MACRO Collaboration, M. Ambrosio et al., Phys. Lett. B434 (1998) 451-457.
- [9] W.W.M. Allison et al., Phys. Lett. B449 (1999) 137-144.
-
[10]
LSND Collaboration, C. Athanassopoulos et al.,
Phys. Rev. C54 (1996) 2685-2708;
LSND Collaboration, C. Athanassopoulos et al., Phys. Rev. Lett. 81 (1998) 1774-1777. - [11] Y. Oyama for the K2K Collaboration, “Neutrino-Oscillation Experiment at KEK-PS”, hep-ex/9803014, in proceedings of the YITP Workshop on Flavor Physics (1998).
- [12] MINOS Technical Design Report, NuMi-L-337 TDR, October 1998.
- [13] M. Apollonio et al., Phys. Lett. B420 (1998) 397-404.
- [14] G. Acquistapace et al., The CERN Neutrino Beam to Gran Sasso, CERN/98-02 (1998).
- [15] C. Caso et al., Eur. Phys. J. C3 (1998).
- [16] N. Armenise et al., CERN-SPSC/97-21 (1997).
- [17] K. Eitel and B. Zeitnitz for the KARMEN Collaboration, contribution to Neutrino 98.
- [18] E. Church et al., “A Proposal for an Experiment to Measure Oscillations and Disappearance at the Fermilab Booster”, Fermilab-P-0898 (1997).
- [19] P. Alivisatos et al., The KamLAND Collaboration, “A Liquid Scintillator Anti-Neutrino Detector at the Kamioka Site”, Stanford-HEP-98-03 (1998).
- [20] The Borexino Collaboration, http://almime.mi.infn.it/
- [21] Kock Chemical Company, Corpus Christi, TX, USA.
- [22] Eljen Technology, Sweetwater, TX, USA. EJ-399-04 scintillator.
- [23] S. Majewski et al., Nucl. Inst. and Meth. A414 (1998) 289-298.
-
[24]
The MINOS Collaboration, “The MINOS Liquid Scintillator Detector”,
NuMi Note L292 (1997). -
[25]
N. Vassilopoulos, private communication.
The H35 beam design was used. - [26] The CHARM II Collaboration, M. Gruwé et al., Phys. Lett. B309 (1993) 463-468.
-
[27]
S. Ricciardi, “Event Generator for Quasi-Elastics and Production of
Resonances”,
CHORUS Internal Note 97001 (1997). - [28] G.J. Feldman and R.D. Cousins, Phys. Rev. D57 (1998) 3873-3889.