Neutrino Oscillations at High Energy by MACRO
F Ronga1 for the MACRO collaboration
1INFN Laboratori Nazionali di Frascati P.O. Box 13 Frascati ITALY
Abstract
We present updated results of the measurement of upward-going muons produced by neutrino interactions in the rock below the MACRO detector. These data support MACRO’s previously published results. They favor a neutrino oscillation explanation of the atmospheric neutrino anomaly.
1 Introduction:
The interest in precise measurements of the flux of neutrinos produced in cosmic ray cascades in the atmosphere has been growing over the last years due to the anomaly in the ratio of contained muon neutrino to electron neutrino interactions. The past observations of Kamiokande, IMB and Soudan 2 are now confirmed by those of SuperKamiokande, MACRO and Soudan2 (with higher statistics) and the anomaly finds explanation in the scenario of oscillation (Fukuda 1998a). The effects of neutrino oscillations have to appear also in higher energy ranges. The flux of muon neutrinos in the energy region from a few GeV up to a few TeV can be inferred from measurements of upward throughgoing muons (Ahlen 1995,Ambrosio 1998b,Hatakeyama 1998, Fukuda 1998b). As a consequence of oscillations, the flux of upward throughgoing muons should be affected both in the absolute number of events and in the shape of the zenith angle distribution, with relatively fewer observed events near the vertical than near the horizontal due to the longer path length of neutrinos from production to observation.
Here an update of the measurement of the high energy muon neutrino flux is presented. The new data are in agreement with the old data. The MACRO low energy data are presented in another paper at this conference (Surdo 1999).
2 Upward Throughgoing Muons:
The MACRO detector is described elsewhere (Ahlen 1993, Ambrosio 1998b). Active elements are streamer tube chambers used for tracking and liquid scintillator counters used for the time measurement. The direction that muons travel through MACRO is determined by the time-of-flight between two different layers of scintillator counters. The measured muon velocity is calculated with the convention that muons going down through the detector are expected to have 1/ near +1 while muons going up through the detector are expected to have 1/ near -1.
Several cuts are imposed to remove backgrounds caused by radioactivity or showering events which may result in bad time reconstruction. The most important cut requires that the position of a muon hit in each scintillator as determined from the timing within the scintillator counter agrees within 70 cm with the position indicated by the streamer tube track.
When a muon hits 3 scintillator layers, there is redundancy in the time measurement and 1/ is calculated from a linear fit of the times as a function of the pathlength. Tracks with a poor fit are rejected. Other minor cuts are applied for the tracks with only two layers of scintillator hit.
It has been observed that downgoing muons which pass near or through MACRO may produce low-energy, upgoing particles. These could appear to be neutrino-induced upward throughgoing muons if the down-going muon misses the detector (Ambrosio 1998a). In order to reduce this background, we impose a cut requiring that each upgoing muon must cross at least 200 g/cm2 of material in the bottom half of the detector. Finally, a large number of nearly horizontal (), but upgoing muons have been observed coming from azimuth angles corresponding to a direction containing a cliff in the mountain where the overburden is insufficient to remove nearly horizontal, downgoing muons which have scattered in the mountain and appear as upgoing. We exclude this region from both our observation and Monte-Carlo calculation of the upgoing events.
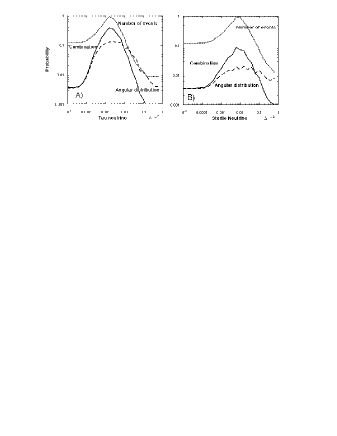
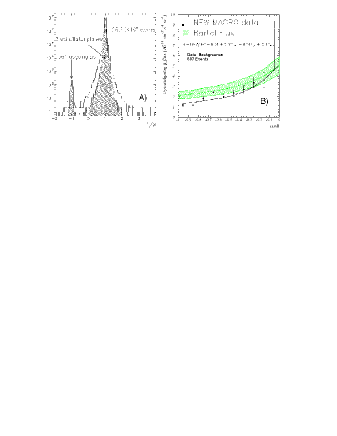
Figure 1A) shows the distribution for the throughgoing data from the full detector running. A clear peak of upgoing muons is evident centered on .
There are 561 events in the range which we define as upgoing muons for this data set. We combine these data with the previously published data (Ahlen, 1995) for a total of 642 upgoing events. Based on events outside the upgoing muon peak, we estimate there are background events in the total data set. In addition to these events, we estimate that there are events which result from upgoing charged particles produced by downgoing muons in the rock near MACRO. Finally, it is estimated that events are the result of interactions of neutrinos in the very bottom layer of MACRO scintillators. Hence, removing the backgrounds, the observed number of upgoing throughgoing muons integrated over all zenith angles is 607.
In the upgoing muon simulation we have used the neutrino flux computed by the Bartol group (Agrawal 1996). The cross-sections for the neutrino interactions have been calculated using the GRV94 (Glück,1995) parton distributions set, which varies by +1% respect to the Morfin and Tung parton distribution that we have used in the past. We estimate a systematic error of 9% on the upgoing muon flux due to uncertainties in the cross section including low-energy effects (Lipari 1995). The propagation of muons to the detector has been done using the energy loss calculation (Lohmann 1985) for standard rock. The total systematic uncertainty on the expected flux of muons adding the errors from neutrino flux, cross-section and muon propagation in quadrature is . This theoretical error in the prediction is mainly a scale error that doesn’t change the shape of the angular distribution. The number of events expected integrated over all zenith angles is 824.6, giving a ratio of the observed number of events to the expectation of 0.74 (stat) (systematic) (theoretical).
Figure 1 B) shows the zenith angle distribution of the measured flux of upgoing muons with energy greater than 1 GeV for all MACRO data compared to the Monte Carlo expectation for no oscillations and with a oscillated flux with and eV2 (dashed line).
The shape of the angular distribution has been tested with the hypothesis of no oscillation excluding the last bin near the horizontal and normalizing data and predictions. The is , for 8 degrees of freedom (probability of 0.35% for a shape at least this different from the expectation). We have considered also oscillations . The best in the physical region of the oscillations parameters is 12.5 for around and maximum mixing (the best is 10.6 , outside the physical region for an unphysical value of ).
To test the oscillation hypothesis, we calculate the independent probability for obtaining the number of events observed and the angular distribution for various oscillation parameters. They are reported for in Figure 2 A) for oscillations. It is notable that the value of suggested from the shape of the angular distribution is similar to the value necessary in order to obtain the observed reduction in the total number of events in the hypothesis of maximum mixing. Figure 2 B) shows the same quantities for sterile neutrinos oscillations (Akhmedov 1993,Liu 1998).
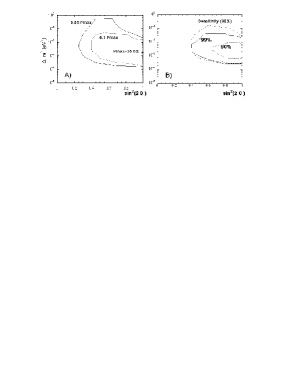
Figure 3 A) shows probability contours for oscillation parameters using the combination of probability for the number of events and of the angular distribution. The maximum of the probability is 36.6% for oscillations . The best probability for oscillations into sterile neutrinos is 8.4%. The probability for no oscillation is 0.36%.
Figure 3 B) shows the confidence regions at the 90% and 99% confidence levels based on application of the Monte Carlo prescription in (Feldman 1998). We plot also the sensitivity of the experiment. The sensitivity is the 90% contour which would result from the preceding prescription when the data are equal to the Monte Carlo prediction at the best-fit point.
3 Conclusions:
The upgoing throughgoing muon data set is in favor of oscillation with parameters similar to those observed by Superkamiokande with a probability of 36.6% against the 0.36% for the no oscillation hypothesis. The probability of oscillations from the angular distributions only is 13%. The probabilities are higher than the ones of the old data (Ambrosio 1998b). The neutrino sterile oscillation hypothesis is slightly disfavored.
References
Agrawal V. et al 1996 Phys. Rev. D53 1314
Ahlen S. et al.(MACRO collaboration) 1995, Phys. Lett. B 357 481
Ahlen S. et al.(MACRO collaboration) 1993, Nucl.Instrum.Meth.A324:337-362
Akhmedov E. , Lipari P. Lusignoli M. 1993, Phys.Lett. B300:128-136
Ambrosio M. et al.(MACRO collaboration) 1998a, Astropart.Phys.9:105-117
Ambrosio M. et al.(MACRO collaboration) 1998b, Phys Lett. B. 434 451
Feldman G. and Cousins R. 1998 Phys. Rev. D57 3873
Fukuda Y. et al. (SuperKamiokande collaboration) 1998a Phys.Rev.Lett.81:1562-1567
Fukuda Y. et al. (SuperKamiokande collaboration) 1998b, e-Print Archive hep-ex/9812014
Glück M., Reya E. and Stratmann M.1995, Z. Phys. C67, 433
Hatakeyama S. et al. (Kamiokande collaboration) 1998, Phys Rev Lett 81 2016
Lipari P. Lusignoli M. and Sartogo F. 1995, Phys. Rev. Lett. 74 4384
Liu Q.Y. and Smirnov A.Yu. 1998, Nucl.Phys. B524 505
Lohmann H. Kopp R.,Voss R. 1985, CERN-EP/85-03
Surdo A. (MACRO collaboration) 1999, HE4.1.06 in this conference