EUROPEAN LABORATORY FOR PARTICLE PHYSICS
CERN-EP/99-045
March 19, 1999
Test of the Flavour Independence of using Next-to-Leading Order Calculations for Heavy Quarks
The OPAL Collaboration
We present a test of the flavour independence of the strong coupling constant for charm and bottom quarks with respect to light (uds) quarks, based on a hadronic event sample obtained with the OPAL detector at LEP. Five observables related to global event shapes were used to measure in three flavour tagged samples (uds, c and b). The event shape distributions were fitted by calculations of jet production taking into account mass effects for the c and b quarks. We find:
and .
(To be submitted to Eur. Phys. Jour. C)
G. Abbiendi2, K. Ackerstaff8, G. Alexander23, J. Allison16, N. Altekamp5, K.J. Anderson9, S. Anderson12, S. Arcelli17, S. Asai24, S.F. Ashby1, D. Axen29, G. Azuelos18,a, A.H. Ball17, E. Barberio8, R.J. Barlow16, J.R. Batley5, S. Baumann3, J. Bechtluft14, T. Behnke27, K.W. Bell20, G. Bella23, A. Bellerive9, S. Bentvelsen8, S. Bethke14, S. Betts15, O. Biebel14, A. Biguzzi5, I.J. Bloodworth1, P. Bock11, J. Böhme14, D. Bonacorsi2, M. Boutemeur33, S. Braibant8, P. Bright-Thomas1, L. Brigliadori2, R.M. Brown20, H.J. Burckhart8, P. Capiluppi2, R.K. Carnegie6, A.A. Carter13, J.R. Carter5, C.Y. Chang17, D.G. Charlton1,b, D. Chrisman4, C. Ciocca2, P.E.L. Clarke15, E. Clay15, I. Cohen23, J.E. Conboy15, O.C. Cooke8, J. Couchman15, C. Couyoumtzelis13, R.L. Coxe9, M. Cuffiani2, S. Dado22, G.M. Dallavalle2, R. Davis30, S. De Jong12, A. de Roeck8, P. Dervan15, K. Desch8, B. Dienes32,h, M.S. Dixit7, J. Dubbert33, E. Duchovni26, G. Duckeck33, I.P. Duerdoth16, P.G. Estabrooks6, E. Etzion23, F. Fabbri2, A. Fanfani2, M. Fanti2, A.A. Faust30, F. Fiedler27, M. Fierro2, I. Fleck10, A. Frey8, A. Fürtjes8, D.I. Futyan16, P. Gagnon7, J.W. Gary4, S.M. Gascon-Shotkin17, G. Gaycken27, C. Geich-Gimbel3, G. Giacomelli2, P. Giacomelli2, V. Gibson5, W.R. Gibson13, D.M. Gingrich30,a, D. Glenzinski9, J. Goldberg22, W. Gorn4, C. Grandi2, K. Graham28, E. Gross26, J. Grunhaus23, M. Gruwé27, C. Hajdu31 G.G. Hanson12, M. Hansroul8, M. Hapke13, K. Harder27, A. Harel22, C.K. Hargrove7, M. Harin-Dirac4, M. Hauschild8, C.M. Hawkes1, R. Hawkings27, R.J. Hemingway6, M. Herndon17, G. Herten10, R.D. Heuer27, M.D. Hildreth8, J.C. Hill5, P.R. Hobson25, A. Hocker9, K. Hoffman8, R.J. Homer1, A.K. Honma28,a, D. Horváth31,c, K.R. Hossain30, R. Howard29, P. Hüntemeyer27, P. Igo-Kemenes11, D.C. Imrie25, K. Ishii24, F.R. Jacob20, A. Jawahery17, H. Jeremie18, M. Jimack1, C.R. Jones5, P. Jovanovic1, T.R. Junk6, N. Kanaya24, J. Kanzaki24, D. Karlen6, V. Kartvelishvili16, K. Kawagoe24, T. Kawamoto24, P.I. Kayal30, R.K. Keeler28, R.G. Kellogg17, B.W. Kennedy20, D.H. Kim19, A. Klier26, T. Kobayashi24, M. Kobel3,d, T.P. Kokott3, M. Kolrep10, S. Komamiya24, R.V. Kowalewski28, T. Kress4, P. Krieger6, J. von Krogh11, T. Kuhl3, P. Kyberd13, G.D. Lafferty16, H. Landsman22, D. Lanske14, J. Lauber15, I. Lawson28, J.G. Layter4, D. Lellouch26, J. Letts12, L. Levinson26, R. Liebisch11, B. List8, C. Littlewood5, A.W. Lloyd1, S.L. Lloyd13, F.K. Loebinger16, G.D. Long28, M.J. Losty7, J. Lu29, J. Ludwig10, D. Liu12, A. Macchiolo18, A. Macpherson30, W. Mader3, M. Mannelli8, S. Marcellini2, A.J. Martin13, J.P. Martin18, G. Martinez17, T. Mashimo24, P. Mättig26, W.J. McDonald30, J. McKenna29, E.A. Mckigney15, T.J. McMahon1, R.A. McPherson28, F. Meijers8, P. Mendez-Lorenzo33, F.S. Merritt9, H. Mes7, A. Michelini2, S. Mihara24, G. Mikenberg26, D.J. Miller15, W. Mohr10, A. Montanari2, T. Mori24, K. Nagai8, I. Nakamura24, H.A. Neal12,g, R. Nisius8, S.W. O’Neale1, F.G. Oakham7, F. Odorici2, H.O. Ogren12, A. Okpara11, M.J. Oreglia9, S. Orito24, G. Pásztor31, J.R. Pater16, G.N. Patrick20, J. Patt10, R. Perez-Ochoa8, S. Petzold27, P. Pfeifenschneider14, J.E. Pilcher9, J. Pinfold30, D.E. Plane8, P. Poffenberger28, B. Poli2, J. Polok8, M. Przybycień8,e, A. Quadt8, C. Rembser8, H. Rick8, S. Robertson28, S.A. Robins22, N. Rodning30, J.M. Roney28, S. Rosati3, K. Roscoe16, A.M. Rossi2, Y. Rozen22, K. Runge10, O. Runolfsson8, D.R. Rust12, K. Sachs10, T. Saeki24, O. Sahr33, W.M. Sang25, E.K.G. Sarkisyan23, C. Sbarra29, A.D. Schaile33, O. Schaile33, P. Scharff-Hansen8, J. Schieck11, S. Schmitt11, A. Schöning8, M. Schröder8, M. Schumacher3, C. Schwick8, W.G. Scott20, R. Seuster14, T.G. Shears8, B.C. Shen4, C.H. Shepherd-Themistocleous8, P. Sherwood15, G.P. Siroli2, A. Sittler27, A. Skuja17, A.M. Smith8, G.A. Snow17, R. Sobie28, S. Söldner-Rembold10,f, S. Spagnolo20, M. Sproston20, A. Stahl3, K. Stephens16, J. Steuerer27, K. Stoll10, D. Strom19, R. Ströhmer33, B. Surrow8, S.D. Talbot1, P. Taras18, S. Tarem22, R. Teuscher9, M. Thiergen10, J. Thomas15, M.A. Thomson8, E. Torrence8, S. Towers6, I. Trigger18, Z. Trócsányi32, E. Tsur23, M.F. Turner-Watson1, I. Ueda24, R. Van Kooten12, P. Vannerem10, M. Verzocchi8, H. Voss3, F. Wäckerle10, A. Wagner27, C.P. Ward5, D.R. Ward5, P.M. Watkins1, A.T. Watson1, N.K. Watson1, P.S. Wells8, N. Wermes3, D. Wetterling11 J.S. White6, G.W. Wilson16, J.A. Wilson1, T.R. Wyatt16, S. Yamashita24, V. Zacek18, D. Zer-Zion8
1School of Physics and Astronomy, University of Birmingham,
Birmingham B15 2TT, UK
2Dipartimento di Fisica dell’ Università di Bologna and INFN,
I-40126 Bologna, Italy
3Physikalisches Institut, Universität Bonn,
D-53115 Bonn, Germany
4Department of Physics, University of California,
Riverside CA 92521, USA
5Cavendish Laboratory, Cambridge CB3 0HE, UK
6Ottawa-Carleton Institute for Physics,
Department of Physics, Carleton University,
Ottawa, Ontario K1S 5B6, Canada
7Centre for Research in Particle Physics,
Carleton University, Ottawa, Ontario K1S 5B6, Canada
8CERN, European Organisation for Particle Physics,
CH-1211 Geneva 23, Switzerland
9Enrico Fermi Institute and Department of Physics,
University of Chicago, Chicago IL 60637, USA
10Fakultät für Physik, Albert Ludwigs Universität,
D-79104 Freiburg, Germany
11Physikalisches Institut, Universität
Heidelberg, D-69120 Heidelberg, Germany
12Indiana University, Department of Physics,
Swain Hall West 117, Bloomington IN 47405, USA
13Queen Mary and Westfield College, University of London,
London E1 4NS, UK
14Technische Hochschule Aachen, III Physikalisches Institut,
Sommerfeldstrasse 26-28, D-52056 Aachen, Germany
15University College London, London WC1E 6BT, UK
16Department of Physics, Schuster Laboratory, The University,
Manchester M13 9PL, UK
17Department of Physics, University of Maryland,
College Park, MD 20742, USA
18Laboratoire de Physique Nucléaire, Université de Montréal,
Montréal, Quebec H3C 3J7, Canada
19University of Oregon, Department of Physics, Eugene
OR 97403, USA
20CLRC Rutherford Appleton Laboratory, Chilton,
Didcot, Oxfordshire OX11 0QX, UK
22Department of Physics, Technion-Israel Institute of
Technology, Haifa 32000, Israel
23Department of Physics and Astronomy, Tel Aviv University,
Tel Aviv 69978, Israel
24International Centre for Elementary Particle Physics and
Department of Physics, University of Tokyo, Tokyo 113-0033, and
Kobe University, Kobe 657-8501, Japan
25Institute of Physical and Environmental Sciences,
Brunel University, Uxbridge, Middlesex UB8 3PH, UK
26Particle Physics Department, Weizmann Institute of Science,
Rehovot 76100, Israel
27Universität Hamburg/DESY, II Institut für Experimental
Physik, Notkestrasse 85, D-22607 Hamburg, Germany
28University of Victoria, Department of Physics, P O Box 3055,
Victoria BC V8W 3P6, Canada
29University of British Columbia, Department of Physics,
Vancouver BC V6T 1Z1, Canada
30University of Alberta, Department of Physics,
Edmonton AB T6G 2J1, Canada
31Research Institute for Particle and Nuclear Physics,
H-1525 Budapest, P O Box 49, Hungary
32Institute of Nuclear Research,
H-4001 Debrecen, P O Box 51, Hungary
33Ludwigs-Maximilians-Universität München,
Sektion Physik, Am Coulombwall 1, D-85748 Garching, Germany
a and at TRIUMF, Vancouver, Canada V6T 2A3
b and Royal Society University Research Fellow
c and Institute of Nuclear Research, Debrecen, Hungary
d on leave of absence from the University of Freiburg
e and University of Mining and Metallurgy, Cracow
f and Heisenberg Fellow
g now at Yale University, Dept of Physics, New Haven, USA
h and Depart of Experimental Physics, Lajos Kossuth University, Debrecen, Hungary.
1 Introduction
According to the theory of strong interactions, Quantum Chromodynamics (QCD) [1], the strong coupling constant is the same for all quark flavours. Therefore a precise measurement of for the individual quark flavours is an important test of this theory. The coupling constant for charm and bottom quarks can be compared to for light (uds) quarks by measuring the ratios and using hadronic events of the type . The coupling constants are measured using an event sample originating from a pair of light quarks (, or ), c quarks () or b quarks (), respectively. If either of the above ratios deviates significantly from unity then this may indicate physics beyond the Standard Model.
In many QCD studies at LEP corrections due to quark mass effects can be safely ignored because they typically appear as powers of the ratio of the quark mass to the total energy. However, in those studies where is determined in event samples enriched in heavy quarks, mass effects become non-negligible. Gluon emission by bottom quarks, and to a lesser extent charm quarks, will be suppressed largely due to the reduced phase-space available. Observables sensitive to the three-jet rate measured in heavy quark events will be modified with respect to the same quantities measured in light quark events.
Tests of the flavour independence of have previously been conducted at both LEP and SLC [2, 3, 4, 5, 6, 7] using ratios of for one flavour over of either the complementary 111For example, for c quarks was compared to for a mixture of u, d, s and b quarks. or inclusive quark mixture. In all these tests flavour independence of was confirmed. These tests, however, used either massless QCD calculations or a leading order calculation with massive quarks [8]. The leading order calculation includes the process , with mass effects, but virtual corrections to the process are not included.
Complete next-to-leading-order (NLO) calculations of the heavy-flavour production cross section in collisions, including quark mass effects, have been published recently [9, 10, 11]. A comparison between these calculations has been made and they were found to be in agreement [11]. In recent publications DELPHI [12] and SLD [13] report on measurements of where NLO massive calculations [9, 10] were used to account for mass effects in b quark events. These results are consistent with the flavour independence of .
In this study we use the results of P. Nason and C. Oleari [11] along with theoretical predictions assuming massless quarks in fits to global event shape distributions in order to determine , and . The results presented here are intended to update and supersede the corresponding OPAL results in [2, 3] insofar as we now have greatly increased the charm event statistics and have used improved theoretical predictions.
This paper is organised as follows. In Sect. 2 the parts of the OPAL detector most important to this analysis are described. In Sect. 3 the hadronic event sample and the Monte Carlo event sample are introduced. In Sect. 4 and 5 the flavour tagging methods are described. In Sect. 6 the event shape observables used in this study are introduced and the procedure for correcting the event shape distributions is explained. Next, in Sect. 7, the procedure for fitting the NLO QCD prediction to the corrected distributions is explained and in Sect. 8 the systematic uncertainties that have been taken into account are discussed. In Sect. 9, the results of the test of flavour independence of are presented. Finally, in Sect. 10, conclusions are drawn.
2 The OPAL detector
The OPAL detector operates at the LEP collider at CERN. A detailed description can be found in Refs. [14, 15]. The analysis presented here relies mainly on the reconstruction of charged particle trajectories and momenta in the central tracking chambers, on energy deposits (“clusters”) in the electromagnetic calorimeters and on information from the silicon micro-vertex detector.
All tracking systems are located inside a solenoidal magnet which provides a uniform magnetic field of 0.435 T along the beam axis222In the OPAL coordinate system the axis points towards the centre of the LEP ring, the axis points upwards and the axis points in the direction of the electron beam. The polar angle and the azimuthal angle are defined with respect to the - and -axes, respectively, while is the distance from the -axis.. The magnet is surrounded by a lead glass electromagnetic calorimeter and a hadron calorimeter of the sampling type. Outside the hadron calorimeter, the detector is surrounded by a system of muon chambers. There are similar layers of detectors in the barrel () and endcap () regions.
The central tracking detector consists of a silicon micro-vertex detector [15] and three drift chamber devices: the vertex detector, a large jet chamber, and surrounding -chambers. The silicon micro-vertex detector, close to the beam pipe, consists of two layers of silicon strips with a single-hit resolution of about 7 m in the plane. The vertex chamber is a cylindrical drift chamber covering a range of . Its single hit resolution is 50 m in the plane and 700 m in the direction. The jet chamber is a cylindrical drift chamber with an inner radius of 25 cm, an outer radius of 185 cm, and a length of about 4 m. Its spatial resolution is about 135 m in the plane from drift time information and about 6 cm in the direction from charge division. The -chambers provide a more accurate measurement with a resolution of about 300 m. In combination, the three drift chambers yield a momentum resolution of for , where is the transverse momentum in GeV/.
Electromagnetic energy is measured by lead glass calorimeters surrounding the solenoid magnet coil. They consist of a barrel and two endcap arrays with a total of 11704 lead glass blocks covering a range of .
3 Event sample and Monte Carlo simulation
This analysis is based on a sample of 4.4 million hadronic decays of the recorded with the OPAL detector between 1990 and 1995. Hadronic decays were selected by placing requirements on the number of reconstructed tracks and the energy deposited in the calorimeter. A detailed description of the criteria is given in [16]. The parts of the detector essential for the present analysis (central detector and electromagnetic calorimeter) were required to be fully operational. The track selection criteria were the same as presented in a previous OPAL study [17]. The number of accepted tracks was required to be at least five to reduce background. Clusters of electromagnetic energy were used if their observed energy was greater than 0.25 GeV, and known noisy channels in the detector were ignored. The event thrust axis [17] was determined using all accepted tracks and clusters, and its direction was required to fulfil the condition in order that the event be well contained. Using these selection criteria, Monte Carlo studies indicate that, within the chosen range of , 99.860.07% of hadronic decays are accepted, with a contamination of about 0.14% from events, and around 0.07% from two-photon interactions [17].
To correct the measured event shape distribitions (see Sect. 6.1), 4 million hadronic decays of the have been simulated using the JETSET 7.4 Monte Carlo model [18] with parameters tuned to represent OPAL data well [19]. For all simulated events heavy quark fragmentation has been implemented using the model of Peterson et al. [20]. All events have been passed through a detailed simulation of the OPAL detector [21] before being analysed using the same programs as for data.
4 Selection of uds and b quark events
Two event samples, one enriched in uds quark events and one enriched in b quark events, were selected by first determining the number of tracks in each event () with a large impact parameter significance, . Here is the distance of closest approach in the plane of the track to the interaction point (IP) and its error. The sign of was determined with respect to the crossing point between the track and the jet axis. is positive if the track crosses the jet axis downstream of the IP and negative otherwise. An event was classified as having a high probability to have come from light quarks if was zero and from b quarks if . In the text below these will be referred to as the “uds-tag” and the “b-tag” event samples.
For the uds and b quark event selection all data recorded during 1994 were used. This represents 1.4 million events. The analysis was restricted to only the 1994 data because of the uniform configuration of the silicon micro-vertex detector during this time period. In addition to the track selection criteria outlined above, the track was required to contain at least one silicon hit and an algorithm was applied to reject tracks which were consistent with arising from photon conversions [22]. In order for the event to be contained within the acceptance of the silicon micro-vertex detector the event’s thrust axis was further restricted to lie within the range .
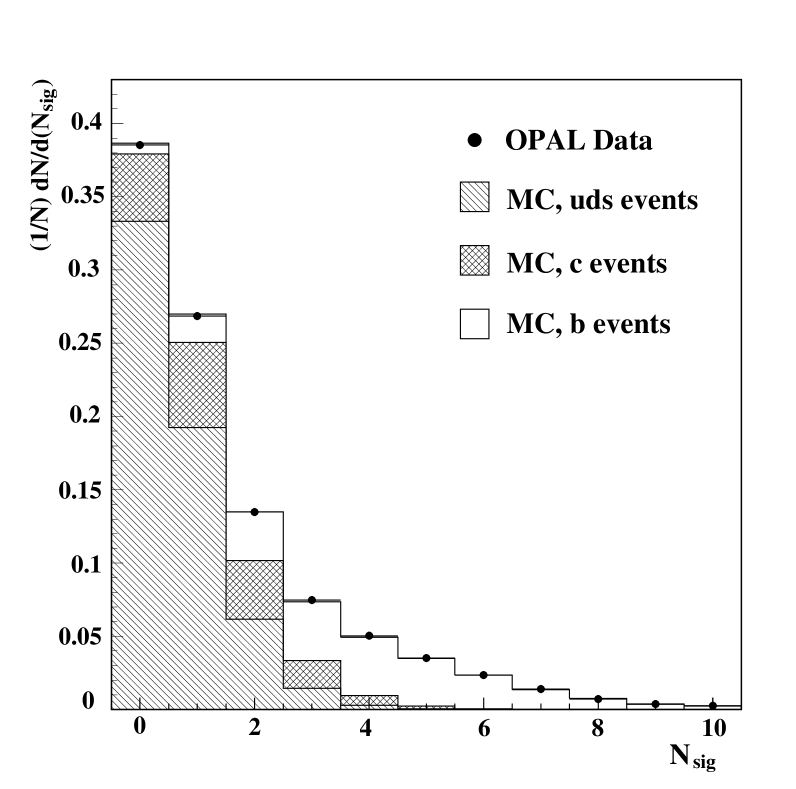
The distribution of is shown in Fig. 1 compared with the result of Monte Carlo simulation. The simulation is decomposed into the contributions from uds, c and b quark events. The general agreement between the sum of the three contributions from Monte Carlo and the data is good.
This tagging procedure resulted in 325 111 events selected for the uds-tag event sample and 71 521 for the b-tag event sample. The flavour compositions of the uds-tag and the b-tag event samples as determined from the Monte Carlo, along with their combined statistical and systematic errors, are presented in Table 1. The efficiency for tagging uds events was about 35% and for tagging b events 23%.
4.1 Uncertainties in Flavour Composition
The systematic errors on the flavour compositions result from uncertainties in the detector modelling and imprecise knowledge of physics processes. For each source of uncertainty some aspect of the Monte Carlo was varied and the flavour composition of the uds-tag and b-tag event samples were recalculated. The difference between the flavour fractions calculated for each variation and the central value was taken as a systematic error on the determined flavour fractions.
4.1.1 Detector Modelling Uncertainties
Since the determination of the flavour fractions of the uds-tag and the b-tag event sample depend on Monte Carlo this requires an accurate simulation of the detector resolution for charged tracks measured with the silicon micro-vertex detector. The simulation has been tuned to reproduce the tracking resolutions seen in data by studying the impact parameter distributions of tracks, as functions of track momentum, polar angle and the different sub-detectors contributing hits. This tuning procedure was affected by uncertainties in the radial alignment within the silicon micro-vertex detector, the efficiency for associating silicon hits to tracks and the modelling of known inefficient regions, and the overall track reconstruction efficiency. These uncertainties were evaluated according to the procedure given in [23] and their effect on the flavour fractions determined from Monte Carlo was calculated. In addition, the agreement between data and Monte Carlo in Fig. 1 was improved by degrading the resolution of impact parameters in the Monte Carlo simulation by 5%. This was done by applying a single multiplicative factor to the difference between the reconstructed and true impact parameters. Fig. 1 is shown with this smearing applied. To evaluate the sensitivity of the determined flavour fractions to the tracking resolution the Monte Carlo smearing was removed.
4.1.2 Physics Modelling Uncertainties
The tagging efficiencies of the uds and b tags for the various quark flavours are also sensitive to various physics input parameters in the Monte Carlo simulation. The rate of gluon splitting to was varied in the range , based on the OPAL measurement [24], and the rate of gluon splitting to was varied in the range , based on theoretical expectation [25]. The error due to these two sources was negligible. The production fractions of the different weakly decaying b hadrons were varied according to the experimental uncertainties [26]. The production fractions of the weakly decaying c hadrons, the fragmentation of b and c quarks, and the charged decay multiplicities and lifetimes of b and c hadrons were varied according to the prescription given in [23]. The largest effect on the tag flavour fractions comes from the b hadron charged decay multiplicity. All these uncertainties, along with the uncertainties due to the detector modelling, were added in quadrature and are given as the errors on the flavour fraction shown in Table 1.
5 Selection of c quark events
Events having a high probability to have originated from were identified by the presence of a highly energetic D∗+ meson333Throughout this paper charged conjugate modes are always implicitly included.. These events will be referred to in the text below as the “c-tag” event sample. For the D∗+ reconstruction and the determination of the flavour composition of the c-tag event sample the methods of a previous OPAL study have been used [27]. In brief, five D∗+ decay modes were searched for:
| “3 prong” , | |
| “satellite” , | |
| “5 prong” , | |
| “electron” , | |
| “muon” . |
No attempt was made to reconstruct the in the satellite channel, nor the neutrino direction or energy in the electron and muon channels. The last two channels are referred to as “semileptonic” channels in the following text. A number of tracks appropriate for the selected channel were combined to form a D0 candidate and their invariant mass was calculated. Candidates were selected if the reconstructed mass lay within the expected range for that channel. After adding a further track as a possible pion from the D∗+ decay, the combined mass was calculated and the candidate was selected if the mass difference was within certain limits. Some of the D∗+ selection criteria are given in Table 2.
To reduce the background in the c-tag event sample we required , where is the scaled energy444In this paper any reference to the scaled energy of a D∗+ candidate is to be understood as being the calculated energy of the D∗+, , obtained from the reconstructed tracks, without correcting for missing or wrongly associated tracks, divided by the beam energy . of the D∗+ meason. For the 5-prong event selection we required . This cut is effective in rejecting D∗+ mesons which originate from cascade decays of B hadrons and from events where a gluon splits into a pair of charm quarks.
The distribution of for all five decay channels is presented in Fig. 2. The points with error bars are the signal candidates and the solid histograms are background estimator distributions constructed from data. The background estimator was constructed by choosing the candidate for the pion in the decay from the opposite hemisphere relative to the rest of the decay products, reflecting it through the orgin, and then using it in the calculation of the invariant mass.
A significant fraction of the sample of D∗+ mesons were only partially reconstructed. These mesons produce an enhancement in the spectrum very similar to the true signal. Only a few of the events are present in the 3-prong sample. They are more important in the 5-prong tagged events where a clear tail is visible in the distribution for values above 0.145 GeV (see Fig. 2d). Since such events originate from D∗+ decays, they can still be used in the analysis.
In all, 27 005 D∗+ candidate events were selected and the background was estimated to be events, where the error on the number of background events is statistical only. All of the LEP-1 data recorded by OPAL, 4.4 million events, was used for the D∗+ event selection. The candidate events are composed of three components: genuine D∗+ mesons from b events, genuine D∗+ mesons from c events and combinatorial background which is a mixture of uds, c and b quark events. Genuine D∗+’s from uds quark events can only occur in events where a gluon splits into two heavy quarks. The possibility of D∗+’s from this source was neglected because these events are highly suppressed due to the high cut. Using Monte Carlo simulation the total contribution of this source to the number of D∗+ candidates was found to be %, where the error quoted is due to Monte Carlo statistics.
In Ref. [27] the fraction of genuine D∗+ mesons originating from c events was determined by OPAL to be , where the error is the combined statistical and systematic error. The fraction of genuine D∗+ mesons from b events is given by .
The fractions of uds, c and b quark events in the combinatorial background, as determined from Monte Carlo, were , and , respectively. The errors are a combination of statistical errors due to finite Monte Carlo statistics and a systematic error accounting for the overall quality of the background estimation procedure. Based on a Monte Carlo study [27] the background estimate was found to be accurate to within 1%, and an additional 1% error was therefore assigned to the number of background events. Since that study was flavour blind, a conservative approach was taken here where the entire error was assigned in turn to each flavour component in the combinatorial background.
The overall flavour composition of the c-tag event sample is presented in Table 1 along with the combined statistical and systematic errors. The efficiency for tagging c events was about 2.0%.
6 Event shape observables
For each flavour tagged event sample described above (uds-tag, c-tag and b-tag) the distributions of the event shape variables 1-Thrust (), Heavy Jet Mass scaled by the centre-of-mass energy (), Wide Jet Broadening (), the at which an event changes from being a 2-jet event to being a 3-jet event () determined using the Durham jet finder and the C-parameter () were determined. The definitions for these observables are given in [17, 28] and the references therein. These quantities were measured using all tracks and electromagnetic clusters which satisfied the selection criteria described in Sect. 3.
In order to extract the values of and , the measured event shape distributions were fitted using a QCD analytic calculation [11]. Since the QCD calculation is only valid for event shape distributions determined from final-state partons, hadronization effects caused by the transformation of final-state partons into hadrons, which are experimentally accessible, must be taken into account. This was done by applying correction factors to the analytic predictions.
The measured event shape distributions must be corrrected for experimental effects which distort them. These effects include finite detector resolution, initial-state photon radiation and biases introduced by the flavour tagging methods. In the text below describing the correction procedure the term detector level is used to refer to distributions determined using the measured tracks and electromagnetic clusters and hadron level to refer to these distributions corrected for detector resolution, initial state radiation and biases introduced by the flavour tagging methods. The comparisons between the measured distributions and the QCD predictions were performed at the hadron level.
The event shape variable Total Jet Broadening () [17] was initially considered to be included in this analysis. It was found, however, that for the distribution of measured with b quark events, the size of the hadronization corrections were greater that 20% over the entire distribution. Therefore this variable was dropped from further consideration.
6.1 Correction procedure
In the first step the selected events were corrected for distortions caused by finite detector resolution using an unfolding matrix. The unfolding matrix was constructed using a Monte Carlo data sample including initial-state radiation, full detector simulation and subjected to the same event selection criteria that were applied to the data. The Monte Carlo events which pass the selection criteria were used to calculate a correction matrix . The element gives the probability that an event shape observable measured at the detector level and located in bin of its corresponding distribution, has migrated from bin on the hadron level. A matrix was computed for each event shape observable and flavour-tagged event sample, “q-tag”, where q-tag was either uds-tag, c-tag or b-tag.
In the next step bin-by-bin corrections are used to correct the data for biases introduced by the flavour tagging methods, event acceptance and the effects of initial-state photon radiation. Defining to be the number of events of flavour in the untagged Monte Carlo sample and the number of events with the tag applied, the correction factor for the -th bin is given by
| (1) |
The factors , taken from Table 1, are the fractions of events of flavour in each flavour-tagged event sample. The terms are normalized to the total number of events of flavour .
Fig. 3 shows, as an example, the size of the bin-by-bin corrections for the observable measured using each flavour-tagged event sample. The size of the corrections for were typical of the other event shape observables studied. One can see for the distributions measured with the uds-tag and b-tag event samples that, within the chosen fit range, the size of the corrections are about 10%. (An explanation of how the fit range was chosen is presented in the next section.) In contrast, the size of the corrections for the c-tag event sample were an order of magnitude larger. This is due to a kinematic bias introduced by requiring the events in the c-tag sample to contain a high- meson.
The number of events in bin corrected to the hadron level is given by
| (2) |
where is the uncorrected number of events in the -th bin of the event shape distributions in question. This correction procedure does not depend on the values of , or in the Monte Carlo samples.
The resulting distributions normalized to the total hadronic cross section are given by
| (3) |
where is the width of the -th bin and corresponds to one of the five event shapes studied.
7 Fit procedure
The value of and the ratios and were determined by simultaneously fitting theoretical predictions for a particular event shape observable to three hadron-level event shape distributions: one determined with the uds-tag event sample, one with the c-tag event sample and one with the b-tag event sample. The theoretical predictions were given by a linear combination of the theoretical predictions for each of the three tagged flavours:
| (4) | |||||
The coefficients are the flavour fractions given in Table 1 and (, ( and ( are the theoretical predictions for an event shape observable measured with a sample of uds, c and b quark events, respectively. The factors correct the theoretical prediction for a particular tagged flavour for hadronization effects so that the theoretical predictions, valid for final state partons, can be compared directly with the measured distributions corrected to the hadron level.
The hadronization correction factors were computed from JETSET 7.4 using the parton shower option by taking the ratio of an event shape distribution at the hadron level to the same distribution at the parton level. Here the parton level is defined by the cut-off of the QCD shower in JETSET which is set to 1.9 GeV [19]. After the termination of the parton shower the partons are transformed into hadrons using string hadronization [29]. For this process we choose a hybrid scheme for the longitudinal fragmentation function where light quarks are treated with the symmetric Lund fragmentation function and charm and bottom quarks according to the model of Peterson et al. [20]. The c and b quark masses in JETSET were set to their default values of 1.35 GeV and 5.0 GeV, respectively.
In Equation (4), the differential cross section of a generic observable , for massless quarks, normalized to the total hadronic cross section is given by [30]
| (5) | |||||
The coefficients and are the and QCD coefficients, respectively, is the one-loop cross section for the process and is the coefficient of the QCD beta function for one-loop [26]. The renormalization scale can be related to the centre-of-mass energy by
| (6) |
where is the renormalization scale factor. The coefficients and were obtained for each event shape observable by integrating the matrix elements in [30]. In Equation (5), in addition to the approximation of massless quarks, the simplifying assumption was made that is the same for up, down and strange quarks.
The terms ( and ( in Equation (4) were both given by an expression for massive quarks. This expression has only recently been made available [11]. The result of this calculation was implemented in a FORTRAN program named ZBB4 [31] analogous to the program EVENT [32] which was used to integrate the matrix elements of the massless calculation. ZBB4 was run separately for c quark and b quark events in order to calculate the and coefficients for the massive calculation. This calculation was performed in the pole mass scheme and the c and b quark pole masses were set to 1.35 GeV and 5.0 GeV, respectively.
The differential cross section of a generic observable , for massive quarks, normalized to the total hadronic cross section is given by [31]
| (7) | |||||
where is either c or b and is the energy scale corresponding to the heavy quark pole mass.
When performing the fit using Equation (4) we make the substitution and . This substitution enables , and to be determined directly as free parameters in the fit and allows correlations between these variables to be properly taken into account. In tests with Monte Carlo events it was verified that this fitting procedure was sensitive to changes in for c and b quarks with respect to uds quarks.
The fit ranges for each observable were determined by the range of where the parton to hadron level corrections were below 10% and the resulting remained small ( for and for the rest). The remaining variations of the fit results due to the choice of the fit ranges were taken as systematic uncertainties. It was also checked that within the fit range the calculation and the JETSET parton shower model were in agreement with each other. The fit ranges used for this analysis are slightly smaller than the fit ranges used in previous OPAL studies [17, 28] which used calculations in fits to global event shapes. This is because the hadronization corrections for distributions of event shape variables calculated with b quark events are generally larger than the corrections for distributions calculated with an inclusive event sample. Consequently, the range of the distribution in which the corrections are below 10% is smaller.
The fit ranges, and the results of the fits with are shown in Table 3. The values for obtained appear large when compared with measurements performed using resummed NLO calculations [17]. This is due to the fact that fixed order QCD calculations, valid only to , were used here.
To estimate the error in our results due to the choice of the renormalization scale we adopted a method used in another OPAL analysis [28] which used fits to global event shapes. We performed fits with fixed equal one, and fits in which was an additional free parameter. The average of the two results is taken as our main result, and half their difference as the “scale uncertainty”. The result of fits with as a free parameter are presented in Table 4. One sees that the values of decrease for all event shapes and that the values of d.o.f. show a significant improvement. This strong scale dependence is typical of determinations of where fixed order calculations are used. It was checked that the values of determined here were consistent with previous OPAL measurements of [17, 28]. The possibility of a different scale dependence for heavy quark events, due to mass effects present in higher order terms, was investigated by introducing a separate parameter for each quark flavour. The effect was found to be negligible within the statistical precision of the measurement.
In Figs. 4 through 6 the results of fits with are plotted along with the measured distributions corrected to the hadron level. The fit ranges used are indicated by the arrow on each figure. It can be seen that within the fit ranges the agreement between the fit results and the data are good. In Fig. 4 one sees a small disagreement between the fit results and the data for values of . When the fits to were repeated with as a free parameter, the agreement between the fit results and data were good over the entire fit range.
8 Systematic uncertainties
The main result was obtained using the default selection and correction procedure described above. The systematic uncertainties were divided into two groups: experimental and theoretical uncertainties. Each uncertainty was estimated by modifying details of the event selection and correction procedure and repeating the analysis. The difference between the results obtained with the standard analysis and the results obtained with the analysis corresponding to each variation were taken (unless otherwise noted) as symmetric systematic errors. In the case where a parameter was varied above or below its nominal value, the largest deviation from the main result was taken as a symmetric systematic error associated with that parameter. Finally, the systematic errors for each type of variation were added in quadrature. The systematic uncertainties investigated are described below and the effects they had on the ratios and are presented in Tables 5 and 6.
8.1 Experimental systematic uncertainties
-
•
The error due to the uncertainty on the flavour composition of the flavour-tagged event samples was evaluated by varying the flavour fractions in Table 1 within their errors.
-
•
For the central result event shape observables were measured using all charged tracks and electromagnetic clusters. To evaluate the relative response of the central tracking and the electromagnetic calorimeter the measurements were performed again using electromagnetic clusters only and charged tracks only.
-
•
The homogeneity of the response of the detector in the endcap region was checked by restricting the analysis to the barrel region of the detector, requiring the thrust axis of accepted events to lie within the range . This only modifies event shape distributions measured with the c-tag event sample because the uds-tag and b-tag event samples are already restricted to the barrel region.
-
•
The minimum number of accepted charged tracks was increased from 5 to 7 in order to further suppress background from events and two-photon interactions.
-
•
The dependency of the result on the chosen fit range was evaluated by adding or subtracting one bin from the lower and upper end of the fit range. Each new fit range was treated as a separate systematic variation.
-
•
In the charm event selection the requirement that leads to a large kinematic bias in the c-tag event sample. The uncertainty due to this aspect of the selection was evaluated by varying the cut between 0.3 and 0.5.
8.2 Theoretical systematic uncertainties
-
•
The fragmentation of the final-state partons into hadrons was modelled by JETSET where the longitudinal fragmentation function for light quarks was treated by the symmetric Lund model and for heavy quarks by the model of Peterson et al [20]. The parameters for each model were determined from a fit to OPAL data on global event shapes [19]. This fit yielded a value of (PARJ(42)) for the Lund model and (PARJ(54)) and (PARJ(55)) for the Peterson model. To evaluate the systematic error due to uncertainties in the JETSET hadronization model these parameters were varied independently within one standard deviation of their optimised values.
-
•
In JETSET, the parameter (PARJ(82)) is the virtuality cut-off of partons. It determines the boundary between the pertubative QCD and hadronization phases and is essentially arbitrary. The optimum value to describe the OPAL data was determined to be GeV [19] . This parameter was varied within one standard deviation of its optimised value.
-
•
The width of the transverse momentum distributions of quarks and antiquarks produced in the fragmentation process is determined by the parameter GeV (PARJ(21)). This parameter was varied within one standard deviation of its optimum value.
-
•
The renormalization scale uncertainty was estimated by performing fits with fixed equal one, and fits in which is an additional free parameter. The average of the two results is taken as our main result, and half their difference as the scale uncertainty.
-
•
To evaluate the dependence of this analysis on the choice of using JETSET to calculate the hadronization corrections, the analysis was repeated using ARIADNE 4.08 [33] instead of JETSET. The ARIADNE parton shower is based upon a colour dipole model and provides an alternative to the Lund parton shower model in JETSET. ARIADNE employs the same fragmentation model as JETSET for the subsequent hadronization. The difference between the results using JETSET hadronization corrections and ARIADNE corrections were used as an estimate of this systematic error.
-
•
The error due to uncertainties in the c and b quark masses was evaluated by varying the quark masses in the ranges given in [26] and repeating the integration of the matrix elements corresponding to massive quarks for each variation. The value for the b quark pole mass was varied from 4.5 to 5.5 GeV/; the c quark pole mass was varied from 1.2 to 1.9 GeV/.
9 Results
The results of the fits to determine and for each of the event shape observables studied are presented in Tables 5 and 6 and summarised in Fig. 7. The values quoted are the average of fits with and with as a free parameter. The top half of the Fig. 7 shows the result of determining and the lower half . The vertical bars on the error bars show the size of the statistical error and the full error bar is the total error, which is the sum of the statistical, experimental systematic and theoretical errors added in quadrature. Also shown is the weighted mean of the results obtained with the six observables. The weights were given by the reciprocal of the square of the total error on the ratios and given in Tables 5 and 6. The statistical error on the mean was calculated taking into account correlations between the five observables. The correlation matrix was calculated from 100 Monte Carlo event samples. The systematic uncertainty on the weighted mean was determined from the change in the mean that occurred when each systematic check was applied to all the event shape distributions simultaneously. The mean values of and were determined to be
In both cases the results are consistent with unity, indicating flavour independence of .
As shown in Table 6, the largest experimental systematic error on the results obtained from the variable originated from moving the lower bound of the fit range from to 0.025. It was found that this relatively large variation in the result was due to a small discrepancy between the data and the Monte Carlo, of the order of a few percent, for values of . If one excludes the results obtained from from the calculation of the weighted means, the mean value obtained for remains unchanged within the experimental precision, while the mean value of changes from 0.997 to 0.990.
The size of the mass effect for c and b quarks and its relevance to the measurement of are also of interest. From phase space considerations one can estimate the size of the mass effects for 3-jet observables. The ratio of the phase space of two massive quarks and a gluon to the phase space for three massless particles is [34]. This represents a 7% effect for M GeV/ and 0.7% for M GeV/.
Fig. 8a shows the ratios and determined using massless calculations for both uds and c quarks and massive calculations for b quarks. Again we show the average of fits with = 1.0 and as a free parameter. One sees a small systematic shift of with respect to the fits with the massive calculation, although the large statistical error on the measurements for c quarks makes a definitive statement on the exact size of the mass effect difficult. In Fig. 8b, and were determined using massless calculations for uds and b quarks and massive calculations for c quarks. In this case shows a large systematic shift of order 5 to 7%. It should be noted that the values of and remained unchanged within their statistical errors with respect to the results presented in Fig. 7, therefore the change in can be attributed entirely to changes in . This sensitivity to the b quark pole mass ( ) suggests that this effect could be exploited to measure itself, by assuming flavour independence of and fitting for . Monte Carlo studies show that the value of determined in this way depends strongly on the input value of used in JETSET to calculate hadronization corrections, thus making a determination of in this way problematic.
As expected, fits to do not exhibit the mass effect like the other variables do. Here the quark mass fixes a lower bound of the distribution since the invariant mass of the jet cannot be less than the mass of the quark that originates the jet. For = 5.0 GeV the lower bound lies at about , which is well outside of the fit range.
10 Conclusion
We have presented a test of the flavour independence of the strong coupling constant for charm and bottom quarks with respect to light (uds) quarks. This analysis was based on a sample of hadronic decays of the resonance recorded by the OPAL detector at LEP. The global event shapes , , , and were used to measure in three flavour tagged event samples (uds, c and b). The event shape distributions were fitted by calculations of jet production taking into account mass effects for the c and b quarks. The ratios and were both found to be consistent with unity, indicating the flavour independence of .
The measurement of achieved a precision of 5%. The relatively large statistical error was due to the low efficiency for tagging c quark events () which relied on finding D∗+ mesons. The experimental error was dominated by varying the cut on the scaled energy of the D∗+ mesons which was required to reduce the background from c quark events coming from cascade decays of b hadrons. The measurement of achieved a 1.5% precision, the error being dominated by the theoretical systematic error. The largest theoretical errors were due to uncertainties in the b quark mass and the renormalization scale factor .
In addition, we have presented a study of the effect of heavy quark masses on global event shape variables. It was observed that the values of determined from , , and were reduced by 5 to 7% when these event shapes were measured with a sample of b quark events and a massless QCD calculation was used. The shape variable was found to be insensitive to the b quark mass.
11 Acknowledgements
We particularly wish to thank the SL Division for the efficient operation
of the LEP accelerator at all energies
and for their continuing close cooperation with
our experimental group. We thank our colleagues from CEA, DAPNIA/SPP,
CE-Saclay for their efforts over the years on the time-of-flight and trigger
systems which we continue to use. In addition to the support staff at our own
institutions we are pleased to acknowledge the
Department of Energy, USA,
National Science Foundation, USA,
Particle Physics and Astronomy Research Council, UK,
Natural Sciences and Engineering Research Council, Canada,
Israel Science Foundation, administered by the Israel
Academy of Science and Humanities,
Minerva Gesellschaft,
Benoziyo Center for High Energy Physics,
Japanese Ministry of Education, Science and Culture (the
Monbusho) and a grant under the Monbusho International
Science Research Program,
Japanese Society for the Promotion of Science (JSPS),
German Israeli Bi-national Science Foundation (GIF),
Bundesministerium für Bildung, Wissenschaft,
Forschung und Technologie, Germany,
National Research Council of Canada,
Research Corporation, USA,
Hungarian Foundation for Scientific Research, OTKA T-016660,
T023793 and OTKA F-023259.
References
-
[1]
H. Fritzsch, M. Gell-Mann, 16’th Int. Conf. on High
Energy Physics, Chicago (1972);
H. Fritzsch, M. Gell-Mann and H. Leutwyler, Phys. Lett. B47 (1973) 365;
D. Gross and F. Wilczek, Phys. Rev. Lett. 30 (1973) 1343;
H.D. Politzer, Phys. Rev. Lett. 30 (1973) 1346. - [2] OPAL Collaboration: R. Akers et al., Z. Phys. C60 (1993) 397.
- [3] OPAL Collaboration: R. Akers et al., Z. Phys. C65 (1995) 31.
- [4] L3 Collaboration: B. Adeva et al., Phys. Lett. B271 (1991) 461.
- [5] DELPHI Collaboration: P. Abreu et al., Phys. Lett. B307 (1993) 221.
- [6] ALEPH Collaboration: D. Buskulic et al., Phys. Lett. B355 (1995) 381.
- [7] SLD Collaboration: K. Abe et al., Phys. Rev. D53 (1996) 2271.
-
[8]
A. Ballestrero, E. Maina and S. Moretti,
Phys. Lett. B294 (1992) 425;
A. Ballestrero, E. Maina and S. Moretti, Nucl. Phys. B415 (1994) 265. -
[9]
G. Rodrigo, Nucl. Phys. Proc. Suppl. A54
(1997) 60;
G. Rodrigo, A. Santamaria and M. Bilenkii, Phys. Rev. Lett. 79 (1997) 193. - [10] W. Bernreuther, A. Brandenburg and P. Uwer, Phys. Rev. Lett. 79 (1997) 189.
- [11] P. Nason and C. Oleari, Nucl. Phys. B521 (1998) 237.
- [12] DELPHI Collaboration: P. Abreu et al., Phys. Lett. B418 (1998) 430.
- [13] SLD Collaboration: K. Abe et al., Phys. Rev. D59 (1999) 12002.
-
[14]
OPAL Collaboration: K. Ahmet et al., Nucl.
Instr. and Meth. A305 (1991) 275;
P.P. Allport et al., Nucl. Inst. and Meth. A324 (1993) 34. - [15] P.P. Allport et al., Nucl. Inst. and Meth. A346 (1994) 476.
- [16] OPAL Collaboration: G. Alexander et al., Z. Phys. C52 (1991) 175.
- [17] OPAL Collaboration: P. D. Acton et al., Z. Phys. C59 (1993) 1.
- [18] T. Sjöstrand, Comp. Phys. Comm. 82 (1994) 74.
- [19] OPAL Collaboration: G. Alexander et al., Z. Phys. C69 (1996) 543.
- [20] C. Peterson et al., Phys. Rev. D27 (1983) 105.
- [21] J. Allison et al., Nucl. Instr. and Meth. A317 (1991) 47.
- [22] OPAL Collaboration, P. D. Acton et al., Z. Phys. C58 (1993) 523.
-
[23]
OPAL Collaboration, G. Abbiendi et al.,
A Measurement of using a Double Tagging Method,
CERN-EP/98-137 (1998).
To be published in Eur. Phys. J. C -
[24]
OPAL Collaboration: R. Akers et al.,
Z. Phys. C 67 (1995) 27;
OPAL Collaboration: R. Akers et al., Phys. Lett. B353 (1995) 595. - [25] M.H. Seymour, Nucl. Phys. B436 (1995) 163.
- [26] Particle Data Group: C. Caso et al., Eur. Phys. J. C3, (1998).
- [27] OPAL Collaboration: K. Ackerstaff et al., Eur. Phys. J. C1 (1998) 439.
- [28] OPAL Collaboration: P. D. Acton et al., Z. Phys. C55 (1992) 1.
- [29] B. Andersson, G. Gustafson, G. Ingelman and T. Sjöstrand, Phys. Rep. 97 (1983) 31.
- [30] R.K. Ellis, D.A. Ross and A.E. Terrano, Nucl. Phys. B178 (1981) 421.
- [31] C. Oleari, PhD Thesis, Università degli Studi di Milano, IFUM-607-FT (1997), and hep-ph/9802431.
- [32] QCD, Z. Kunszt and P. Nason [conv.], Z Physics at LEP 1, G. Altarelli, R. Kleiss and C. Verzegnassi, editors, volume 1, CERN 89-08.
- [33] L. Lönnbald, Comp. Phys. Comm. 71 (1992) 15.
- [34] G. Rodrigo, PhD Thesis, Universitat de València, 1996, hep-ph/9703359 and ISBN:84-370-2989-9.
Tables
| uds fraction | charm fraction | bottom fraction | |
|---|---|---|---|
| uds-tag | |||
| c-tag | |||
| b-tag |
| cut | 3 prong | semileptonic | satellite | 5 prong |
|---|---|---|---|---|
| – | – | – | – | |
| [GeV] | – | – | – | – |
| [GeV] | – | – | – | – |
| Event shape | Fit Range | /d.o.f. | |||
|---|---|---|---|---|---|
| 0.015 – 0.185 | 1.4 | ||||
| 0.11 – 0.29 | 2.2 | ||||
| 0.26 – 0.42 | 2.5 | ||||
| 0.09 – 0.21 | 4.4 | ||||
| 0.35 – 0.67 | 1.6 |
| Event shape | /d.o.f. | ||||
|---|---|---|---|---|---|
| 1.0 | |||||
| 0.5 | |||||
| 1.2 | |||||
| 1.8 | |||||
| 1.1 |
| Event shape | Mean | |||||
|---|---|---|---|---|---|---|
| 1.013 | 0.965 | 0.997 | 1.001 | 0.979 | 0.997 | |
| Statistical error | ||||||
| Flavour composition | ||||||
| Clusters only | ||||||
| Tracks only | ||||||
| cos | ||||||
| Fit range | ||||||
| range | ||||||
| Experimental syst. | ||||||
| Lund frag. b | ||||||
| Peterson frag. | ||||||
| Peterson frag. | ||||||
| Scale uncertainty | ||||||
| ARIADNE | ||||||
| c quark mass | ||||||
| b quark mass | ||||||
| Theoretical error | ||||||
| Total error |
| Event shape | Mean | |||||
|---|---|---|---|---|---|---|
| 0.997 | 0.986 | 1.000 | 0.999 | 0.983 | 0.993 | |
| Statistical error | ||||||
| Flavour composition | ||||||
| Clusters only | ||||||
| Tracks only | ||||||
| cos | ||||||
| Fit range | ||||||
| range | ||||||
| Experimental syst. | ||||||
| Lund frag. b | ||||||
| Peterson frag. | ||||||
| Peterson frag. | ||||||
| Scale uncertainty | ||||||
| ARIADNE | ||||||
| c quark mass | ||||||
| b quark mass | ||||||
| Theoretical error | ||||||
| Total error |
Figures