UCI Preprint # 98–37
A Neutrino-induced deuteron disintegration
experiment
S.P. Riley[*], Z.D. Greenwood[], W.R. Kropp, L.R. Price,
F. Reines,
H.W. Sobel
UC Irvine, Irvine, CA 92697
Y. Declais
LAPP, 74941 Annecy-le-Vieux, France
A. Etenko, M. Skorokhvatov
Kurchatov Institute, Moscow
(December 16, 1998)
Abstract
Cross sections for the disintegration of the deuteron via neutral-current (NCD) and charged-current (CCD) interactions with reactor antineutrinos ( and ) are measured to be cm2 and cm2 per neutrino, respectively, in excellent agreement with current calculations. Since the experimental NCD value depends upon the CCD value, if we use the theoretical value for the CCD reaction, we obtain the improved value of for the NCD cross section.
The neutral-current reaction allows a unique measurement of the isovector-axial vector coupling constant in the hadronic weak interaction, . In the standard model, this constant is predicted to be exactly 1, independent of the Weinberg angle. We measure a value of = 1.010.16. Using the above improved value for the NCD cross section, becomes .
1 Introduction
We describe an experiment to measure the cross sections for the disintegration of deuterons by neutral- and charged-current interactions with low energy electron-antineutrinos. Data were taken at the Centrale Nucleaire de Bugey in France, at 18 m from the core of Reactor 5.
Improvements were made to the cosmic-ray shielding of the detector which we previously used in a similar experiment at the Savannah River Plant in South Carolina in the late 1970s [1, 2]. An outer layer of active cosmic ray veto detectors was added which completely surrounds the lead and steel gamma ray shield. These improvements reduced the neutron background due to cosmic rays by a factor of six to day-1.
There are two reactions of interest in this experiment — the Neutral Current disintegration of the Deuteron (NCD),
and the Charged Current disintegration of the Deuteron (CCD),
The experiment was designed to probe these reactions at low energies (1 MeV). In particular, it measures the square of the isovector-axial vector coupling constant (). The neutrino-induced disintegration of the deuteron is an ideal reaction for this purpose since, at reactor neutrino energies, all other coupling constants make negligible contributions to the cross section. Other coupling constants depend on the value of the Weinberg mixing angle, , which is an unspecified parameter of the theory, while is predicted to be -1.0, independent of . In addition, it does not suffer from ambiguities arising from the presence of vector interactions, nor from momentum-transfer-dependent form factors, to which high-energy experiments are subject. The deuteron disintegration experiment is unique, then, in being able to measure the contribution of a single coupling constant with an unambiguous theoretical value.
2 The Detector
2.1 Location
The detector was installed at Reactor 5 of the Centrale Nucleaire de Bugey, near Lyon, France. It is located in a room about 10 m below ground level with an overburden of 25 mwe. The distance from the center of the reactor core to the center of the detector was 18.5 meters.
2.2 The Target
Schematics of the detector and shielding are shown in Figures 1, 2, and 3. The target detector, labeled D2O in Figures 1 and 2 and shown in more detail in Figure 3, consists of a cylindrical stainless steel tank, 54 cm in diameter, 122 cm in height, and a wall thickness of 0.18 cm, containing 267 kg of 99.85% pure D2O and ten tubular proportional chambers, equally spaced in two concentric rings of 10.16 cm and 20.37 cm radius and offset from each other by . Running down the center of the target tank is a stainless steel tube that allows the placement of radioactive sources inside the tank for calibration purposes.


Immediately surrounding the target tank is 10 cm of lead shielding and a 1 mm layer of cadmium to absorb thermal neutrons. These are contained in an outer steel tank that sits on a small pedestal inside the large, inner veto detector tank (Tank 2 of Figures 1 and 2).
The proportional counters are 5.08 cm in diameter, 122 cm in height, have a wall thickness of 0.025 cm, and are filled with 1 atm of 3He and 1.7 atm of Ar as a buffer. They are essentially black to thermal neutrons, with a capture cross section of 5300 barns per 3He nucleus. The neutron capture in the counters proceeds via the (n,p) reaction:
The energy resolution of the counters was measured to be 3% at the 764 KeV neutron capture peak. A typical neutron spectrum obtained with a 252Cf neutron source is shown in Fig. 4. A discussion of the neutron detection efficiency is given in Section 3.3. A more detailed description of the construction and testing of the 3He proportional tubes can be found in Reference [3].

2.3 Detection Technique
The neutral-current and charged-current events in the D2O target are recognized solely by the neutrons they produce: the neutral-current reaction releases a single neutron and the charged-current releases two. Consequently, the quantities of interest are the rates of single and double neutron captures.
2.4 The Shielding and Anticoincidence System
Due to the detector’s close proximity to the reactor core, there can be a significant reactor associated gamma flux. Gamma rays of 2.2 MeV which reach the target detector can photodisintegrate the deuterons, leading to single neutron signals. In the previous version of the experiment, this background was reduced by surrounding the inner layer of active cosmic-ray veto detectors with a layer of lead and water shielding. Unfortunately, cosmic rays interacting in the surrounding lead shield, but not reaching the inner veto counters, were a significant source of neutrons in the target detector.
It was concluded that the shielding could be improved by an additional layer of active cosmic ray veto detectors outside the lead shielding. In this way, cosmic rays interacting in the lead would be seen by the outer veto detectors. Simulations showed that this would reduce the cosmic ray neutron background by a factor of three to four.
In the current configuration, the target tank is in the center of a large liquid scintillator detector (the “inner” veto) composed of Tank 2 and Tank 4, shown in Figure 2. Immediately surrounding Tanks 2 and 4 is a layer of each lead and steel. Surrounding this layer of passive shielding is an outer layer of cosmic ray veto detectors (the “outer” veto). Slabs of plastic scintillator cover the north and south sides and the bottom face, while larger tanks of mineral oil scintillator (Tanks 1, 3, & 5) cover the east, west, and top faces. The liquid scintillator used in all five tanks is mineral oil based with a high flash point. Five-inch hemispherical photomultiplier tubes (PMTs) are used to view the liquid scintillator tanks and three inch tubes are employed on the plastic slabs.
As noted above, the inner veto system consists of two liquid scintillator tanks, Tank 2 and Tank 4. As indicated in Figures 1 and 2, there is a string of fifteen evenly spaced PMTs along each vertical corner of Tank 2 . Alternating tubes are offset in direction by . Along the east and west walls on the floor of the tank is a row of PMTs which view the space underneath the target tank. Tank 4 has three PMTs in each vertical corner that are configured like those of Tank 2.
There are eight signal lines coming from the inner veto system. The PMTs in each vertical string are ganged onto a single line, as are each row along the floor. The signals from the east corners of Tank 4 are fanned together as are the signals from the west corners.
The inner veto detector is primarily a “soft” veto — its signals are recorded at each trigger and analyzed off line. However, it also triggers an on-line veto in the event that all four corner strings see a large pulse simultaneously. Such a signal is likely to be produced by a throughgoing muon.
Figure 5 shows some details of our electronics configuration.
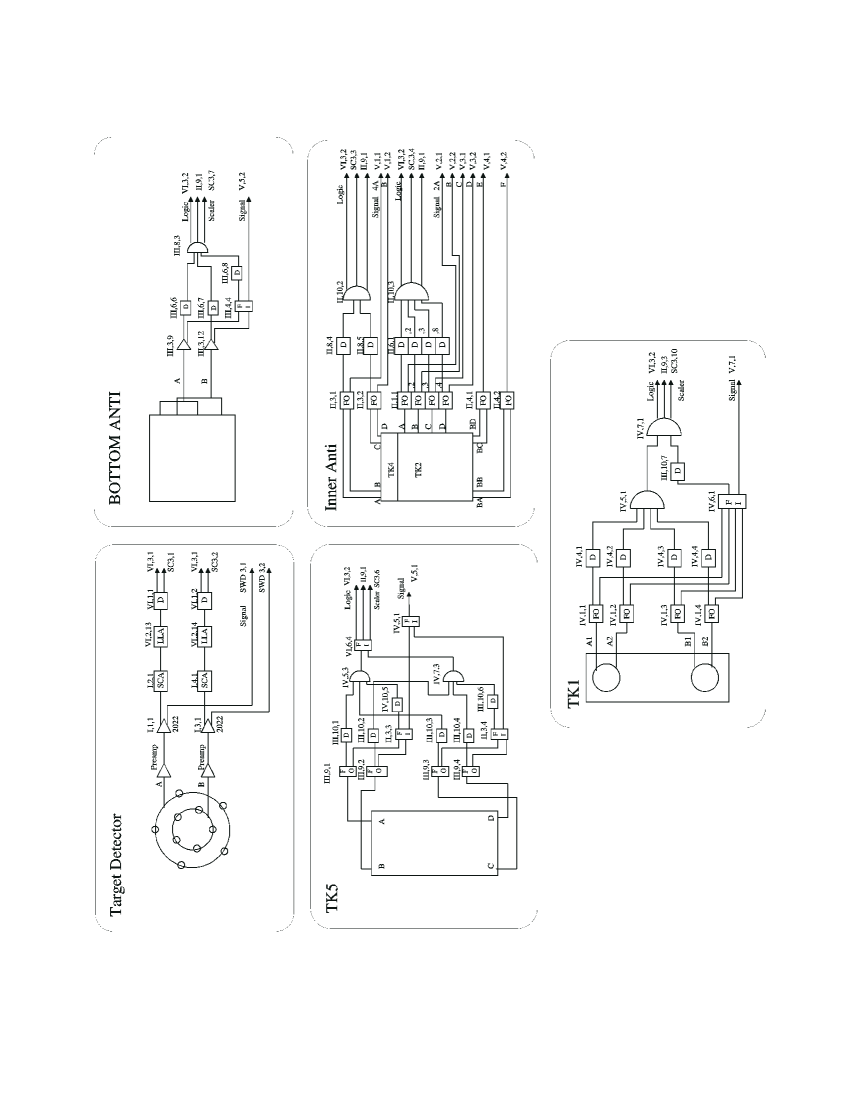
![[Uncaptioned image]](/html/hep-ex/9904001/assets/x6.png)
Figure 5 continued.
2.5 Data collection system
The data-collection program, based on a 80486DX processor and the software package LabVIEW, has a fast, graphical interface to the electronics. The software takes advantage of the multitasking capabilities of the operating system, allowing the transfer and processing of data without interrupting data collection.
A trigger is generated under the following conditions:
-
1.
A neutron-like pulse is detected in one of the 3He proportional counters.
-
2.
No pulses above hardware thresholds were detected in any of the inner or outer veto detectors in the preceeding s. This value was chosen to reduce background from muon-induced neutrons arising in the inner-anti scintillator which had a neutron capture time of about 200s.
When a trigger occurs, the contents of waveform digitizers and scalers are read by the computer and written to disk. The contents of the digitizers give a pulse history of all detectors for a period of 4 milliseconds before and after the event.
More details on the detector and data-collection system can be found in Reference [4].
3 Data Analysis
3.1 Selection criteria
After the data are collected, they are further reduced by offline selection according to the following criteria.
3.1.1 Target cuts
The purpose of the target cuts is to remove any events that do not appear to be valid neutron captures.
- No neutron in pulse-height window.
-
An event is removed if there is no target pulse in the pulse-height acceptance window within 5sec of the trigger time. The pulse-height acceptance values were determined from the neutron calibrations and varied slightly from run to run. The total number of target peaks in the pulse-height window during the 782sec (three times the neutron capture time in the target) following the trigger is taken to be the number of neutrons in the event. This time interval was selected to maximize the signal to background. Shorter time windows yield consistent results with larger statistical errors.
- Remove “early” neutrons.
-
Remove event if it has a pulse in the neutron pulse-height acceptance window before the trigger time.
3.1.2 Outer-anti cut
This cut removes cosmic-ray muons that might create neutrons that would subsequently be detected by the target.
- Remove muons.
-
If during the 1800 sec preceeding the trigger a signal is detected in any outer anti which exceeds the threshold for that counter, the event is removed.
The pulse-height threshold values were determined run by run. The values were chosen at the lowest value for which the events removed by this criterion were at least twice the number of the “background” peaks at the same pulse height.
3.1.3 Inner-anti cuts
The inner-antis provide additional protection against cosmic-ray muons that sneak through the outer anti. However, this large volume of liquid scintillator also provides a large target for inverse-beta events on hydrogen (). A small fraction () of the neutrons thus produced diffuse into the target area and are recorded by the 3He tubes. To reduce this number, a low-energy cut is applied to the inner antis, thus using the light produced by the positron to veto the event.
- Low-energy cut.
-
The main purpose of this cut is to remove the inverse-beta events. Any event with 0.8 MeV in either Tank 2 or Tank 4 within 900sec before to 200sec after the trigger was removed. This energy-threshold value was chosen in order to remove the maximum number of inverse-beta events, while not suffering too much dead time from the many low-energy background pulses. From the Monte Carlo, the mean time between production of a neutron by the inverse-beta process in Tanks 2 or 4 and its subsequent capture by a 3He tube was about 230sec. Thus the period in which this cut is active is from about four such mean times before to one after the trigger.
- High-energy cut.
-
Events having a pulse of total energy exceeding 8 MeV in Tank 2 or 6 MeV in Tank 4 from 2400 to 900sec before the trigger are removed. This cut removes cosmic-ray events that are recorded before the beginning of the hardware anti block. Extending the times earlier than 2400sec has little effect.
The fraction of events removed by each of the above cuts is shown in Table 1. Figure 6 shows the effects of the cuts on the data. As a result of the cuts, the number of candidate neutrino events is reduced from roughly 60,000 per day to about 25 per day, with the reactor off.

| Reactor ON | Reactor OFF | |||
|---|---|---|---|---|
| Cut | Random | Normal | Random | Normal |
| Triggers | Triggers | Triggers | Triggers | |
| Early neutron | 0.5% | 27.9% | 0.5% | 28.7% |
| No neutron in window | 0% | 17.2% | 0% | 17.5% |
| Outer-anti cut | 26.0% | 38.9% | 26.4% | 38.7% |
| Inner-anti (high-energy) | 9.2% | 8.5% | 9.5% | 9.3% |
| Inner-anti (low-energy) | 17.2% | 6.5% | 19.2% | 5.1% |
3.2 Monte Carlo calculations
geant with the gcalor interface was used for all Monte Carlo simulations. The gcalor interface handles neutron transport from 20 MeV down to thermal energies. geant handles the transport of all other particles. One comparison of the data and the Monte Carlo is given in Figs. 7 and 8. The former shows the capture-time spectrum of neutrons detected by the 3He counters from a simulated 252Cf source at the center of the target detector. The mean capture time is secs. Fig. 8 is for the same configuration, but for real data. The mean capture time is secs.


3.3 Neutron Detection Efficiency
Special neutron-calibration runs were periodically made with a 252Cf source in the center of the target detector. Data from these runs were processed thru the same programs used to analyze the neutrino events. In particular, the same target cuts (as described above) were used.
The resulting pulse-height spectra from the 3He tubes were histogrammed for each calibration run, and the peaks fitted to Gaussians. Only those pulses within 2 standard deviations of the peak value are finally accepted as neutrons. The numbers of events with 1, 2, 3, 4, and 5 neutrons within a given time window were tallied. The time window chosen was 3 neutron capture times.
Based on the known neutron multiplicity from 252Cf fissions, one can calculate the neutron detection efficiency by assuming various efficiencies and comparing the observed number distribution with the calculated distribution. Our procedure took into account:
-
•
The neutron-number distribution from 252Cf fission.
-
•
The neutron acceptance time window of 3 capture times.
-
•
The probability of an “extra” fission from the Cf source during the acceptance time window, which is a function of the source activity.
This procedure yielded a mean efficiency of 0.410.01 for a neutron source at the center of the target. This value agreed well with the value derived from the Monte Carlo. As a result we were able to use the Monte Carlo value of 0.290.01 as the mean efficiency for single neutrons generated isotropically throughout the D2O of the target volume.
The efficiency for two neutrons is the square of the single-neutron efficiency (0.0840.006). And the efficiency for seeing only 1 neutron, if 2 were produced is .
3.4 Energy calibration of inner antis
Since we desired to base the inner anti cut criteria on energy, both Tanks 2 and 4 must be energy calibrated. Periodic runs were made over the course of the experiment with a 60Co source placed at various known positions in Tank 2, and beneath the center of Tank 4. (Tank 4 was also calibrated with a 252Cf source in that same position.) The data were compared with Monte Carlo simulations. Several algorithms were tested to find the best estimates of the energy. The best measures found were: Tank 4, sum the signals from the two PMT strings; Tank 2, sum the signals from the 4 vertical corner strings. Results are shown in Table 2.
| Tank 2 | Tank 4 | |
|---|---|---|
| Uncertainty in peak position | 15% | 10% |
| Standard deviation | 0.25E | 0.25E |
| Max. deviation of peak over entire run | 20% | 10% |
4 Results
4.1 Event rates
The 1- and 2-neutron event rates for both the reactor up and down data are given in Table 3. Subtracting the reactor down rates from the up rates yields the data shown in Table 4, where we have also given the corresponding neutron detection efficiencies.
| Reactor Up | Reactor Down | |
|---|---|---|
| Raw 1-neutron rate (events/day) | 44.620.59 | 25.280.68 |
| Raw 2-neutron rate (events/day) | 2.690.14 | 1.450.16 |
| Software efficiency | 0.4710.003 | 0.4440.005 |
| Corrected 1-neutron rate | 94.661.24 | 57.001.53 |
| Corrected 2-neutron rate | 5.710.31 | 3.260.36 |
| 1 neutron | 2 neutron | |
|---|---|---|
| Up minus down rate | 37.72.0 | 2.450.48 |
| Neutron efficiency | 0.290.01 | 0.0840.006 |
The 2-neutron rate (per day) is . To get the CCD rate from this value we need only correct for the effect of a nearby reactor, Reactor #4. It is located about 80 m from our detector. While taking data with Reactor #5 up, the mean power of reactor #4 was 1925 MW; while #5 was down, it was 2246 MW. This gives a correction factor of +0.6% to our final rates. Thus the CCD daily rate is
To get the NCD rate from the 1-neutron rate, two corrections must first be applied to the 1-neutron rate.
-
•
The number of CCD reactions in which only 1, instead of 2, neutrons was observed must be subtracted. This number is the CCD rate times the efficiency of seeing only one out of the two neutrons:
-
•
The number of inverse-beta decays in the inner detector that leak into the target volume and create a single neutron must also be subtracted. From the Monte Carlo we estimate 22.00.5 inverse-beta events per day enter the target volume. Also from the Monte Carlo we estimate that only 51% of those events survive the 0.8 MeV inner-anti cut. Thus the number of events to be subtracted from the 1-neutron rate is:
The corrected 1-neutron event rate is then
Applying the single-neutron detection efficiency correction and the Reactor #4 correction from above, yields the daily NCD rate:
4.2 Systematic uncertainties
The significant systematic uncertainties are given in Table 5. Other possible sources of systematic effects which were considered, but found to be insignificant were: the calculated neutrino energy spectrum and the energy-calibration effects on data cuts.
| Parameter | Value | % |
|---|---|---|
| Detector-reactor distance | 18.50.1 m | 1.1 |
| Mass of D2O | 267.02.0 kg | 0.8 |
| No. MeV per fission | 205.00.7 | 0.3 |
| Total systematic uncertainty | 1.4 | |
4.3 Theoretically-expected event rates
The rates (events per day) are given by:
| (1) |
where is the neutrino energy, the daily average neutrino energy spectrum per MeV, the total number of deuterons in the target, the cross section for the process, and is the distance from the reactor to the detector.
The mean neutrino energy spectrum was determined from the reactor power and the core “burn up,” i.e. the isotopic composition of the fuel, as a function of time. The reactor power was obtained from reactor monitoring devices several times per day. The isotopic composition of the fuel rods was given to us at the beginning and ending of each reactor cycle of about 11 months.
The only four nuclei of importance are: 235U[5], 238U[6], 239Pu[7], and 241Pu[7]. Combining the data in those references with the reactor power as a function of time, both the neutrino energy spectrum and the conversion factor from MW-hours to total number of neutrinos was calculated for each day.
The energy per fission and the mean number of fissions per day are given in Table 6 for each isotope.
| Isotope | MeV/fission | Nfiss |
|---|---|---|
| 235U | 201.70.6 | 4.17 |
| 238U | 205.00.9 | 5.61 |
| 239Pu | 210.00.9 | 2.10 |
| 241Pu | 212.41.0 | 3.46 |
The data-collection MW-hours was calculated for every day by combining the data collection times with the reactor power level at that time. The number of deuterons was 1.605.
Combining all these factors and dividing by the number of live days yields the mean neutrino spectrum (neutrinos/MeV/day) as shown in Table 7.
| Energy | Nν | Energy | Nν |
|---|---|---|---|
| 2.0 | 3.56 | 6.0 | 8.98 |
| 2.25 | 2.99 | 6.25 | 6.49 |
| 2.5 | 2.47 | 6.5 | 4.84 |
| 2.75 | 2.09 | 6.75 | 3.55 |
| 3.0 | 1.75 | 7.0 | 2.47 |
| 3.25 | 1.45 | 7.25 | 1.58 |
| 3.5 | 1.18 | 7.5 | 1.01 |
| 3.75 | 9.47 | 7.75 | 6.13 |
| 4.0 | 7.54 | 8.0 | 3.27 |
| 4.25 | 5.93 | 8.25 | 1.35 |
| 4.5 | 4.52 | 8.5 | 8.11 |
| 4.75 | 3.44 | 8.75 | 4.89 |
| 5.0 | 2.68 | 9.0 | 2.77 |
| 5.25 | 2.07 | 9.25 | 1.65 |
| 5.5 | 1.57 | 9.5 | 1.17 |
| 5.75 | 1.21 |
There has been considerable work done on the CCD and NCD cross sections in the past few years. Kubodera and Nozawa review the field in Ref. [8]. In their Table 1, they give the cross sections for both the CCD and NCD reactions from threshold to 170 MeV. They state that the uncertainties in the values are 5%. Using the data of Ref. [8] with Eqn. 1, yields and .
4.4 Experimental cross sections
The average cross section per neutrino is given by
where the integrals go from the threshold for the reaction to infinity. Combining this with Eqn. 1, we get
The values obtained for the NCD and CCD cross sections are given in Table 8.
| NCD | CCD | |
|---|---|---|
| Rate (events per day) | 88.1 11.1 1.2 | 29.4 6.1 0.4 |
| Reaction threshold (MeV) | 2.23 | 4.03 |
| Neutrinos (per day) | 3.86 | 8.01 |
| Average cross section (10-45 cm2 per ) | 6.08 0.77 | 9.83 2.04 |
.
4.5 Improved NCD cross section
As stated above, the CCD events create a significant background for the NCD events, and this background must be subtracted. The large uncertainty in our measured CCD rate makes a significant contribution to the uncertainty in the NCD rate. However, we note that our experimentally determined rates and the theoretically-expected rates agree within one standard deviation of each the experimental and theoretical uncertainties. Given this excellent agreement, we feel that an improved value for the NCD cross section may be calculated by using the theoretically-expected CCD daily rate (30.4 1.52) rather than our observed rate (29.4 6.1). Repeating the procedure described above, this yields an improved NCD rate of 86.7 7.9, and a corresponding cross section of cm2 per neutrino.
4.6 Calculation of
The value of is given by the ratio of the measured neutral current rate to the theoretically expected rate. Thus we find
Using the improved NCD cross section determined above, we get an improved of 0.99 0.10.
4.7 Neutrino oscillations
Another aspect of this experiment is its ability to explore neutrino oscillation by measuring the ratio of the CCD to NCD rates. At reactor neutrino energies, there is insufficient energy to create leptons more massive than the electron. Therefore, if neutrino oscillation occurs at a significant level, a deficit of charged-current events compared to neutral-current events should be seen. This leads us to define the ratio , where
| (2) |
a ratio of ratios of experimentally determined reaction rates to theoretically expected reaction rates. A deficit of charged current reactions could imply that some electron antineutrinos have oscillated to a different flavor or helicity state, either of which would imply new physics.
We find
The error of 1% in the theoretical ratio is taken from reference [8]. The neutrino-oscillation exclusion plot resulting from this value of R is shown in Fig. 9.

4.8 Possible extension of this technique
Since the theoretical error in the ratio is quite small, a high statistics, good precision measurement of R should be possible. This measurement has the potential of reaching small values of .
In the current experiment, the CCD measurement is handicapped by the requirement that we observe two neutrons. The efficiency for observing this goes as the square of the single-neutron detection efficiency and so is necessarily small. Another method, which we explored but did not pursue, employs the addition of a small amount (approximately 10%) of light water into the heavy water target. This small addition does not effect the neutron detection efficiency appreciably and gives one the opportunity to observe the charged current reaction on the proton. Since the CCP reaction has a much larger cross-section than the CCD reaction, a threshold of 1.8 MeV, closer to the CCD threshold and since it can be detected by searching for a single neutron, one can determine the ratio of NCD to CCP with higher precision.
5 Discussion
This experiment was an improved version of our experiment done at Savannah River in the late 1970s. The primary improvements were in the cosmic-ray shielding, which cut that background by a factor of six, and an improved data-collection system.
During the past 20 years great progress has been made in calculating the CCD and NCD cross sections, and they agree well with the results of this experiment.
Acknowledgments
The authors would like to acknowledge the operators of the Bugey Nuclear Plant, and the contributions of our technicians, Thomasina Godbee, Herb Juds, Eric Juds, and Butch Juds. This work was supported by the U.S. Department of Energy.
References
- [*] Present Address: University of New Mexico, Albuquerque, NM 87131
- [] Present Address: Louisiana Tech University, Ruston, LA 71272
- [1] E.L. Pasierb, H.S. Gurr, J. Lathrop, F. Reines, and H.W. Sobel, Phys. Rev. Lett. 43, 96 (1979).
- [2] F. Reines, H.W. Sobel, and E.L. Pasierb, Phys. Rev. Lett. 45, 1307 (1980).
- [3] E.L. Pasierb, PhD thesis, University of California, Irvine (1979).
- [4] S.P. Riley, PhD thesis, University of California, Irvine (1992).
- [5] K. Schreckenbach, G. Colvin, W. Gelletly, and F. von Feilitzsch, Phys. Lett. B 160, 325 (1985).
- [6] H.V. Klapdor and J. Metzinger (private communication).
- [7] A.A. Hahn, K. Schreckenbach, W. Gelletly, F. von Feilitzsch, G. Colvin, and B.Krusche, Phys. Lett. B 218, 365 (1989).
- [8] K. Kubodera and S. Nozawa, Internat. J. Mod. Phys. E 3, 101 (March 1994).