Scalar and Tensor Couplings in Kaon Decays
Abstract
In the past few years charged kaon experiments have indicated possible scalar and tensor couplings in semileptonic kaon decays(). These couplings, if correct, are not predicted by the Standard Model and may indicate the onset of new physics. We present a summary of the existing data and a new, precision measurement of these couplings in the neutral kaon system based on a 3% subset of the data taken by the KTeV (E799) experiment at Fermilab.
I Introduction
From relativistic quantum mechanics one learns that the Lorentz structure of an interaction is determined by the vertex factors or couplings. The Lorentz structure manifests itself in the interaction dynamics or the square of the transition amplitude and is experimentally accessible. In semileptonic kaon decays involving electrons, (Ke3), the most general form of the decay rate, consistent with the Dirac equation and left handed, massless neutrinos is [1]:
| (1) |
where is the Cabibbo-Kobayashi-Maskawa matrix element [2] for the to quark transition, , and are terms which depend only on kinematics and , and are scalar, vector and tensor form factors, respectively. The form factors parameterize the hadronic transition and, in general, depend on the momentum transferred to the final state leptons (). Thus the form factors provide information not only on the soft QCD structure of the kaon, but the Lorentz structure of the decay. By analyzing the phase space density or Dalitz plot, one may extract these form factors and their dependence which empirically takes the form [3, 4]:
| (2) |
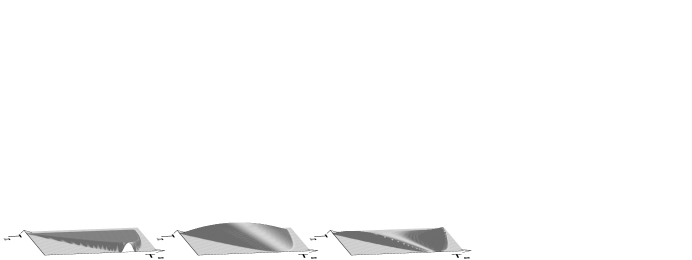
where is the pion mass. The traditional Dalitz plot variables are the kinetic energy of the pion () and electron () measured in the kaon rest frame. Figure 1 shows how the three different couplings effect the shape of the Dalitz plot.
Since these decays proceed through a virtual exchange in the Standard Model, one would expect purely vector couplings. However, previous experiments examining the form factors of charged Ke3 decays () indicate anomalous scalar and tensor couplings [5, 6, 7]. The Particle Data Group’s combined results for the scalar and tensor form factors differ from the Standard Model prediction of zero with a significance of 3.6 and 3.4 standard deviations, respectively. Previous results from neutral Ke3 decays () yield only 68% confidence level upper limits on the scalar and tensor couplings [8] and are insufficient to decisively confirm or refute the charged Ke3 results.
In addition to the study of scalar and tensor couplings one may extract the dependence of the form factors. A precise measure of the dependence of these form factors would allow for a more precise determination of .
II KTeV
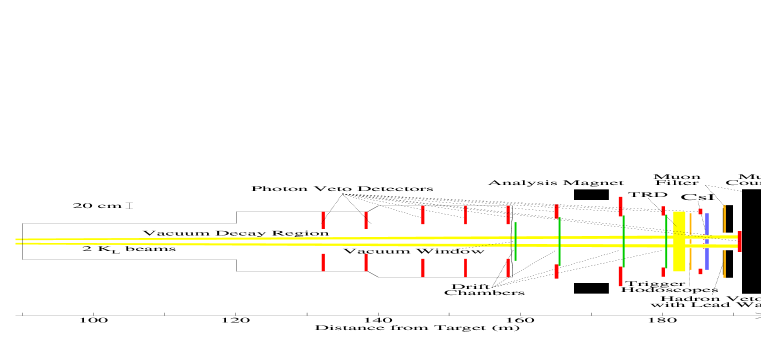
KTeV is a research program at Fermilab comprised of two experiments to study rare kaon decay processes (E799) and measure various CP violating parameters in the neutral kaon system (E832). Approximately 80 collaborators from 12 institutions in the US and Japan [9] assembled the KTeV apparatus and took part in data collection and analysis during the Fermilab 1996-1997 fixed target run. The KTeV apparatus in the E799 configuration is shown in Figure 2.
III Reconstruction and Analysis
The data presented here were taken by the KTeV experiment running in the E799 configuration (see figure 2) and consisted of approximately 7.6 million two track, minimum bias events representing approximately 3% of the entire E799 data sample. The trigger for these events required hits in the trigger hodoscopes and drift chambers consistent with two charged particle tracks.
Offline, a Ke3 sample was selected by requiring exactly 2 tracks in the fiducial regions of the detector. The tracks were further required to form a vertex in the beam region of the vacuum decay volume. Backgrounds from other decay processes were restricted by requiring little ( MeV) activity in the photon veto detectors and no in-time activity in the muon hodoscopes. Electrons were identified from hadrons by the ratio of the measured energy deposited in the electromagnetic calorimeter divided by the momentum measured in the spectrometer (). The analysis required one electron () and one hadron () assumed to be a pion. Additional quality cuts on the tracks and electromagnetic shower shape helped to suppress possible backgrounds. These requirements identified a Ke3 candidate sample of approximately 1.4 million events.
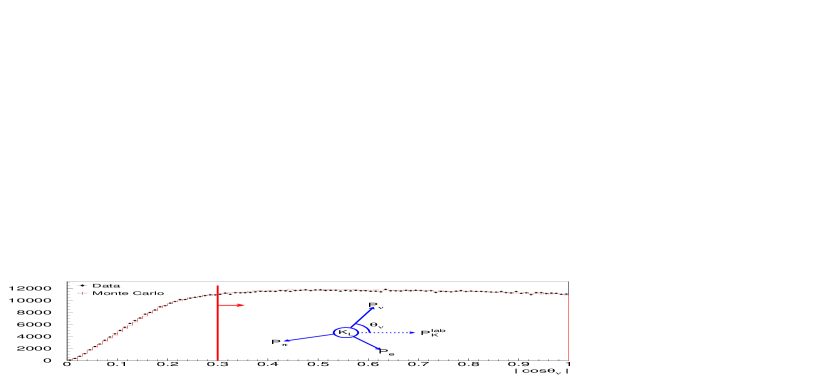
Because the Ke3 phase space variables are measured in the kaon rest frame a good value of the kaon momentum is required to get the relativistic boost correct. Combining the vertex and target locations with the measured particle momenta and assuming the decay products originate from a kaon allows one to solve for the parent (kaon) momentum up to a quadratic ambiguity. In the kaon rest frame, this ambiguity amounts to the lack of knowledge of the sign of the component of the neutrino momentum parallel to the kaon flight direction (). The angle between the neutrino momentum in the kaon rest frame and the kaon direction may be obtained from the equation:
| (3) |
where is the magnitude of the missing momentum assuming a kaon decay and is the transverse momentum of the charged tracks relative to the line defined by the target and decay vertex. Figure 3 compares the distribution of from data with a Monte Carlo simulation. The roll off near comes from solutions where and are the result of mismeasurements due to detector resolution, radiation and scattering of the parent kaon in collimators upstream of the decay volume. These events were reconstructed by assuming .
To calculate the Dalitz plot variables, the electron and pion momentum were boosted the two candidate kaon rest frames using the high and low energy solutions to the kaon momentum. These results were then averaged to determine a reconstructed electron and pion energy. By making the requirements on the decay kinematics discussed above, the RMS on the Dalitz plot variables was reduced from 14 MeV before the cut to 5 MeV. The final data sample is also reduced to approximately 280,000 events.
The dominant backgrounds to Ke3 decays generally arise from kaon decays involving charged pions one of which showers in the calorimeter and is subsequently missidentified as an electron. The major background sources are from ( events) and ( events). Backgrounds from hyperon decay were also considered and contribute events (). Monte Carlo statistics dominate the uncertainties in the background estimates. The total background was estimated at events from all processes and found to be approximately flat across the Dalitz plot.
Effects due to electromagnetic radiation have been shown to be large [10, 11] in some regions of the Dalitz plot and must be taken into account. Radiative effects of order may be broken down into two classes, a real photon in the final state and interference between the tree level diagram and diagrams involving one virtual photon. Detailed studies comparing pion-electron invariant mass() between data and Monte Carlo show good agreement when all effects are correctly modeled. An infrared cutoff of 1 KeV was used for the in the simulation of radiative effects. This cutoff was varied over six orders of magnitude and no significant change of the distribution was observed indicating cancellation of the different components to high degree.
The Ke3 data sample was then condensed into a Dalitz plot with binning. This Dalitz plot was corrected bin-by-bin for acceptance and radiative effects involving a real photon. Radiative effects involving a virtual photon were included in subsequent fits to the Dalitz plot shape. The parameters in the fit were the linear coefficient of the vector form factor dependence, , and the ratio of form factors, and .
IV Fitting the Data
In order to avoid personal biases in the analysis, unknown random offsets were added to the parameters in the fitting program. This allowed for the detailed study of various detector and reconstruction effects without knowledge of the true result. The analysis strategy thus allowed improvements in the detector simulation and reconstruction. An a priori requirement that the chisquared confidence level had to be 10% or better and detailed comparisons between data and Monte Carlo simulations of various distributions had to agree. In addition systematic uncertainties were evaluated and reduced until they were of comparable size or smaller than the statistical uncertainty of the fit parameters.
After all analysis, the fit returned for 649 degrees of freedom (78% CL). Table I summarizes the dominant systematic uncertainties for each of the fit parameters and compares them with the statistical uncertainty returned from the fit.
| Effect | ( units) | ( units) | ( units) |
|---|---|---|---|
| Chamber Effic. | 1.4 | 2.8 | 3.2 |
| Acceptance | 9.2 | 0.70 | 2.0 |
| Resolution & Radiation | 0.85 | 0.7 | |
| spectrum | 6.0 | 0.75 | 0.5 |
| scale | 3.7 | 1.2 | |
| BR() | 3.3 | ||
| Total systematic uncertainty | 12. | 3.1 | 4.2 |
| Statistical uncertainty | 8.2 |
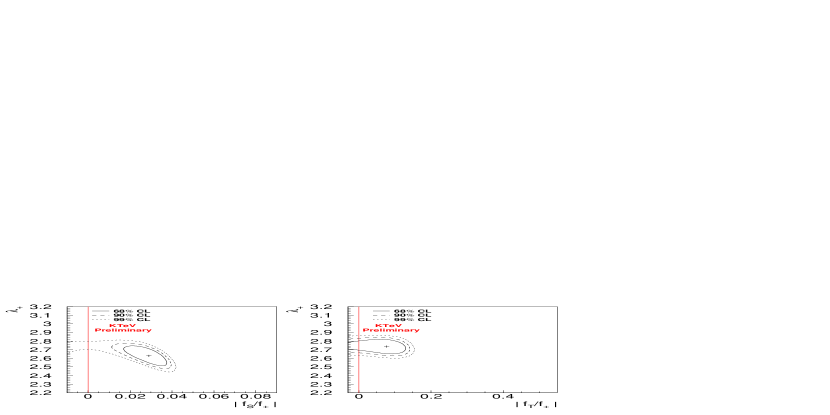
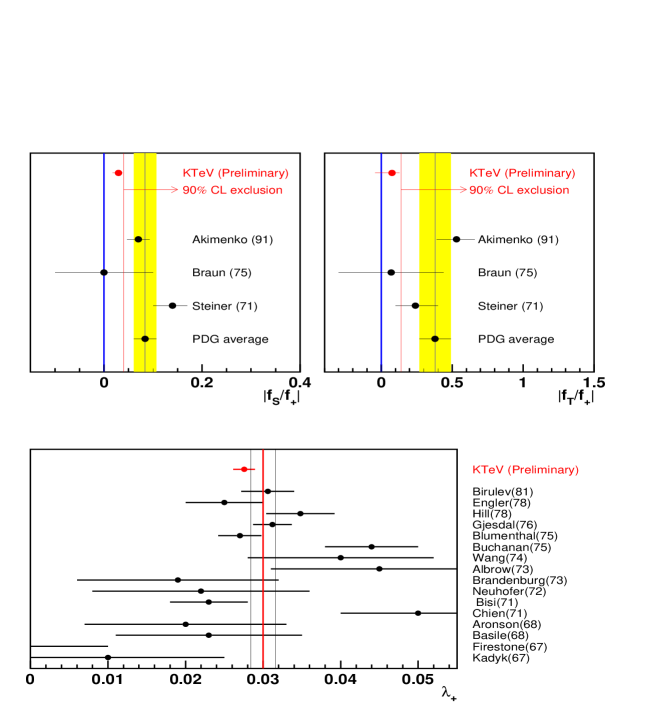
The Dalitz plot was then re-fit with the random offsets removed. Fits were performed assuming a vector, vector+scalar and vector+tensor hypothesis separately with the results summarized in Table II. Figure 4 shows chisquared contours for the vector+scalar and vector+tensor fit hypotheses. From these data one may set a preliminary 90% confidence level upper limit on the tensor form factor of . Because the scalar form factor differs from zero by little more than we quote both a positive value of and a 90% CL upper limit of . Finally, the linear coefficient of the dependence form the vector form factor yields the value: . These results are summarized and compared with previous experimental results [12] in Figure 5.
| Fit Hypothesis | D.O.F | |||
|---|---|---|---|---|
| Vector | – | – | 625/651 | |
| Vector + Scalar | – | 622/650 | ||
| Vector + Tensor | – | 624/650 |
V Summary and Conclusions
Based on a 3% sample of data taken with the KTeV detector as part of the E799 experiment, we set preliminary 90% upper limits on possible scalar and tensor couplings in decays of (90% CL) and (90% CL). These results represent significant improvements over previously published results and are inconsistent with the results obtained in decays. In addition to the coupling results we obtain a preliminary measurement of the linear coefficient in the vector form factor dependence: .
REFERENCES
- [1] M.V. Chizhov, eprint hep-ph/9511287.
-
[2]
N. Cabibbo, Phys. Rev. Lett. 10, 531 (1963).
M. Kobayashi, T. Maskawa, Prog. Theor. Phys. 49, 652 (1973). - [3] L.M. Chounet, J.M. Gaillard, M.K. Gaillard, Phys. Reports, 4C, 199 (1972).
- [4] C. Caso, et al., Eur. Phys. Jour. C3, 452 (1998).
- [5] Akimenko, et al., Phys. Lett. B259, 255 (1991).
- [6] Braun, et al., Nucl. Phys. B89, 210 (1975).
- [7] Steiner,et al., Phys. Lett. B36, 521 (1971).
- [8] Blumenthal, et al., Phys. Rev. Lett. 34, 164 (1975).
- [9] KTeV Collaboration: Arizona, UCLA, UCSD, Chicago, Colorado, Elmhurst, Fermilab, Osaka, Rice, Rutgers, Virginia, Wisconsin
- [10] E. S. Ginsberg, Phys. Rev. 171, 1675 (1968); Phys. Rev. 175, 2169 (1968).
- [11] H.W. Fearing, E. Fischbach, J. Smith, Phys. Rev. D2 542 (1970).
- [12] C. Caso, et al., Eur. Phys. Jour. C3, 463 (1998).