Measurement of the Spectroscopy of Orbitally Excited B Mesons
with the L3 detector
Abstract
We measure the mass, decay width and production rate of orbitally excited B mesons in million hadronic Z decays registered by the L3 detector in 1994 and 1995. B meson candidates are inclusively reconstructed and combined with charged pions produced at the event primary vertex. An excess of events above the expected background is observed in the mass spectrum near . These events are interpreted as resulting from the decay , where denotes a mixture of B meson spin states. The masses and decay widths of the () and () resonances and the relative production rate for the combination of all spin states are extracted from a fit to the mass spectrum.
I Introduction
Detailed understanding of the resonant structure of orbitally excited B mesons provides important information regarding the underlying theory. A symmetry (Heavy Quark Symmetry) arises from the fact that the mass of the quark is large relative to . In this approximation, the spin of the heavy quark () is conserved independently of the total angular momentum () of the light quark. Excitation energy levels are thus degenerate doublets in total spin and can be expressed in terms of the spin-parity of the meson and the total spin of the light quark . Corrections to this symmetry are a series expansion in powers of [6], calculable in Heavy Quark Effective Theory (HQET).
The mesons, for which , have two possible spin states: a pseudo-scalar () and a vector (). If the spin of the heavy quark is conserved independently, the relative production rate of these states is .†††Corrections due to the decay of higher excited states are predicted to be small. Recent measurements of this rate for the system [8, 9, 10, 11] agree well with this ratio.
In the case of orbitally excited mesons, two sets of degenerate doublets are expected: one corresponding to and the other to . Their relative production rates follow from spin state counting ( states). Rules for the decay of these states to the states are determined by spin-parity conservation [6, 3]. For the dominant two-body decays, the states can decay via an transition (S-wave) and their decay widths are expected to be broad in comparison to those of the states which must decay via an transition (D-wave). Table I presents the nomenclature of the various spin states for mesons containing either a or quark, with the predicted production rates and two-body decay modes.
Several models, based on HQET and on the charmed meson data, have made predictions for the masses and widths of orbitally excited mesons. Some of these models [2, 4, 5] place the average mass of the states above that of the states, while others [6, 7] predict the opposite (“spin-orbit inversion”).
| Name | Production | Decay mode | Transition | ||
|---|---|---|---|---|---|
| 1/12 | S-wave | ||||
| 3/12 | S-wave | ||||
| 3/12 | D-wave | ||||
| 5/12 | D-wave |
Recent analyses at LEP combining a charged pion produced at the primary event vertex with an inclusively reconstructed meson [11, 12, 13] have measured an average mass of , where indicates a mixture of all spin states. An analysis [14] combining a primary charged pion with a fully reconstructed meson, measures by performing a fit to the mass spectrum which fixes the mass differences, widths and relative rates of all spin states according to the predictions of Eichten, et al..[4].
The analysis presented here [1] is based on the combination of primary charged pions with inclusively reconstructed mesons. Several new analysis techniques make it possible to improve on the resolution of the mass spectrum and to unfold this resolution from the signal components. As a result, measurements are obtained for masses and widths of D-wave decays and of S-wave decays.
II Event Selection
A Selection of decays
The analysis is performed on data collected by the L3 detector [15] in 1994 and 1995, corresponding to an integrated luminosity of with LEP operating at the Z mass. Hadronic Z decays are selected[16] which have an event thrust direction satisfying , where is the polar angle. The events are also required to contain an event primary vertex reconstructed in three dimensions, at least two calorimetric jets, each with energy greater than , and to pass stringent detector quality criteria for the vertexing, tracking and calorimetry. A total of events are selected. A cut on a event discriminant based on track DCA significances [17] yields a -enriched sample of events.
B Selection of decays
Secondary decay vertices and primary event vertices are reconstructed in three dimensions by an iterative procedure such that a track can be a constituent of no more than one of the vertices. A calorimetric jet is selected as a candidate if it is one of the two most energetic jets in the event, if a secondary decay vertex has been reconstructed from tracks associated with that jet, and if the decay length of that vertex with respect to the event primary vertex is greater than , where is the estimated error of the measurement.
The decay of a to a meson and a pion is carried out via a strong interaction and thus occurs at the primary event vertex. In addition, the predicted masses for the states correspond to relatively small values, so that the decay pion () direction is forward with respect to the meson direction. We take advantage of these decay kinematics by requiring that, for each meson candidate, there is at least one track which is a constituent of the event primary vertex and which is located within 90 degrees of the jet axis. A total of track-jet pairs satisfy these criteria.
To decrease background, typically due to charged fragmentation particles, only the track with the largest component of momentum in the direction of the jet is selected. This choice has been found [20, 14] to improve the purity of the signal. The track is further required to have a transverse momentum with respect to the jet axis larger than , to reduce background due to charged pions from decays. These selection criteria are satisfied by pairs with a hadron purity of .
1 B meson direction reconstruction
The direction of the candidate is estimated by taking a weighted average in the (polar) and (azimuthal) coordinates of directions defined by the vertices and by particles with a high rapidity relative to the jet axis. A numerical error-propagation method [21] makes it possible to obtain accurate estimates for the uncertainty of the angular coordinates measured from vertex pairs. These errors, as well as the error for the decay length measurement used in the secondary vertex selection, are calculated for each pair of vertices from the associated error matrices.
Particles coming from the decay of hadrons produced in Z decays have a characteristically high rapidity relative to the original direction of the hadron when compared to that of particles coming from fragmentation. A cut on the particle rapidity distribution is thus a powerful tool for selecting the meson decay constituents[9]. A second estimate for the direction of the is obtained by summing the momenta of all charged and neutral particles (excluding the candidate) with rapidity relative to the original jet axis. Estimates for the uncertainty of the coordinates obtained by this method are determined from simulated meson decays as an average value for all events. The final direction coordinates are taken as the error-weighted averages of these two sets of coordinates.
The resolution for each coordinate is parametrized by a two-Gaussian fit to the difference between the reconstructed and generated values. For , the two widths are and with of the mesons in the first Gaussian. For , the two widths are and with of the mesons in the first Gaussian.
2 B meson energy reconstruction
The energy of the meson candidate is estimated by taking advantage of the known center of mass energy at LEP to constrain the measured value. The energy of the meson from this method [12] can be expressed as
| (1) |
where is the mass of the Z boson and is the mass of all particles in the event other than the . To determine , the energy and momenta of all particles in the event with rapidity , including the candidate (regardless of its rapidity), are summed and . Fitting the difference between reconstructed and generated values for the B meson energy with an asymmetric Gaussian yields a maximum width of .
III Analysis of the Mass Spectrum
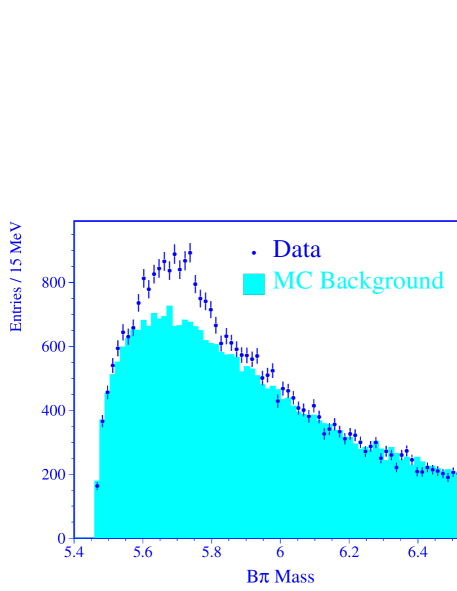
The combined mass is defined as
| (2) |
where and are set to and , respectively, and is the measured angle between the meson and the candidate. The data mass spectrum is shown in Figure 1.a together with the expected Monte Carlo background.
A Background function
The background distribution is estimated from the Monte Carlo data sample, excluding decays, and fitted with a six-parameter threshold function given by
| (3) |
Parameters through are fixed to the shape of the simulated background, while the overall normalization factor is allowed to float freely in order to obtain a correct estimate of the contribution of the background to the statistical error of the signal.
B Signal function
To examine the underlying structure of the signal, it is necessary to unfold effects due to detector resolution. The candidates are expected to have typical momenta of a few . In this range, the single track momentum resolution is no more than a few percent with an angular resolution better than . The dominant sources of uncertainty for the mass measurement are thus the B meson angular and energy resolutions. Monte Carlo studies confirm that these two components are dominant and roughly equal in magnitude. This analysis thus concentrates on unfolding the effects of these components by parametrizing and removing their contribution to the mass resolution.
1 Signal resolution and efficiency
The dependence of the mass resolution and selection efficiency on value is studied by generating signal events at several different values of mass and Breit-Wigner width. The simulated events are passed through the same event reconstruction and selection as the data. The resulting mass distributions are each fitted with a Breit-Wigner function convoluted with a Gaussian resolution (Voigt function) and the detector resolution is extracted by fixing the Breit-Wigner width to the generated value.
The Gaussian width is found to increase linearly from to in the mass range . This increase with value is mainly due to the angular component of the uncertainty, which increases as a function of the opening angle . The resolution is parametrized as a linear function of the mass from a fit to the extracted widths. Similarly, the selection efficiency is found to increase slightly with value and the dependence is parametrized with a linear function.
Agreement between data and Monte Carlo for the meson energy and angular resolution is confirmed by analyzing decays selected from the same sample of mesons. The photon selection for this test is the same as that described in reference [8]. A meson decays electromagnetically and hence has a negligible decay width compared to the detector resolution. As in the case of the mass resolution, the meson energy and angular resolution are the dominant components of the reconstructed mass resolution. Fits to the spectra are performed with the combination of a Gaussian signal and the background function described above. For the Monte Carlo, the Gaussian mean value is found to be with a width of . The input generator mass difference is . For the data, the Gaussian mean value is found to be with a width of . Good agreement between the widths of the data and Monte Carlo signals provides confidence that the energy and angular resolution are well understood and simulated.
2 Combined signal
According to spin-parity rules, five mass resonances are expected, corresponding to five possible decay modes: , , , and . No attempt is made to tag subsequent decays, as the efficiency for selecting the soft photon is relatively low. As a result, the effective mass for a decay to a meson is shifted down by the mass difference.
 |
 |
| a) | b) |
The five resonances are fitted with five Voigt functions, with the relative production fractions determined by spin counting rules. The Gaussian convolutions to the widths are determined by the resolution function. Additional physical constraints are applied to the mass differences and relative widths in order to obtain the most information possible from the data sample.
Predictions for the mass differences and depend on several factors, including the and quark masses and, in some cases, input from experimental data of the D meson system. The values are predicted to be roughly equal and in the range [2, 4, 5, 6, 7]. We constrain both of the mass differences to .
Predictions for the Breit-Wigner widths of the are extrapolated from measurements in the D meson system [23] and are expected to be roughly equal and about . No precise predictions exist for the states as there are no corresponding measurements in the D system. In general, however, they are also expected to be roughly equal, although broader than those of the states. We constrain and , but allow the widths of the and to float freely in the fit.
C Fit results
Monte Carlo events for each of the expected decays are generated and passed through the simulation and reconstruction programs and the event selection. The resulting mass spectra are combined with background and fitted with the signal and background functions under the constraints described above. Mass values and decay widths for the and resonances and the overall normalization are extracted from the fit and found to agree well with the generated values. All differences lie within the statistical error and have no systematic trend.
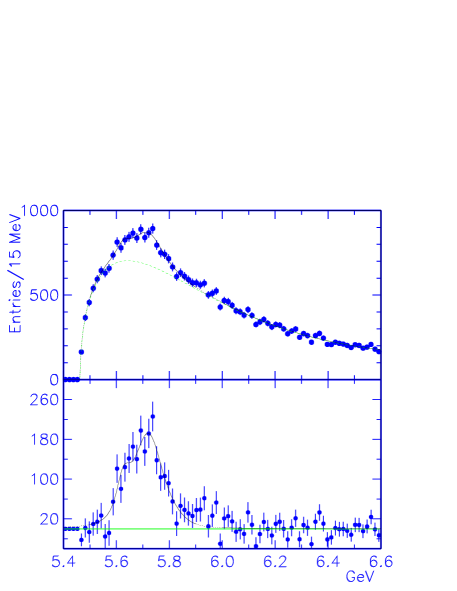
The data mass spectrum is fitted with the combined signal and background functions, allowing the normalization parameters to float freely. The resulting fit, shown in Figure 1, has a of for degrees of freedom. A total of events occupy the signal region corresponding to a relative production rate of . The mass and width of the are found to be and and the mass and width of the are found to be and .
D Systematic uncertainty
Sources of systematic uncertainty and their estimated contributions to the errors of the measured values are summarized in Table II. The hadron purity of the sample is varied from to . The fraction of quarks hadronizing to mesons is taken to be and is varied between and in accordance with the recommendations of the LEP Oscillation Working Group [22]. These variations effect only the overall production fraction.
Systematic effects due to background modelling are studied by varying the shape parameters of the background function and by performing the fit with other background functions to study the effect on the measured values. Contributions to the error due to modelling of the signal are estimated for the mass and width constraints: the and mass differences are varied in the range and the and ratios are varied between and . Effects due to uncertainty in the resolution and efficiency functions are estimated by varying the slopes and offsets of the linear parametrizations.
Three-body decays of the type have been generated and passed through the simulation and reconstruction programs and the event selection. pairs, for which only one of the pions is tagged, are studied as a possible source of resonant background. The resulting reflection is found to contribute insignificantly to the background in regions of small value. Similarly, generated decays, where the is mistaken for a are found to contribute only slightly to the low value region and their effects are included in the background modelling uncertainty contribution.
IV Conclusion
We measure for the first time the masses and decay widths of the () and () mesons. From a constrained fit to the mass spectrum, we find
The relative production rate, including all spin states, is measured to be
where isospin symmetry is employed to account for decays to neutral pions.
| Sources | |||||
|---|---|---|---|---|---|
| purity | — | — | — | — | |
| fraction | — | — | — | — | |
| background | |||||
| M constraints | |||||
| constraints | |||||
| resolution | |||||
| efficiency | |||||
| Total |
Acknowledgments
I wish to thank my colleagues Steven Goldfarb and Franz Muheim for their help in preparing this talk.
REFERENCES
- [1] S. Goldfarb, Talk presented at ICHEP98 Conference, Vancouver (1998).
-
[2]
M. Gronau, A. Nippe and J.L. Rosner, Phys. Rev. D 47 (1993) 1988;
M. Gronau and J.L. Rosner, Phys. Rev. D 49 (1994) 254. - [3] J.L. Rosner, Comments Nucl. Part. Phys. 16 (1986) 109.
-
[4]
E.J. Eichten, C.T. Hill and C. Quigg, Phys. Rev. Lett. 71 (1993) 4116;
E.J. Eichten, C.T. Hill and C. Quigg, Fermilab-Conf-94/118-T (1994). - [5] A.F. Falk and T. Mehen, Phys. Rev. D 53 (1996) 231.
- [6] N. Isgur, Phys. Rev. D 57 (1998) 4041.
- [7] D. Ebert, V.O. Galkin and R.N. Faustov, Phys. Rev. D 57 (1998) 5663.
-
[8]
L3 Collaboration, Phys. Lett. B 345 (1995) 589;
L3 Collaboration, Contribution to EPS Conference, Brussels EPS95 (1995). - [9] DELPHI Collaboration, Z. Phys. C 68 (1995) 353.
- [10] OPAL Collaboration, Z. Phys. C 74 (1997) 413.
- [11] ALEPH Collaboration, Z. Phys. C 69 (1996) 393.
- [12] OPAL Collaboration, Z. Phys. C 66 (1995) 19.
- [13] DELPHI Collaboration, Phys. Lett. B 345 (1995) 598.
- [14] ALEPH Collaboration, Phys. Lett. B 425 (1998) 215.
-
[15]
L3 Collaboration, Nucl. Instr. and Meth. A 289 (1990) 35;
L3 Collaboration, Physics Reports 236 (1993) 1. - [16] L3 Collaboration, Phys. Lett. B 307 (1993) 237.
-
[17]
J. Branson et al., L3 Note 2108, June 24, (1997).
This is an L3 note available on request from: L3 Secretariat, CERN-PPE, 1211 Genève 23, Suisse. -
[18]
T. Sjöstrand and M. Bengtsson, Comput. Phys. Commun. 43 (1987) 367;
T. Sjöstrand, Comp. Phys. Comm. 82 (1994) 74;
T. Sjöstrand, Lund and CERN Preprints LU TP 95-20/CERN-TH.7112/93 (revised, 1995). - [19] The L3 detector simulation is based on GEANT Version 3.15; see R. Brun et al., GEANT 3, CERN DD/EE/84-1 (revised 1987) and the GHEISHA program (H. Fesefeld, RWTH Aachen Report PITHA 85/02 (1985)) for the simulation of hadronic interactions.
- [20] CDF Collaboration, Phys. Rev. Lett. 80 (1998) 2057.
- [21] J. Swain and L. Taylor, Numerical Construction of Likelihood Distributions and the Propagation of Errors, Nucl. Instr. and Methods 411 (1998) 153.
- [22] The LEP B Oscillation Working Group, V. Andreev et al., LEPBOSC/97-01 (1997).
-
[23]
ARGUS Collaboration, Phys. Rev. Lett. 56 (1986) 549;
Phys. Lett. B 221 (1989) 422;
Phys. Lett. B 231 (1989) 208;
Z. Phys. C 69 (1996) 405;
CLEO Collaboration, Phys. Rev. D 41 (1990) 774; Phys. Lett. B 303 (1993) 377; Phys. Lett. B 331 (1994) 236; Phys. Lett. B 340 (1994) 194; Phys. Rev. Lett. 72 (1994) 1972;
E691 Collaboration, Phys. Rev. Lett. 62 (1989) 1717;
E687 Collaboration, Phys. Rev. Lett. 72 (1994) 324;
BEBC Collaboration, Z. Phys. C 61 (1994) 563;
OPAL Collaboration, Z. Phys. C 67 (1995) 57; Z. Phys. C 76 (1997) 425;
ALEPH Collaboration, Phys. Lett. B 345 (1994) 103; Z. Phys. C 62 (1994) 1; Z. Phys. C 73 (1997) 601.