DESY–99–041
Measurement of multiplicity and momentum
spectra in the current and target regions
of the Breit frame in Deep Inelastic Scattering
at HERA
Abstract
Charged particle production in neutral current deep inelastic scattering (DIS) has been studied using the ZEUS detector. The evolution of the mean multiplicities, scaled momenta and transverse momenta in and for and has been investigated in the current and target fragmentation regions of the Breit frame. Distributions in the target region, using HERA data for the first time, are compared to distributions in the current region. Predictions based on MLLA and LPHD are inconsistent with the data.
The ZEUS Collaboration
J. Breitweg,
S. Chekanov,
M. Derrick,
D. Krakauer,
S. Magill,
B. Musgrave,
J. Repond,
R. Stanek,
R. Yoshida
Argonne National Laboratory, Argonne, IL, USA p
M.C.K. Mattingly
Andrews University, Berrien Springs, MI, USA
G. Abbiendi,
F. Anselmo,
P. Antonioli,
G. Bari,
M. Basile,
L. Bellagamba,
D. Boscherini,
A. Bruni,
G. Bruni,
G. Cara Romeo,
G. Castellini1,
L. Cifarelli2,
F. Cindolo,
A. Contin,
N. Coppola,
M. Corradi,
S. De Pasquale,
P. Giusti,
G. Iacobucci3,
G. Laurenti,
G. Levi,
A. Margotti,
T. Massam,
R. Nania,
F. Palmonari,
A. Pesci,
A. Polini,
G. Sartorelli,
Y. Zamora Garcia4,
A. Zichichi
University and INFN Bologna, Bologna, Italy f
C. Amelung,
A. Bornheim,
I. Brock,
K. Coböken,
J. Crittenden,
R. Deffner,
M. Eckert5,
H. Hartmann,
K. Heinloth,
L. Heinz6,
E. Hilger,
H.-P. Jakob,
A. Kappes,
U.F. Katz,
R. Kerger,
E. Paul,
M. Pfeiffer7,
J. Rautenberg,
H. Schnurbusch,
A. Stifutkin,
J. Tandler,
A. Weber,
H. Wieber
Physikalisches Institut der Universität Bonn,
Bonn, Germany c
D.S. Bailey,
O. Barret,
W.N. Cottingham,
B. Foster8,
G.P. Heath,
H.F. Heath,
J.D. McFall,
D. Piccioni,
J. Scott,
R.J. Tapper
H.H. Wills Physics Laboratory, University of Bristol,
Bristol, U.K. o
M. Capua,
A. Mastroberardino,
M. Schioppa,
G. Susinno
Calabria University,
Physics Dept.and INFN, Cosenza, Italy f
H.Y. Jeoung,
J.Y. Kim,
J.H. Lee,
I.T. Lim,
K.J. Ma,
M.Y. Pac9
Chonnam National University, Kwangju, Korea h
A. Caldwell,
N. Cartiglia,
Z. Jing,
W. Liu,
B. Mellado,
J.A. Parsons,
S. Ritz10,
R. Sacchi,
S. Sampson,
F. Sciulli,
Q. Zhu11
Columbia University, Nevis Labs.,
Irvington on Hudson, N.Y., USA q
P. Borzemski,
J. Chwastowski,
A. Eskreys,
J. Figiel,
K. Klimek,
K. Olkiewicz,
M.B. Przybycień,
L. Zawiejski
Inst. of Nuclear Physics, Cracow, Poland j
L. Adamczyk12,
B. Bednarek,
K. Jeleń,
D. Kisielewska,
A.M. Kowal,
T. Kowalski,
M. Przybycień,
E. Rulikowska-Zarȩbska,
L. Suszycki,
J. Zaja̧c
Faculty of Physics and Nuclear Techniques,
Academy of Mining and Metallurgy, Cracow, Poland j
Z. Duliński,
A. Kotański
Jagellonian Univ., Dept. of Physics, Cracow, Poland k
L.A.T. Bauerdick,
U. Behrens,
H. Beier13,
J.K. Bienlein,
C. Burgard,
K. Desler,
G. Drews,
A. Fox-Murphy, U. Fricke,
F. Goebel,
P. Göttlicher,
R. Graciani,
T. Haas,
W. Hain,
G.F. Hartner,
D. Hasell14,
K. Hebbel,
K.F. Johnson15,
M. Kasemann16,
W. Koch,
U. Kötz,
H. Kowalski,
L. Lindemann,
B. Löhr,
M. Martínez, J. Milewski17,
M. Milite,
T. Monteiro18,
M. Moritz,
D. Notz,
A. Pellegrino,
F. Pelucchi,
K. Piotrzkowski,
M. Rohde,
P.R.B. Saull,
A.A. Savin,
U. Schneekloth,
O. Schwarzer19,
F. Selonke,
M. Sievers,
S. Stonjek,
E. Tassi,
D. Westphal20,
G. Wolf,
U. Wollmer,
C. Youngman,
W. Zeuner
Deutsches Elektronen-Synchrotron DESY, Hamburg, Germany
B.D. Burow21,
C. Coldewey,
H.J. Grabosch,
A. Lopez-Duran Viani,
A. Meyer,
K. Mönig,
S. Schlenstedt,
P.B. Straub
DESY Zeuthen, Zeuthen, Germany
G. Barbagli,
E. Gallo,
P. Pelfer
University and INFN, Florence, Italy f
G. Maccarrone,
L. Votano
INFN, Laboratori Nazionali di Frascati, Frascati, Italy f
A. Bamberger,
S. Eisenhardt22,
P. Markun,
H. Raach,
S. Wölfle
Fakultät für Physik der Universität Freiburg i.Br.,
Freiburg i.Br., Germany c
J.T. Bromley,
N.H. Brook23,
P.J. Bussey,
A.T. Doyle,
S.W. Lee,
N. Macdonald,
G.J. McCance,
D.H. Saxon,
L.E. Sinclair,
I.O. Skillicorn,
E. Strickland,
R. Waugh
Dept. of Physics and Astronomy, University of Glasgow,
Glasgow, U.K. o
I. Bohnet,
N. Gendner, U. Holm,
A. Meyer-Larsen,
H. Salehi,
K. Wick
Hamburg University, I. Institute of Exp. Physics, Hamburg,
Germany c
A. Garfagnini,
I. Gialas24,
L.K. Gladilin25,
D. Kçira26,
R. Klanner, E. Lohrmann,
G. Poelz,
F. Zetsche
Hamburg University, II. Institute of Exp. Physics, Hamburg,
Germany c
T.C. Bacon,
J.E. Cole,
G. Howell,
L. Lamberti27,
K.R. Long,
D.B. Miller,
A. Prinias28,
J.K. Sedgbeer,
D. Sideris,
A.D. Tapper,
R. Walker
Imperial College London, High Energy Nuclear Physics Group,
London, U.K. o
U. Mallik,
S.M. Wang
University of Iowa, Physics and Astronomy Dept.,
Iowa City, USA p
P. Cloth,
D. Filges
Forschungszentrum Jülich, Institut für Kernphysik,
Jülich, Germany
T. Ishii,
M. Kuze,
I. Suzuki29,
K. Tokushuku30,
S. Yamada,
K. Yamauchi,
Y. Yamazaki
Institute of Particle and Nuclear Studies, KEK,
Tsukuba, Japan g
S.H. Ahn,
S.H. An,
S.J. Hong,
S.B. Lee,
S.W. Nam31,
S.K. Park
Korea University, Seoul, Korea h
H. Lim,
I.H. Park,
D. Son
Kyungpook National University, Taegu, Korea h
F. Barreiro,
J.P. Fernández,
G. García,
C. Glasman32,
J.M. Hernández33,
L. Labarga,
J. del Peso,
J. Puga,
I. Redondo34,
J. Terrón
Univer. Autónoma Madrid,
Depto de Física Teórica, Madrid, Spain n
F. Corriveau,
D.S. Hanna,
J. Hartmann35,
W.N. Murray5,
A. Ochs,
S. Padhi,
M. Riveline,
D.G. Stairs,
M. St-Laurent,
M. Wing
McGill University, Dept. of Physics,
Montréal, Québec, Canada b
T. Tsurugai
Meiji Gakuin University, Faculty of General Education, Yokohama, Japan
V. Bashkirov36,
B.A. Dolgoshein
Moscow Engineering Physics Institute, Moscow, Russia l
G.L. Bashindzhagyan,
P.F. Ermolov,
Yu.A. Golubkov,
L.A. Khein,
N.A. Korotkova,
I.A. Korzhavina,
V.A. Kuzmin,
O.Yu. Lukina,
A.S. Proskuryakov,
L.M. Shcheglova37,
A.N. Solomin37,
S.A. Zotkin
Moscow State University, Institute of Nuclear Physics,
Moscow, Russia m
C. Bokel, M. Botje,
N. Brümmer,
J. Engelen,
E. Koffeman,
P. Kooijman,
A. van Sighem,
H. Tiecke,
N. Tuning,
J.J. Velthuis,
W. Verkerke,
J. Vossebeld,
L. Wiggers,
E. de Wolf
NIKHEF and University of Amsterdam, Amsterdam, Netherlands i
D. Acosta38,
B. Bylsma,
L.S. Durkin,
J. Gilmore,
C.M. Ginsburg,
C.L. Kim,
T.Y. Ling,
P. Nylander
Ohio State University, Physics Department,
Columbus, Ohio, USA p
H.E. Blaikley,
R.J. Cashmore18,
A.M. Cooper-Sarkar,
R.C.E. Devenish,
J.K. Edmonds,
J. Große-Knetter39,
N. Harnew,
T. Matsushita,
V.A. Noyes40,
A. Quadt18,
O. Ruske,
M.R. Sutton,
R. Walczak,
D.S. Waters
Department of Physics, University of Oxford,
Oxford, U.K. o
A. Bertolin,
R. Brugnera,
R. Carlin,
F. Dal Corso,
U. Dosselli,
S. Dusini,
S. Limentani,
M. Morandin,
M. Posocco,
L. Stanco,
R. Stroili,
C. Voci
Dipartimento di Fisica dell’ Università and INFN,
Padova, Italy f
L. Iannotti41,
B.Y. Oh,
J.R. Okrasiński,
W.S. Toothacker,
J.J. Whitmore
Pennsylvania State University, Dept. of Physics,
University Park, PA, USA q
Y. Iga
Polytechnic University, Sagamihara, Japan g
G. D’Agostini,
G. Marini,
A. Nigro,
M. Raso
Dipartimento di Fisica, Univ. ’La Sapienza’ and INFN,
Rome, Italy
C. Cormack,
J.C. Hart,
N.A. McCubbin,
T.P. Shah
Rutherford Appleton Laboratory, Chilton, Didcot, Oxon,
U.K. o
D. Epperson,
C. Heusch,
H.F.-W. Sadrozinski,
A. Seiden,
R. Wichmann,
D.C. Williams
University of California, Santa Cruz, CA, USA p
N. Pavel
Fachbereich Physik der Universität-Gesamthochschule
Siegen, Germany c
H. Abramowicz42,
S. Dagan43,
S. Kananov43,
A. Kreisel,
A. Levy43,
A. Schechter
Raymond and Beverly Sackler Faculty of Exact Sciences,
School of Physics, Tel-Aviv University,
Tel-Aviv, Israel e
T. Abe,
T. Fusayasu,
M. Inuzuka,
K. Nagano,
K. Umemori,
T. Yamashita
Department of Physics, University of Tokyo,
Tokyo, Japan g
R. Hamatsu,
T. Hirose,
K. Homma44,
S. Kitamura45,
T. Nishimura
Tokyo Metropolitan University, Dept. of Physics,
Tokyo, Japan g
M. Arneodo46,
R. Cirio,
M. Costa,
M.I. Ferrero,
S. Maselli,
V. Monaco,
C. Peroni,
M.C. Petrucci,
M. Ruspa,
A. Solano,
A. Staiano
Università di Torino, Dipartimento di Fisica Sperimentale
and INFN, Torino, Italy f
M. Dardo
II Faculty of Sciences, Torino University and INFN -
Alessandria, Italy f
D.C. Bailey,
C.-P. Fagerstroem,
R. Galea,
T. Koop,
G.M. Levman,
J.F. Martin,
R.S. Orr,
S. Polenz,
A. Sabetfakhri,
D. Simmons
University of Toronto, Dept. of Physics, Toronto, Ont.,
Canada a
J.M. Butterworth, C.D. Catterall,
M.E. Hayes,
E.A. Heaphy,
T.W. Jones,
J.B. Lane
University College London, Physics and Astronomy Dept.,
London, U.K. o
J. Ciborowski,
G. Grzelak47,
R.J. Nowak,
J.M. Pawlak,
R. Pawlak,
B. Smalska,
T. Tymieniecka,
A.K. Wróblewski,
J.A. Zakrzewski,
A.F. Żarnecki
Warsaw University, Institute of Experimental Physics,
Warsaw, Poland j
M. Adamus,
T. Gadaj
Institute for Nuclear Studies, Warsaw, Poland j
O. Deppe,
Y. Eisenberg43,
D. Hochman,
U. Karshon43
Weizmann Institute, Department of Particle Physics, Rehovot,
Israel d
W.F. Badgett,
D. Chapin,
R. Cross,
C. Foudas,
S. Mattingly,
D.D. Reeder,
W.H. Smith,
A. Vaiciulis48,
T. Wildschek,
M. Wodarczyk
University of Wisconsin, Dept. of Physics,
Madison, WI, USA p
A. Deshpande,
S. Dhawan,
V.W. Hughes
Yale University, Department of Physics,
New Haven, CT, USA p
S. Bhadra,
W.R. Frisken,
R. Hall-Wilton,
M. Khakzad,
S. Menary,
W.B. Schmidke
York University, Dept. of Physics, Toronto, Ont.,
Canada a
1 also at IROE Florence, Italy
2 now at Univ. of Salerno and INFN Napoli, Italy
3 also at DESY
4 supported by Worldlab, Lausanne, Switzerland
5 now a self-employed consultant
6 now at Spectral Design GmbH, Bremen
7 now at EDS Electronic Data Systems GmbH, Troisdorf, Germany
8 also at University of Hamburg, Alexander von
Humboldt Research Award
9 now at Dongshin University, Naju, Korea
10 now at NASA Goddard Space Flight Center, Greenbelt, MD
20771, USA
11 now at Greenway Trading LLC
12 supported by the Polish State Committee for
Scientific Research, grant No. 2P03B14912
13 now at Innosoft, Munich, Germany
14 now at Massachusetts Institute of Technology, Cambridge, MA,
USA
15 visitor from Florida State University
16 now at Fermilab, Batavia, IL, USA
17 now at ATM, Warsaw, Poland
18 now at CERN
19 now at ESG, Munich
20 now at Bayer A.G., Leverkusen, Germany
21 now an independent researcher in computing
22 now at University of Edinburgh, Edinburgh, U.K.
23 PPARC Advanced fellow
24 visitor of Univ. of Crete, Greece,
partially supported by DAAD, Bonn - Kz. A/98/16764
25 on leave from MSU, supported by the GIF,
contract I-0444-176.07/95
26 supported by DAAD, Bonn - Kz. A/98/12712
27 supported by an EC fellowship
28 PPARC Post-doctoral fellow
29 now at Osaka Univ., Osaka, Japan
30 also at University of Tokyo
31 now at Wayne State University, Detroit
32 supported by an EC fellowship number ERBFMBICT 972523
33 now at HERA-B/DESY supported by an EC fellowship
No.ERBFMBICT 982981
34 supported by the Comunidad Autonoma de Madrid
35 now at debis Systemhaus, Bonn, Germany
36 now at Loma Linda University, Loma Linda, CA, USA
37 partially supported by the Foundation for German-Russian Collaboration
DFG-RFBR
(grant no. 436 RUS 113/248/3 and no. 436 RUS 113/248/2)
38 now at University of Florida, Gainesville, FL, USA
39 supported by the Feodor Lynen Program of the Alexander
von Humboldt foundation
40 now with Physics World, Dirac House, Bristol, U.K.
41 partly supported by Tel Aviv University
42 an Alexander von Humboldt Fellow at University of Hamburg
43 supported by a MINERVA Fellowship
44 now at ICEPP, Univ. of Tokyo, Tokyo, Japan
45 present address: Tokyo Metropolitan University of
Health Sciences, Tokyo 116-8551, Japan
46 now also at Università del Piemonte Orientale,
Dipartimento di Scienze Mediche,
via Solaroli 17, I-28100 Novara, Italy
47 supported by the Polish State
Committee for Scientific Research, grant No. 2P03B09308
48 now at University of Rochester, Rochester, NY, USA
| a | supported by the Natural Sciences and Engineering Research Council of Canada (NSERC) |
|---|---|
| b | supported by the FCAR of Québec, Canada |
| c | supported by the German Federal Ministry for Education and Science, Research and Technology (BMBF), under contract numbers 057BN19P, 057FR19P, 057HH19P, 057HH29P, 057SI75I |
| d | supported by the MINERVA Gesellschaft für Forschung GmbH, the German Israeli Foundation, and by the Israel Ministry of Science |
| e | supported by the German-Israeli Foundation, the Israel Science Foundation, the U.S.-Israel Binational Science Foundation, and by the Israel Ministry of Science |
| f | supported by the Italian National Institute for Nuclear Physics (INFN) |
| g | supported by the Japanese Ministry of Education, Science and Culture (the Monbusho) and its grants for Scientific Research |
| h | supported by the Korean Ministry of Education and Korea Science and Engineering Foundation |
| i | supported by the Netherlands Foundation for Research on Matter (FOM) |
| j | supported by the Polish State Committee for Scientific Research, grant No. 115/E-343/SPUB/P03/154/98, 2P03B03216, 2P03B04616, 2P03B10412, 2P03B05315, and by the German Federal Ministry of Education and Science, Research and Technology (BMBF) |
| k | supported by the Polish State Committee for Scientific Research (grant No. 2P03B08614 and 2P03B06116) |
| l | partially supported by the German Federal Ministry for Education and Science, Research and Technology (BMBF) |
| m | supported by the Fund for Fundamental Research of Russian Ministry for Science and Education and by the German Federal Ministry for Education and Science, Research and Technology (BMBF) |
| n | supported by the Spanish Ministry of Education and Science through funds provided by CICYT |
| o | supported by the Particle Physics and Astronomy Research Council |
| p | supported by the US Department of Energy |
| q | supported by the US National Science Foundation |
1 Introduction
This paper reports the results of a study of the properties of the hadronic final state in neutral current positron-proton deep inelastic scattering (DIS). The fragmentation of the struck quark in DIS is compared to that of the quarks produced in annihilation, allowing the concept of universality of fragmentation in different processes to be tested. A comparison is also made of the fragmentation associated with the outgoing struck quark to that in the target region; the latter is associated with the initial state radiation from the incoming proton. The data are compared to analytical Quantum Chromodynamic (QCD) predictions for the momenta spectra for both the current and target region.
The event kinematics of DIS are determined by the negative square of the four-momentum of the virtual exchanged boson, , and the Bjorken scaling variable, , where is the four-momentum of the proton. In the Quark Parton Model (QPM), the interacting quark from the proton carries four-momentum The variable , the fractional energy transfer to the proton in its rest frame, is related to and by , where is the positron-proton centre of mass energy. The invariant mass, , of the hadronic system is related to and the proton mass, , by At fixed , the behaviour reflects the dependence.
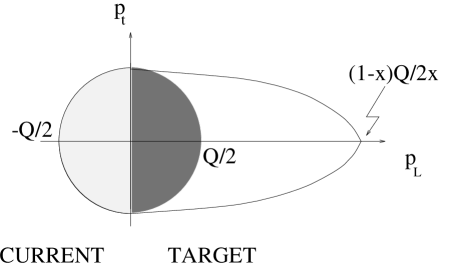
A natural frame in which to study the dynamics of the hadronic final state in DIS is the Breit frame [1]. In this frame, the exchanged virtual boson () is completely space-like and has a four-momentum , where is the momentum of the proton in the Breit frame. The particles produced in the interaction can be assigned to one of two regions: the current region if their -momentum in the Breit frame is negative, and the target region if their -momentum is positive (see Fig. 1). The main advantage of this frame is that it gives a maximal separation of the incoming and outgoing partons in the QPM. In this model the maximum momentum a particle can have in the current region is while in the target region the maximum is In the Breit frame, unlike the hadronic centre of mass () frame, the two regions are asymmetric, particularly at low where the target region occupies most of the available phase space.
The measurements presented here extend the previous studies of fragmentation in the Breit frame performed at HERA [2, 3, 4]. Increased statistics coming from an integrated luminosity of lead to a significant improvement in the precision of the scaled momentum distributions of the charged particles in the current fragmentation region. A subset of data, corresponding to has also been used to measure a small part of the target fragmentation region (the dark shaded region indicated in Fig. 1); the study of the target region is limited by acceptance and systematic effects rather than by statistics. The scaled and the transverse momentum distributions of charged particles in the hadronic final state are measured in the current and target regions of the Breit frame as a function of and in the ranges and Comparisons are made with Monte Carlo models, QCD analytical calculations and data.
2 QCD Models
The current region in the Breit frame is analogous to a single hemisphere of annihilation. In annihilation the two quarks are produced with equal and opposite momenta, The fragmentation of these quarks can be compared to that of the quark struck from the proton; this quark has an outgoing momentum in the Breit frame. In the direction of this struck quark the scaled momentum spectra of the particles, expressed in terms of are expected [5, 6, 7] to have a dependence on similar to that observed in annihilation at energy with no dependence. The effects of higher order processes not present in annihilation are discussed in Ref. [8].
Results from annihilation support the need for coherence effects in perturbative QCD [9, 10, 11, 12, 13]. The phenomenon of coherence is a natural consequence of the quantum mechanical treatment of the parton cascade. Long wavelength gluons are unable to resolve individual colour charges of partons within the parton cascade. This has the effect that the available phase space for soft gluon emissions is reduced to an angular-ordered region, due to destructive interference. This leads to a number of important differences in the properties of the partonic final state relative to the incoherent case. The most notable of these are a slower rise in the multiplicity of partons with increasing initial parton energy, and the modification of the parton logarithmic momentum spectra to a skewed Gaussian form, often referred to as the “hump-backed” plateau [12]. The parton level predictions in practice depend on two free parameters, a running strong coupling, governed by a QCD scale and an energy cut-off, below which the parton evolution is truncated. In this case is an effective scale parameter and is not to be identified with the standard QCD scale, e.g. . In particular, predictions can be made at yielding the so-called limiting spectrum.
Within the framework of the modified leading log approximation (MLLA) there are predictions of how the higher order moments of the parton momentum spectra should evolve with the energy scale [14, 15]. The MLLA calculations are made at the parton level. The hypothesis of local parton hadron duality (LPHD) [16], which relates the observed hadron distributions to the calculated parton distributions via a constant of proportionality, is used in conjunction with the parton predictions of the MLLA to allow the calculation to be directly compared to data. There is uncertainty about the energy scale at which the applicability of LPHD breaks down, in which case the parton predictions cannot be compared to the hadron distributions.
DIS at low allows a study of fragmentation in the target region following the initial scattering off a sea quark (or antiquark). The description based on MLLA [17] is shown schematically in Fig. 2, where the quark box at the top of the gluon ladder represents the scattered sea quark plus its antiquark partner. There are various contributions to these calculations. Contribution C, the top leg of the quark box, corresponds to fragmentation in the current region. Three further contributions (T1, T2 and T3), which are sources of soft gluons, are considered in these analytical calculations to be associated with the target region. It is predicted [17] that the contribution T1 behaves in the same way as the current quark C and so should have no dependence. The contribution T2 is due to the colour field between the remnant and the struck quark, and the contribution T3 corresponds to the fragmentation of the rungs in the gluon ladder. Both T2 and T3 are predicted to have and dependences which differ from T1. Both the T1 and T2 contributions have been calculated and give particles of momenta The collinear gluons T3, on the other hand, generally fragment to particles with momentum For values of the scaled momentum the region of phase space is analogous to the current region and has contributions mainly from T1 and T2. The parton momentum spectra predicted by MLLA, over a range of and are shown in more detail in Ref. [6]. In the target region these spectra are approximately Gaussian for ; they peak at a value of in the range of and measured in this paper, falling to a plateau region for (the maximum value of in the target region). The acceptance of the ZEUS detector allows the study of the contributions from C, from T1 and from T2.
Scaling violations are predicted in the fragmentation functions, which represent the probability for a parton to fragment into a particular hadron carrying a given fraction of the parton’s energy. Fragmentation functions incorporate the long-distance non-perturbative physics of the hadronisation process in which the observed hadrons are formed from final state partons of the hard scattering process. Like parton densities, they cannot be calculated in perturbative QCD but can be evolved with the hard-process scale, using the DGLAP evolution [18] equations, from a starting distribution at a defined energy scale; this starting distribution can be derived from a fit to data. If the fragmentation functions are combined with the cross sections for the inclusive production of each parton type in the given physical process, predictions can be made for scaling violations, expressed as the evolution of the spectra of final state hadrons [19]. These scaling violations allow a measurement of the strong coupling constant, , and such studies have been performed at LEP [20, 21] by incorporating lower energy PETRA data. The NLO calculations (CYCLOPS) [22] of the scaled momentum distribution exist for DIS but as yet the appropriate fragmentation functions at different values of do not exist to allow the extraction of from DIS data.
3 Experimental Setup
The data presented here were taken at the positron-proton collider HERA using the ZEUS detector. The of data corresponds to data taken in 1994-1996 and part of the 1997 data sample. The 1995 data alone, corresponding to was used to investigate the target region. During the period 1994-1997 HERA operated with positrons of energy GeV and protons with energy GeV. The ZEUS detector is a multipurpose detector. Of particular importance in this analysis are the central tracking detector (CTD) and the uranium-scintillator calorimeter (CAL). A detailed description of the ZEUS detector can be found in [23, 24].
Throughout this paper we use the standard ZEUS right-handed coordinate system, in which is the nominal interaction point, the positive -axis points in the direction of the proton beam (referred to as the forward direction) and the -axis is horizontal, pointing towards the centre of HERA.
The tracking system consists of a central tracking chamber (CTD) [25] in a 1.43 T solenoidal magnetic field. The CTD, which surrounds the beampipe, is a drift chamber consisting of 72 cylindrical layers, arranged in 9 superlayers. Superlayers with wires parallel to the beam axis alternate with those inclined at a small angle to give a stereo view. The single hit efficiency of the CTD is greater than 95 The resolution of the transverse momentum, in the laboratory frame for full-length tracks can be parametrised as with in GeV. (This form is a more precise description of the transverse momentum resolution, particularly at low to medium , than that given hitherto).
Surrounding the solenoid is the uranium-scintillator calorimeter (CAL) [26], which is divided into three parts: forward, barrel and rear covering the polar regions to , to and to , respectively. The CAL covers 99.7 of the solid angle, with holes in the centres of the forward and rear calorimeters to accommodate the HERA beampipe. Each of the calorimeter parts is subdivided into towers which are segmented longitudinally into electromagnetic (EMC) and hadronic (HAC) sections. These sections are further subdivided into cells each of which is read out by two photomultipliers. From test beam data, energy resolutions of for electrons and for hadrons ( in GeV) have been obtained.
The ZEUS detector is almost hermetic, allowing the kinematic variables and to be reconstructed in a variety of ways using combinations of energies and angles of the positron and hadronic system. Variables calculated only from the measurements of the energy, and angle, of the scattered positron are denoted with the subscript , whilst those calculated from the hadronic system measurements, with the Jacquet Blondel method [27], are denoted by the subscript Variables calculated by these approaches are used only in the event selection. In the double angle method [28], denoted by the kinematic variables are determined using and the angle (which is the direction of the struck quark in the QPM), defined from the hadronic final state.
The method was used throughout this analysis for the calculation of the boosts and the kinematic variables because it is less sensitive to systematic uncertainties in the energy measurement than other methods.
The triggering and online event selections were identical to those used for the measurement of the structure function [29]. The reconstructed tracks used in the charged particle analyses are associated with the primary event vertex and have MeV and where is the pseudorapidity given by with being the polar angle of the measured track with respect to the proton direction in the lab. frame. This is the region of CTD acceptance where the detector response and systematics are best understood.
Further selection criteria were applied both to ensure accurate reconstruction of the kinematic variables and to increase the purity of the sample by eliminating background from photoproduction processes:
-
•
, to achieve a high purity sample of DIS events;
-
•
GeV to further enhance the purity of the DIS sample;
-
•
, to reduce the photoproduction background;
-
•
, to give sufficient accuracy for reconstruction of and ;
-
•
GeV where the summation is over all calorimeter cells, to remove photoproduction events and events with large radiative corrections;
-
•
where and are the impact position of the positron on the CAL, to avoid the region directly adjacent to the rear beampipe;
-
•
to reduce background events from non- collisions.
4 Event Simulation
Monte Carlo event simulation is used to correct for acceptance and resolution effects. The detector simulation is based on the GEANT 3.13 [30] program and incorporates our best knowledge of the apparatus.
To calculate the correction factors, neutral current DIS events were generated, via the DJANGO 6.24 program [31], using HERACLES 4.5.2 [32] which incorporates first order electroweak corrections. The QCD cascade was modelled with the colour dipole model, including the boson-gluon fusion process, using the ARIADNE 4.08 [33] program. In this model coherence effects are implicitly included in the formalism of the parton cascade. The colour dipole model treats gluons emitted from quark–antiquark (diquark) pairs as radiation from a colour dipole between two partons. This results in partons that are not ordered in their transverse momenta. The program uses the Lund string fragmentation model [34] for the hadronisation phase, as implemented in JETSET 7.4 [35]. For the analysis of the 1995 data, two Monte Carlo samples were generated, with GeV2 and with GeV using the [36] parameterisation of the parton distribution functions. For the 1996 and 1997 data, a sample with GeV (with parton densities [37]), was generated, corresponding to and a sample with GeV2 (with parton densities), corresponding to
For the studies of the systematics for the 1995 data, two additional samples of events were generated ( with GeV2 and with GeV2) using the HERWIG 5.8d Monte Carlo program [38], where no electroweak radiative corrections were applied. In HERWIG, coherence effects in the QCD cascades are included by angular ordering of successive parton emissions and a clustering model is used for the hadronisation [11, 39]. For the 1996 and 1997 data, HERWIG samples with GeV2 were generated, corresponding to and GeV2 (both with parton densities), corresponding to Both the and parametrisations agree well with the HERA measurements of the proton structure function in the range of this analysis [40, 41].
Another approach to modelling the parton cascade is included in the LEPTO 6.5.1 [42] program, which incorporates the LO matrix element matched to DGLAP parton showers (MEPS). This recent version of LEPTO incorporates the soft colour interaction (SCI) model [43] to describe HERA rapidity gap events. SCI produces changes to the usual string topologies in non-gap events causing the string to overlap itself and this results in an increase both of particle number and energy per unit of rapidity.
The Linked Dipole Chain model, LDC 1.0, [44] has also been investigated. In this model the parton shower evolution is based on a reformulation [45] of the CCFM approach [46] which approximates the BFKL [47] prediction at low and the DGLAP prediction in the high limit. The parton density parametrisation of “set A” [44] was used, which fits data from H1 and ZEUS. The DGLAP equation predicts strong ordering of the parton transverse momenta while the BFKL equation relaxes this ordering but imposes strong ordering of the longitudinal momenta. Both the LEPTO and LDC programs use the Lund string fragmentation model. They were used to compare generator level calculations with our data.
5 Correction Procedure
The Monte Carlo event samples were used to determine the mean charged particle acceptance in the current region as a function of . The chosen analysis intervals in correspond to regions of high acceptance (between in the current region of the Breit frame. The acceptance for the limited area of the target region under study () is lower; the distributions have a good acceptance around their peak positions (70-90%) but it falls to about 50% at lower values of for the bins 1-4 defined in Table 1. Due to the low acceptance and large systematic uncertainties for this region is not studied in bins 5-8 and no studies in the target region are made beyond bin 8. There is good acceptance (90%) for both regions under study for where is the transverse momentum with respect to the virtual photon direction in the Breit frame. However the acceptance falls below 50% for These values are well understood in terms of geometrical acceptances.
| Bin no. | range | (GeV2) range |
|---|---|---|
| 1 | ||
| 2 | ||
| 3 | ||
| 4 | ||
| 5 | ||
| 6 | ||
| 7 | ||
| 8 | ||
| 9 | ||
| 10 | ||
| 11 | ||
| 12 | ||
| 13 |
About of the tracks generated in the current region migrate to the target region. Migrations into the current region from the target fragmentation region are typically less than 5% of the tracks assigned to the current region for For these migrations are on average 12%, reaching 25% for and low values of where the hadronic activity is low and the measurement of is subject to systematic problems leading to a worse resolution and hence an uncertainty in the boost vector to the Breit frame.
The correction procedure is based on the detailed Monte Carlo simulation of the ZEUS detector with the event generators described in the previous section. Since the ARIADNE model gives the best overall description of our observed energy flow [48] it is used for the standard corrections to the distributions.
The data are corrected for trigger and event selection cuts; event migration between () intervals; QED radiative effects; track reconstruction efficiency; track selection cuts in and ; track migration between the current and target regions; and for the products of and decays which are assigned to the primary vertex.
Correction factors were obtained from the Monte Carlo simulation by comparing the generated distributions, excluding decay products of and with the reconstructed distributions after the detector and trigger simulations. The same reconstruction, selection and analysis were used for the Monte Carlo simulated events as for the data. The correction factors, , were calculated for each bin using a bin-by-bin correction:
where () is the number of generated (observed) Monte Carlo events in each interval and is the number of charged particles (tracks) in the current or target region in the corresponding and interval. A similar correction procedure was applied for the other variables. The bin sizes of the distributions were chosen to be commensurate with the measurement resolution. In the current region, the overall correction factors are greater than unity and typically In the target region these correction factors are larger but, in the region that we measure, they are typically for bins 1-4 and for bins 5-8.
6 Systematic Checks
The systematic uncertainties in the measurement can be divided into three types: uncertainties due to event reconstruction and selection, to track selection, and to the Monte Carlo model used. The systematic checks were as follows:
-
•
The cut on was changed to .
-
•
The cut on was changed to .
-
•
The tracking cuts on and MeV were tightened to and MeV; the cuts were also removed.
-
•
Instead of requiring vertex fitted tracks, all reconstructed tracks that passed through superlayers one and three of the CTD were accepted.
-
•
The data were corrected using a different hadronisation model, namely HERWIG, in place of ARIADNE.
With the exception of the change in the model from ARIADNE to HERWIG, and the use of non-vertex tracks, all the systematic effects were small, i.e. within two standard deviations of the statistical errors. Of the two major systematic uncertainties, the hadronisation model change was dominant.
Current fragmentation region
The use of non-vertex tracks resulted in an overall increase in the single particle densities of 5% to 15% and was fairly flat across the range. The use of HERWIG to unfold the data gave rise to systematic shifts as large as 15%. For the tendency of the correction was to lower the single particle density values at low and to increase the values at higher For in the range the systematic uncertainties were about 10%. They reduced with increasing to about 5%.
Target fragmentation region
Systematic effects due to the different hadronisation models were largest (as high as 50%) in the distributions at high For they were typically 10%, increasing to 30% at larger The tracking systematic from non-vertex tracks was largest at low in the lowest bin where it is 7%, but otherwise was of the order of 2%. The distribution was little influenced by the model used, as would be expected from the good acceptance, at all but the very lowest transverse momenta. The mean showed a model dependence in the target region of at most 20% which was due to the reduced acceptance for low tracks at high . In general, unfolding with HERWIG resulted in a higher value of the normalised single particle densities.
7 Results
7.1 Current fragmentation region
Figure 3 shows the distributions for charged particles in the current fragmentation region of the Breit frame for different bins of These distributions are approximately Gaussian in shape with the mean charged multiplicity given by the integral of the distributions. As increases, the multiplicity increases and, in addition, the peak of the distribution moves to larger values of . The moments of the distributions have been investigated up to the 4th order; the mean width skewness and kurtosis were extracted from each distribution by fitting a distorted Gaussian of the following form:
| (1) |
where over a range of units (for ) or units (for ) in around the mean. The equation is motivated by the expression used for the MLLA predictions of the spectra [14]. The smooth curves in Fig. 3 result from the fit of equation (1) to the data; they represent the data well.
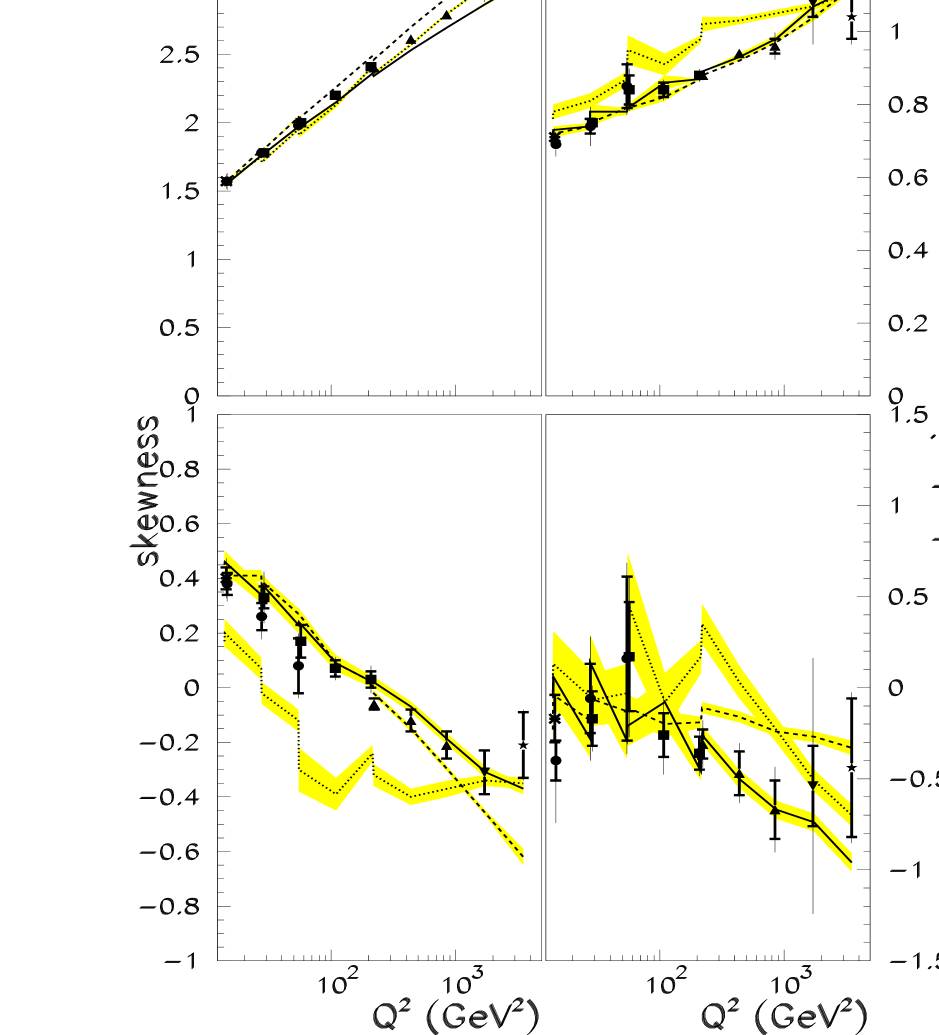
Figure 4 shows the moments of the spectra as a function of It is evident that the mean and width increase with increasing whereas the skewness and kurtosis decrease. Similar fits performed on data [49] show a reasonable agreement with our results, consistent with the universality of fragmentation for this distribution.
The data are compared to the MLLA predictions of Ref. [15], using a value of for different values of A comparison is also made with the predictions of Ref. [14] for the limiting spectrum (). The MLLA predictions of the limiting spectrum in Ref. [15] describe the mean well. However both of the MLLA calculations predict a negative skewness which tends towards zero with increasing in the case of the limiting spectra. This is contrary to the measurements. The qualitative description of the behaviour of the skewness with can be achieved for a truncated cascade (), but a consistent description of the mean, width, skewness and kurtosis cannot be achieved. A range of values was investigated and no single value of gave a consistent description of all the moments.
We conclude that the MLLA predictions, assuming LPHD, do not describe the data. We note however that a moments analysis has been performed [50], taking into account the limitations of the massless assumptions of the MLLA predictions, and yields good agreement between the limiting case of the MLLA [15] and data over a large energy range, A discussion of phase space effects on the distributions is given in ref. [51]. These phase space effects can resemble MLLA.
In Fig. 5 the evolution of the moments with (same DIS data as Fig. 4) are compared with the predictions of various Monte Carlo models. Both ARIADNE and LEPTO (with SCI) give a reasonable description of the data, while HERWIG fails to predict the observed variation. This is particularly noticeable for skewness and kurtosis. The discontinuities in the HERWIG prediction arise from a strong dependence in bins of overlapping Such an dependence is not observed in the data. It may be noted that, due to the choice of the maximum scale of the parton shower evolution, there are fewer gluons radiated in HERWIG than in the other generators; this could possibly account for the poor agreement of HERWIG with our measurement. All Monte Carlo programs have been compared using the default values of their parameters. The LEPTO model without SCI (not shown) describes the data better than does the default version.
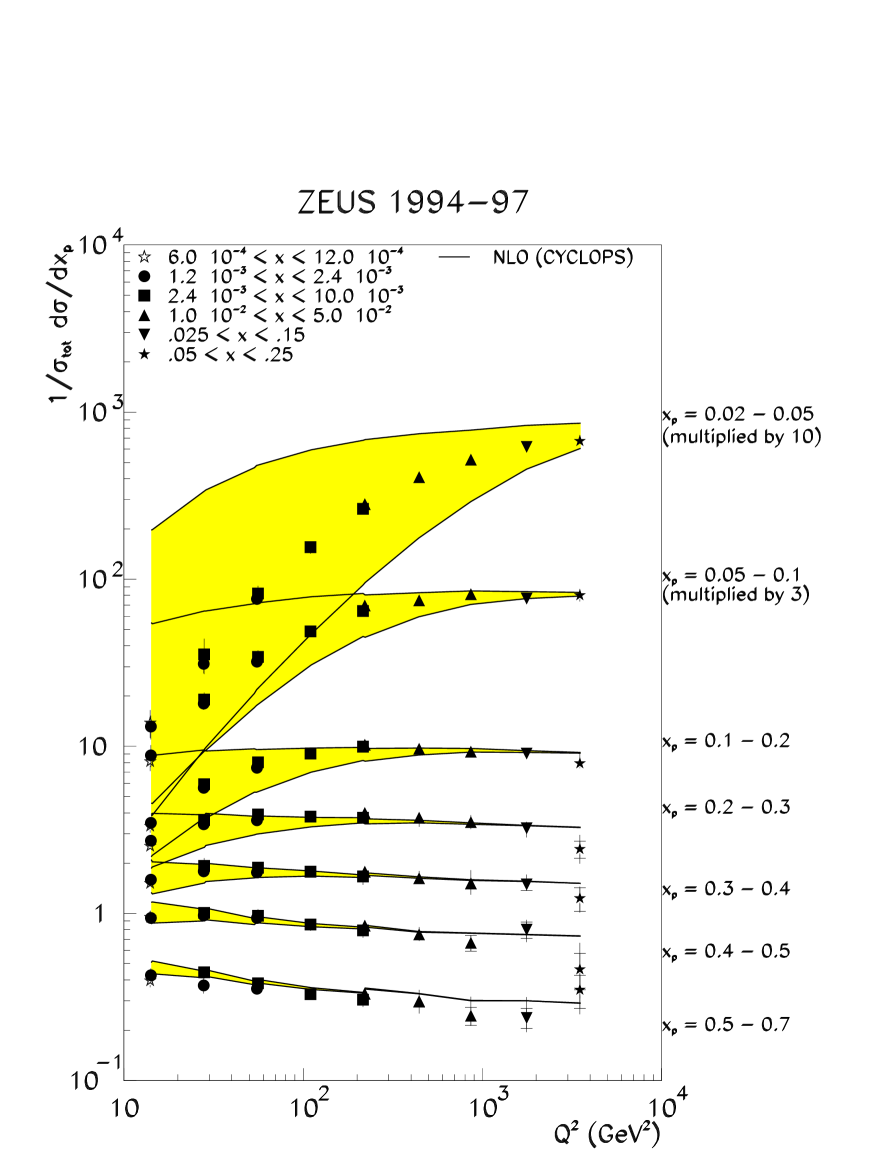
The inclusive charged particle distribution, , in the current fragmentation region of the Breit frame is shown in bins of and in Fig. 6. The fall-off as increases for (corresponding to the production of more particles with a smaller fractional momentum) is indicative of scaling violations in the fragmentation function. The distributions rise with for and are discussed in more detail below. The data are compared to data [52] (divided by two to account for the production of a pair) at For the higher values shown there is a good agreement between the measurements in the current region of the Breit frame in DIS and the results; this again supports the universality of fragmentation. The fall-off observed in the ZEUS data at low and low is greater than that observed in data at SPEAR [53]; this can be attributed to processes not present in (e.g. scattering off a sea quark and/or boson gluon fusion (BGF)) which depopulate the current region [8, 54, 62].
A kinematic correction has recently been suggested [55] to the NLO calculation [22] of the inclusive charged particle distribution which has the form:
| (2) |
where is an effective mass to account for the massless assumption used in the fragmentation functions. It is expected to lie in the range The data are compared to the CYCLOPS NLO QCD calculation incorporating this correction in Fig. 7. This calculation convolutes the fragmentation function of each type of parton with the cross sections for their production. It combines a full next-to-leading order matrix element with the parton densities (with and NLO fragmentation functions derived from fits to data [56]. The kinematic correction allows a more legitimate theoretical comparison to lower and than was possible in our earlier publication [3]. The bands represent the uncertainty in the predictions by taking the extreme cases of and These uncertainties are large at low and low becoming smaller as and increase. Within these theoretical uncertainties there is good agreement throughout the selected kinematic range. The kinematic correction describes the general trend of the data but it is not possible to achieve a good fit for over the whole and range. The uncertainties introduced by these additional processes restrict to high and high the kinematic range that may be used to extract from the observed scaling violations.
The distributions, are shown in Fig. 8 for The distributions show an exponential fall off at low although it is evident that a high- tail develops with increasing These high tails contribute at most 15% of the cross section. The distributions, from the 1995 data, in the first 8 bins of are shown in Fig. 9 as closed data points. The straight lines are exponential fits, to the low interval 0.2 - 1.0 GeV, where is the mass of the pion. They yield slopes of The values of show little dependence. For bin 8 the line extending out to higher () is a fit to the empirical power law formula [57] There are strong correlations between Consequently has been fixed at 0.75 GeV, a value consistent with the fit with all variables free and that used by H1 in the analysis of their photoproduction data [58]. With this the parameterisation fits the data well () and gives These tails are slightly higher if the cut is removed (open points in the figure). Particles with occur due to hard QCD processes, such as BGF and QCD Compton.
| bin no. | stat syst | |
|---|---|---|
| (GeV2) | ||
| 1 | 14.0 | 1.13 |
| 2 | 14.1 | 1.18 |
| 3 | 27.9 | 1.70 |
| 4 | 55.3 | 2.27 |
| 5 | 28.0 | 1.81 |
| 6 | 55.9 | 2.44 |
| 7 | 110. | 3.00 |
| 8 | 216. | 3.77 |
| 9 | 221. | 3.98 |
| 10 | 443. | 4.59 |
| 11 | 863. | 5.26 |
| 12 | 1766. | 6.01 |
| 13 | 3507. | 7.10 |
Figure 10 shows the mean charged multiplicity in the current fragmentation region. The results, for each of the bins, are listed in Table 2. The multiplicity increases by about a factor of six over the measured range. Also shown in Fig. 10 are results from annihilation experiments [59] (scaled down by a factor of 2) and results from fixed target DIS data [60] at similar to the ZEUS data but corresponding to an range about two orders of magnitude higher. For there is reasonable agreement between the results from data and ZEUS, again consistent with the universality of fragmentation. At lower the multiplicities measured by ZEUS are lower than those found in the data and the fixed target DIS data. Similar results have recently been observed by the NOMAD collaboration [61]. In this region there is a negligible contribution from charmed quarks so that the difference must originate from the depopulation of the current region due to the prevalence of boson-gluon fusion processes in this low region [13, 8, 62].
Figure 11 displays the same ZEUS data as in Fig. 10 but now compared to various Monte Carlo models. Both ARIADNE and HERWIG, with default settings, describe well the variation of the multiplicity with LEPTO with SCI, while describing the data at low simulates the evolution incorrectly which leads to an overestimation of the multiplicity at high This overestimation of the data by LEPTO can be partially rectified, as can be seen in Fig. 11(dash-dotted line), by removing SCI from the model.
7.2 Target fragmentation region
The distributions of charged particles in and transverse momentum, , in the target region of the Breit frame are studied as a function of and , in the range and GeV2. This analysis, which uses the 1995 data, is restricted to values of the scaled momenta so that similar phase space regions for the target and current can be compared. Thus the accepted part of the target region corresponds to the contributions T1 and T2 in Fig. 2 and is only a small part of the complete phase space, as depicted in Fig. 1. This is also the kinematic region of the target fragmentation that has a reasonable acceptance. The corrected data distributions with combined statistical and systematic errors are shown in Figs. 12-16.
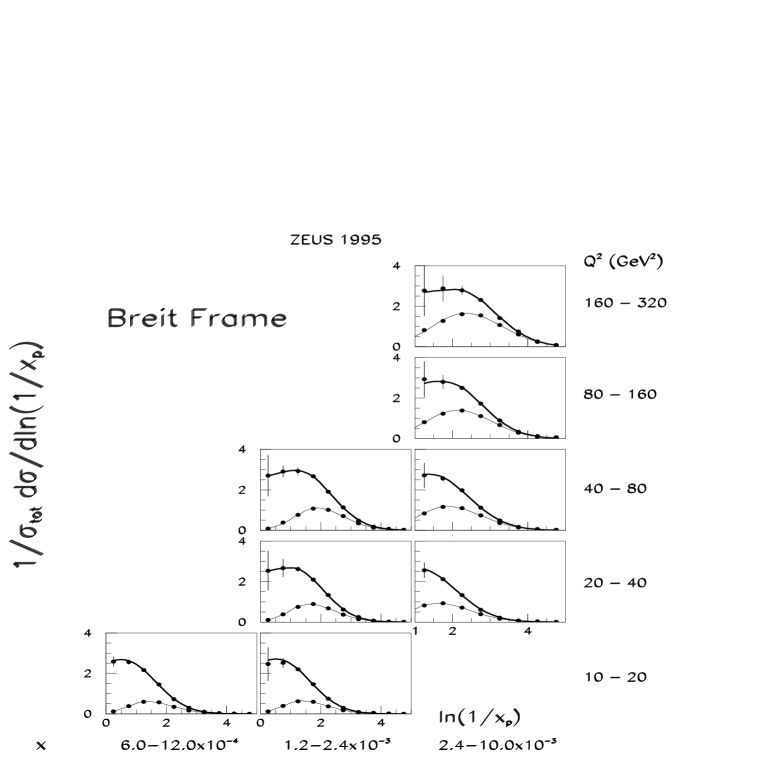
The distributions in are shown for both the target and current regions in Fig. 12. The fitted curves shown are two-piece normal distributions [63] to guide the eye. In contrast to the current region, the target region distribution does not fall to zero as tends to zero. Although the magnitude of the single particle density at the peak position of the current region distribution grows by a factor of about three over the range shown, the single particle density of the target distribution, at the value corresponding to the peak of the current distribution (contribution C is equivalent to contribution T1 in Fig. 2), depends less strongly on and increases by only about . In addition the distribution shows no significant dependence on when is kept constant. In the target region the peak position of the distribution increases more rapidly with than in the current region; this is consistent with the behaviour expected from cylindrical phase space. The approximate Gaussian distribution of the MLLA predictions peaking at [6] is not observed. We conclude that the target distributions are inconsistent with the MLLA predictions when used in conjunction with LPHD.
The distributions in the target fragmentation region are compared to Monte Carlo models in Fig. 13. The ARIADNE and Linked Dipole Chain (LDC) models describe the data well in the measured bins. The two Monte Carlo models based on DGLAP parton evolution techniques, LEPTO and HERWIG, fail to describe the data. The LEPTO Monte Carlo with SCI describes the data at low but the dependence on within the model is incorrect and discrepancies are observed at large The HERWIG Monte Carlo gives a poor description of the data in all bins. The LEPTO generator without SCI (not shown) gives a good description of the data.
| bin no. | (GeV2) | current | target |
|---|---|---|---|
| 1 | 1.13 0.010.05 | 4.95 0.010.2 | |
| 2 | 1.18 0.010.04 | 4.94 0.010.4 | |
| 3 | 1.70 0.010.07 | 6.11 0.020.6 | |
| 4 | 2.27 0.010.07 | 7.36 0.030.3 |
The mean multiplicity in the target region in the range shown in Table 3, is larger than in the current region, by about a factor of four in the lowest bins. The target region multiplicity increases with , but more slowly than that in the current region presumably due to the additional fragmentation terms in the target region shown in Fig. 2. Only the first four bins are studied as they have reasonable acceptance over the whole of Fig. 14 shows the ratio of the charged multiplicities in the target and the current regions as a function of The ratio falls as increases. Also shown are comparisons with Monte Carlo models; ARIADNE, LDC and LEPTO without SCI all describe the trend of the data. HERWIG, though reproducing the dependence, fails to predict the magnitude whilst LEPTO with SCI fails to describe the dependence of the ratio.
The distributions, , are shown in Fig. 15 and the same fits have been performed on these distributions as on the current region distributions of Fig. 9. The fit of the exponential, gives slopes of In a similar manner to the distributions in the current region, the values of exhibit little dependence, but the distributions develop a high- tail with increasing . The line plotted for the interval 160-320 is a fit to the power law formula for greater than 1.2 GeV. This fits the data well () with fixed at 0.75 GeV and These high tails contain at most 15% of the cross section. The values of in the current and target regions agree within errors and are smaller than that found for the ZEUS [57] and H1 [58] photoproduction data. This is consistent with what would be expected from the point-like nature of the exchanged photon in DIS.
To compare the general characteristics of the transverse momentum distributions in the target and current regions, the mean versus is shown in Fig. 16. The mean at large is higher in the current region than in the target region and shows a stronger dependence than the target region. In the current region the mean rises with and reaches a maximum as tends to In contrast, in the target region the mean tends to a constant value of about 0.6 GeV. Thus the target region distribution has the characteristics of -limited phase space with only a small dependence on . The mean vs distribution in the target region shows no significant dependence on when is kept constant.
Also shown in Fig. 16 are the Monte Carlo predictions of the ARIADNE and HERWIG models. The ARIADNE generator gives a good description of the data and is very similar to the predictions of LEPTO and LDC Monte Carlo models. The HERWIG generator gives a less satisfactory description of the data. The discrepancy in the target region can partially be explained by the lack of intrinsic transverse momentum of the incoming struck quark in the default parameters of HERWIG.
The apparent contradiction between the similarity of Figs. 9 and 15 and the difference between the mean in the current and target regions in Fig. 16 may be understood in terms of the correlation between and In the current region this correlation is strong with the high region corresponding to low multiplicity. As the high particles have a strong dependence, this is reflected in the dependence of the mean at high In contrast, in the target region the correlation between and is small. This results in a lower mean at large and a mean substantially independent of and as tends to 1.
8 Summary
Charged particle distributions have been studied in the Breit frame in DIS over a wide range of The distributions in scaled momentum, , and transverse momentum, , have been measured for the first time in the target region of the Breit frame for and For scaled momenta in the interval the mean target region charged track multiplicity is found to be larger than that measured in the current region; there is no significant -dependence at fixed
The transverse momentum distributions for both the current and target fragmentation regions exhibit similar properties. A tail at large develops as increases. The mean transverse momentum as a function of has a weaker dependence on in the target region than the current region. Whereas in the current region the mean increases approximately linearly with , the mean in the target region tends to a constant value with increasing consistent with cylindrical phase space.
The HERWIG model is unable to describe the dependence of the distributions in the target fragmentation region. In contrast the colour dipole model as implemented in the ARIADNE program, LEPTO generator without SCI and the LDC Monte Carlo, based on a reformulation of the CCFM evolution, all adequately describe the data.
In the current region, the results show clear evidence for scaling violations in scaled momenta as a function of and support the hypothesis of the coherent nature of QCD cascades. The data are well described by NLO calculations. The comparison of our results in the current region of the Breit frame with data at for shows good agreement. The moments of the spectra in the current region exhibit the same energy scale behaviour as those observed in data. The observed charged particle spectra are consistent with the universality of quark fragmentation in and DIS at high The moments cannot be described by the MLLA calculations together with LPHD.
The target region distribution shows a weaker dependence than the corresponding current region distribution. In particular, the magnitude of the single particle density of the target distribution, at the value corresponding to the peak of the current distribution, increases by about in contrast to a threefold increase for the current region in the -range considered here. The MLLA predictions for the target region, in conjunction with LPHD, fail to describe the data.
Acknowledgements
The strong support and encouragement of the DESY Directorate have been invaluable, and we are much indebted to the HERA machine group for their inventiveness and diligent efforts. The design, construction and installation of the ZEUS detector have been made possible by the ingenuity and dedicated efforts of many people from inside DESY and from the home institutes who are not listed as authors. Their contributions are acknowledged with great appreciation.
This paper was completed shortly after the tragic and untimely death of Prof. Dr. B. H. Wiik, Chairman of the DESY directorate. All members of the ZEUS collaboration wish to acknowledge the remarkable rôle which he played in the success of both the HERA project and of the ZEUS experiment. His inspired scientific leadership, his warm personality and his friendship will be sorely missed by us all.
References
- [1] R. P. Feynman, ‘Photon-Hadron Interactions’, Benjamin, N.Y. (1972).
- [2] ZEUS Collab., M. Derrick et al., Z. Phys. C67 (1995) 93.
- [3] ZEUS Collab., M. Derrick et al., Phys. Lett. B414 (1997) 428.
-
[4]
H1 Collab., S. Aid et al., Nucl. Phys. B445 (1995) 3;
H1 Collab., C. Adloff et al., Nucl. Phys. B504 (1997) 3. - [5] Yu. Dokshitzer et al., Rev. Mod. Phys. 60 (1988) 373.
- [6] A. V. Anisovich et al., Il Nuovo Cimento A106 (1993) 547.
- [7] K. Charchuła, J. Phys. G19 (1993) 1587.
- [8] K.H. Streng, T.F. Walsh and P.M. Zerwas, Z. Phys. C2 (1979) 237.
- [9] A. Bassetto et al., Nucl. Phys. B207 (1982) 189.
- [10] A. Mueller, Nucl. Phys. B213 (1983) 85.
- [11] B. R. Webber, Nucl. Phys. B238 (1984) 492.
- [12] Yu. Dokshitzer, V. Khoze, A. Mueller and S. Troyan, “Basics of Perturbative QCD”, Editions Frontières, Gif-sur-Yvette, France (1991).
- [13] V. Khoze and W. Ochs, Int. J. Mod. Phys. A12 (1997) 2949.
-
[14]
C. P. Fong and B. R. Webber, Phys. Lett. B229 (1989) 289;
C. P. Fong and B. R. Webber, Nucl. Phys. B355 (1991) 54. - [15] Yu. Dokshitzer, V. Khoze and S. Troyan, Int. J. Mod. Phys. A7 (1992) 1875.
- [16] Ya. Azimov et al., Z. Phys. C27 (1985) 65.
- [17] Yu. Dokshitzer et al., Sov. Phys. JETP 68 (1988) 1303.
-
[18]
V.N. Gribov and L.N. Lipatov,
Sov. J. Nucl. Phys. 15 (1972) 438 and 675;
Yu.L. Dokshitzer, Sov. Phys. JETP 46 (1977) 641;
G. Altarelli and G. Parisi, Nucl. Phys. B126 (1977) 298. -
[19]
G. Altarelli et al., Nucl. Phys. B160 (1979) 301;
P. Nason and B. R. Webber, Nucl. Phys. B421 (1994) 473. - [20] ALEPH Collab., D. Buskulic et al., Phys. Lett. B357 (1995) 487.
-
[21]
DELPHI Collab., P. Abreu et al., Phys. Lett. B311
(1993) 408;
DELPHI Collab., P. Abreu et al., Phys. Lett. B398 (1997) 194. -
[22]
D. Graudenz, CERN–TH/96–52;
D. Graudenz, CYCLOPS program and private communication. -
[23]
ZEUS Collab., M. Derrick et al.,
Phys. Lett. B293 (1992) 465;
ZEUS Collab., M. Derrick et al., Z. Phys. C63 (1994) 391. - [24] ZEUS Collab., The ZEUS Detector, Status Report 1993, DESY 1993.
-
[25]
N. Harnew et al., Nucl. Inst. Meth. A279 (1989) 290;
B. Foster et al., Nucl. Phys. B (Proc. Suppl.) 32 (1993) 181;
B. Foster et al., Nucl. Inst. Meth. A338 (1994) 254. -
[26]
M. Derrick et al., Nucl. Inst. Meth. A309 (1991) 77;
A. Andresen et al., Nucl. Inst. Meth. A309 (1991) 101;
A. Bernstein et al., Nucl. Inst. Meth. A336 (1993) 23. - [27] F. Jacquet and A. Blondel, Proceedings of the study for an ep facility for Europe, DESY 79/48 (1979) 391.
- [28] S. Bentvelsen, J. Engelen and P. Kooijman, Proceedings of the 1991 Workshop on Physics at HERA, DESY Vol. 1 (1992) 23.
- [29] ZEUS Collab., M. Derrick et al., Z. Phys. C72 (1996) 399.
- [30] R. Brun et al., GEANT3, CERN DD/EE/84-1 (1987).
- [31] K. Charchuła, G. Schuler and H. Spiesberger, Comp. Phys. Comm. 81 (1994) 381.
-
[32]
A. Kwiatkowski, H. Spiesberger and H.-J. Möhring,
Proceedings of the 1991 Workshop on Physics at HERA,
DESY Vol. 3 (1992) 1294;
A. Kwiatkowski, H. Spiesberger and H.-J. Möhring, Z. Phys. C50 (1991) 165. - [33] L.Lönnblad, ARIADNE version 4.03 program and manual, Comp. Phys. Comm. 71 (1992) 15.
- [34] B. Andersson et al., Phys. Rep. 97 (1983) 31.
-
[35]
T. Sjöstrand, Comp. Phys. Comm. 82 (1994) 74;
T. Sjöstrand, CERN-TH 7112/93 (revised August 1995). - [36] M. Gluck, E. Reya and A. Vogt, Z. Phys. C67 (1995) 433.
- [37] A. D. Martin, R. G. Roberts and W. J. Stirling, Phys. Rev. D50 (1994) 6734.
- [38] G. Marchesini et al., Comp. Phys. Comm. 67 (1992) 465.
- [39] G. Marchesini and B. R. Webber, Nucl. Phys. B310 (1988) 461.
- [40] ZEUS Collab., M. Derrick et al., Z. Phys. C65 (1995) 379.
- [41] H1 Collab., I. Abt et al., Nucl. Phys. B407 (1993) 515.
- [42] G. Ingelman, A. Edin and J. Rathsman, LEPTO 6.5_1, Comp. Phys. Comm. 101 (1997) 108.
- [43] A. Edin, G. Ingelman and J. Rathsman, Phys. Lett. B366 (1996) 371.
-
[44]
B. Andersson, G. Gustafson and J. Samuelsson,
Nucl. Phys. B463 (1996) 217;
B. Andersson, G. Gustafson, H. Kharraziha and J. Samuelsson, Z. Phys. C71 (1996) 613;
H. Kharraziha and L. Lönnblad, JHEP 9803 (1998) 006. - [45] B. Andersson, G. Gustafson and J. Jannelson, Nucl. Phys. B463 (1996) 217.
-
[46]
M. Ciafaloni, Nucl. Phys. B296 (1988) 49;
S. Catani, F. Fiorani and G. Marchesini, Phys. Lett. B234 (1990) 339 and Nucl. Phys. B336 (1990) 18;
G. Marchesini, Nucl. Phys. B445 (1995) 49. -
[47]
E.A. Kuraev, L.N. Lipatov and V.S. Fadin,
Sov. Phys. JETP 45 (1977) 199;
Ya.Ya. Balitzki and L.N. Lipatov, Sov. J. Nucl. Phys. 28 (1978) 822. - [48] ZEUS Collab., M. Derrick et al., Z. Phys. C59 (1993) 231.
-
[49]
OPAL Collab., M.Akrway et al., Phys. Lett. B247 (1990) 617;
TASSO Collab., W. Braunschweig et al., Z. Phys. C47 (1990) 187;
TASSO Collab., W. Braunschweig et al., Z. Phys. C22 (1984) 307;
TOPAZ Collab., R. Itoh et al., Phys. Lett. B345 (1995) 335. - [50] S. Lupia and W. Ochs, Eur. Phys. J. C2 (1998) 307.
-
[51]
E.R. Boudinov, P.V. Chliapnikov and V.A. Uvarov,
Phys. Lett. B309 (1993) 210;
P.V. Chliapnikov and V.A. Uvarov, Phys.Lett.B431 (1998) 430. -
[52]
TASSO Collab., W. Braunschweig et al., Z. Phys. C47
(1990) 187 ;
MARK II Collab., A. Petersen et al., Phys. Rev. D37 (1988) 1;
AMY Collab., Y. K. Li et al., Phys. Rev. D41 (1990) 2675;
DELPHI Collab., P. Abreu et al., Phys. Lett. B311, (1993) 408. - [53] MARK II Collab., J. F. Patrick et al., Phys. Rev. Lett. 49 (1982) 1232.
- [54] ZEUS Collab., M. Derrick et al., Phys. Lett. B338 (1994) 483.
-
[55]
Yu. Dokshitzer and B. R. Webber, discussion at
Third UK Phenomenology Workshop on HERA Physics, Durham, UK,
20-25 Sept 1998.
P. Dixon et al., ‘Fragmentation Function Scaling Violations in the Breit Frame’, to appear in J. Phys. G. - [56] J. Binnewies et al., Z. Phys. C65 (1995) 471.
- [57] ZEUS Collab., M. Derrick et al., Z. Phys. C67 (1995) 227.
- [58] H1 Collab., C. Adloff et al., DESY 98-148, submitted to Eur. Phys. J.
-
[59]
TASSO Collab., W. Braunschweig et al., Z. Phys. C45 (1989) 193;
PLUTO Collab., Ch. Berger et al., Phys. Lett. B95 (1980) 313;
OPAL Collab., P.D. Acton et al., Z. Phys. C53 (1992) 539;
HRS Collab., M. Derrick et al., Phys. Rev. D34 (1986) 3304;
MARK1 Collab., J.L. Siegrist et al., Phys. Rev. D26 (1986) 969. - [60] M. Derrick et al., Phys. Lett. B91 (1986) 470.
- [61] NOMAD Collab., J. Altegoer et al., Phys. Lett. B445 (1999) 439.
- [62] P. Edén, LU TP 98-22, hep-ph/9811229.
-
[63]
Bank of England Quarterly Bulletin , February 1998, and
references therein. The two piece normal distribution is
where are the mode and r.m.s. of the distribution respectively; is in the range and controls the skewness of the distribution. If then the sign in front of is positive, otherwise it is negative.