Observation of the decay
Abstract
We have observed 1 event consistent with the signature expected of the rare decay of a positive kaon to a positive pion and a neutrino anti-neutrino pair. In the examined momentum region of 211 to 230 MeV/c in the center of mass of the kaon we estimated the backgrounds to be about events. From this observation we estimate the branching ratio to be . In this presentation I will explain the experiment, and the analysis techniques. I will also discuss the expected improvements in the near future from the analysis of new data sets.
I Introduction
The decay has attracted interest due to its sensitivity to , the coupling of top to down quarks in the Cabibbo-Kobayashi-Maskawa quark mixing matrix. Theoretical uncertainty in the branching ratio is minimal because the decay rate depends on short distance physics and because the hadronic matrix element can be extracted from the well-measured decay . After next-to-leading-logarithmic analysis of QCD effects[2], calculation of isospin breaking, phase space differences and other small corrections to the hadronic matrix element [3], and calculation of two-electroweak-loop effects [4], the intrinsic uncertainty is only about 7%[5]. Based on current knowledge of Standard Model (SM) parameters, the branching ratio is expected to be in the range [6]. Long-distance contributions to the branching ratio (i.e. meson, photon exchange) appear to be negligible ()[7, 8]. Since is a flavor changing neutral current process that is highly suppressed in the SM, it also serves as a hunting ground for non-SM physics. The signature ‘nothing’[7, 9, 10] includes with non-SM intermediate states (such as virtual supersymmetric particles), (a lepton flavor violating final state), where and are not neutrinos, and where is a single, non-interacting particle. Initial results from the E787[1] experiment[11] at the Alternating Gradient Synchrotron (AGS) of Brookhaven National Laboratory gave 90% confidence level (CL) upper limits () and () for a massless [12]. Here report on the analysis of a new data sample with 2.4 times greater sensitivity, taken in 1995 using an upgraded beam and detector.
II The experiment
The signature for is a decay to a of momentum MeV/ and no other observable product. Definitive observation of this signal requires suppression of all backgrounds to well below the sensitivity for the signal and reliable estimates of the residual background levels. Major background sources include the copious two-body decays () with a 64% branching ratio and MeV/ and () with a 21% branching ratio and MeV/. The only other important background sources are scattering of pions in the beam and charge exchange (CEX) reactions resulting in decays , where or . To suppress the backgrounds, we used the redundant kinematic and particle identification measurements and efficient elimination of events with additional particles.
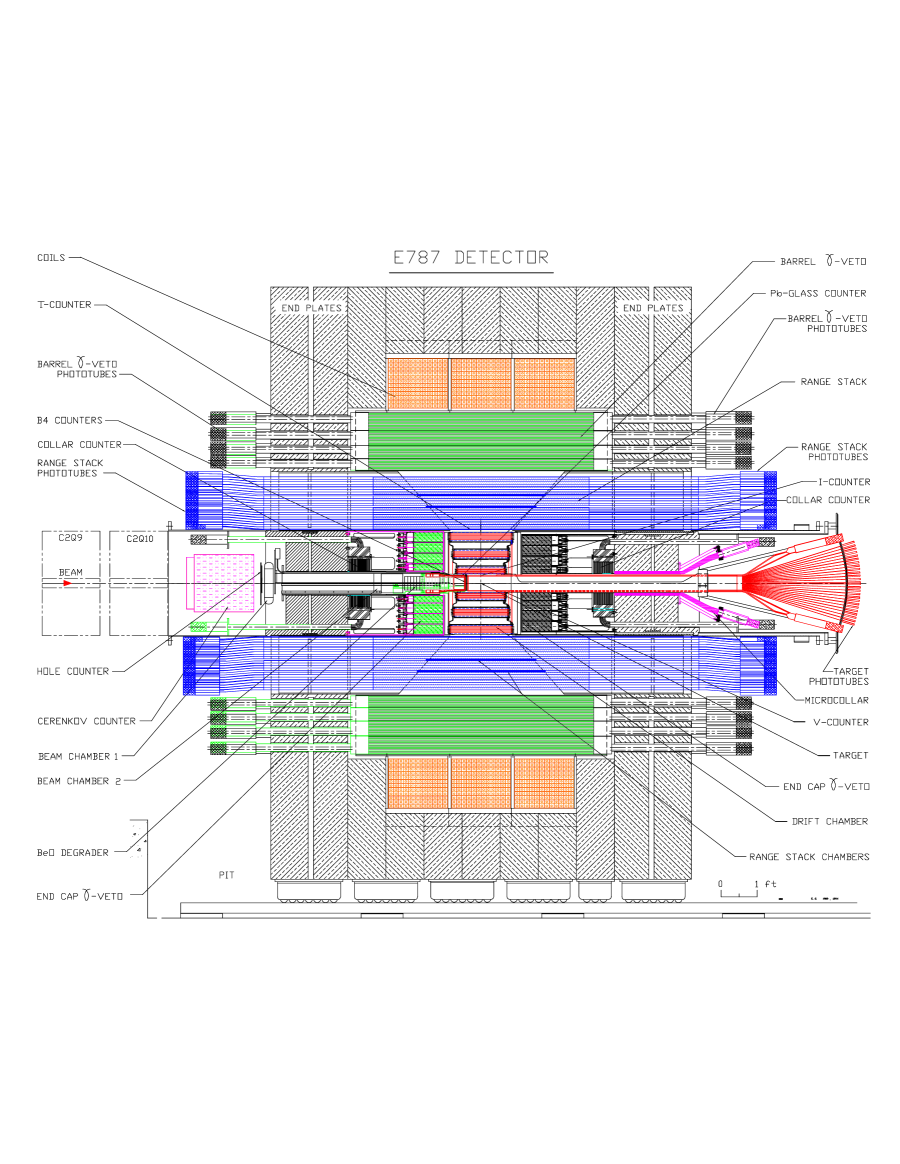
Kaons of 790 MeV/ were delivered to the experiment at a rate of per 1.6-s spill of the AGS. The kaon beam line (LESB3) incorporated two stages of particle separation resulting in a pion contamination of about 25%. The kaons were detected and identified by Čerenkov, tracking, and energy loss () counters. About 20% of the kaons slowed through a degrader to reach a stopping target of 5-mm-square plastic scintillating fibers read out by 500-MHz CCD transient digitizers[13]. Measurements of the momentum (), range (, in equivalent cm of scintillator) and kinetic energy () of charged decay products were made using the target, a central drift chamber[14], and a cylindrical range stack with 21 layers of plastic scintillator and two layers of straw tube tracking chambers. Pions were distinguished from muons by kinematics and by observing the decay sequence in the range stack using 500-MHz flash-ADC transient digitizers (TD)[15]. Photons were detected in a -sr calorimeter consisting of a 14-radiation-length-thick barrel detector made of lead/scintillator and 13.5 radiation lengths of undoped CsI crystal detectors (also read out using CCD digitizers) covering each end[16]. In addition, photon detectors were installed in the extreme forward and backward regions, including a Pb-glass Čerenkov detector just upstream of the target. A 1-T solenoidal magnetic field was imposed on the detector for the momentum measurements.
III The analysis
In the search for , we required an identified to stop in the target followed, after a delay of at least 2 ns, by a single charged-particle track that was unaccompanied by any other decay product or beam particle. This particle must have been identified as a with , and between the and peaks. A multilevel trigger selected events with these characteristics for recording, and off-line analysis further refined the suppression of backgrounds. To elude rejection, and events would have to have been reconstructed incorrectly in , and . In addition, any event with a muon would have to have had its track misidentified as a pion — the most effective weapon here was the measurement of the decay sequence which provided a suppression factor . Events with photons, such as decays, were efficiently eliminated by exploiting the full calorimeter coverage. The inefficiency for detecting events with s was for a photon energy threshold of about 1 MeV. A scattered beam pion could have survived the analysis only by misidentification as a and if the track were mismeasured as delayed, or if the track were missed entirely by the beam counters after a valid stopped in the target. CEX background events could have survived only if the were produced at low enough energy to remain in the target for at least 2 ns, if there were no visible gap between the beam track and the observed track, and if the additional charged lepton went unobserved.
The data were analyzed with the goal of reducing the total expected background to significantly less than one event in the final sample. In developing the required rejection criteria (cuts), we took advantage of redundant independent constraints available on each source of background to establish two independent sets of cuts. One set of cuts was relaxed or inverted to enhance the background (by up to three orders of magnitude) so that the other group could be evaluated to determine its power for rejection. For example, (including ) was studied by separately measuring the rejections of the TD particle identification and kinematic cuts. The background from was evaluated by separately measuring the rejections of the photon detection system and kinematic cuts. The background from beam pion scattering was evaluated by separately measuring the rejections of the beam counter and timing cuts. Measurements of charge exchange in the target were performed, which, used as input to Monte Carlo studies, allowed the background to be determined. Small correlations in the separate groups of cuts were investigated for each background source and corrected for if they existed.
The background levels anticipated with the final analysis cuts were , , and . In total, background events were expected in the signal region. This represents an order of magnitude improvement in background suppression relative to ref.[12], mainly because of improved kinematic and timing resolutions. Further confidence in the background estimates and in the measurements of the background distributions near the signal region was provided by extending the method described above to estimate the number of events expected to appear when the cuts were relaxed in predetermined ways so as to allow orders of magnitude higher levels of all background types. Confronting these estimates with measurements from the full data, where the two sets of cuts for each background type were relaxed simultaneously, tested the independence of the two sets of cuts. At approximately the level we observed 2 events where were expected, and at the level we found 15 events where were expected. Under detailed examination, the events admitted by the relaxed cuts were consistent with being due to the known background sources. Within the final signal region, we still had additional background rejection capability. Therefore, prior to looking in the signal region, we established several sets of ever-tighter criteria which were designed to be used only to interpret any events that fell into the signal region.
Figure 2(a) shows vs. for the events surviving all other analysis cuts. Only events with measured momentum in the accepted region MeV/ are plotted. The rectangular box indicates the signal region specified as range cm of scintillator (corresponding to MeV/) and energy MeV ( MeV/) which encloses the upper 16.2% of the phase space. One event was observed in the signal region. The residual events below the signal region clustered at MeV were due to decays where both photons had been missed. The number of these events is consistent with estimates of the photon detection inefficiency.
(a) Range () vs. energy () distribution for the data set with the final cuts applied. The box enclosing the signal region contains a single candidate event. (b) The Monte Carlo simulation of with the same cuts applied.

A reconstruction of the candidate event is shown in Fig. 3. Measured parameters of the event include MeV/, MeV, cm, and decay times , and of ns, ns and ns, respectively. No significant energy was observed elsewhere in the detector in coincidence with the pion. The event also satisfied the most demanding criteria designed in advance for candidate evaluation. This put it in a region with an additional background rejection factor of 10. In this region, events would be expected from known background sources while 55% of the final acceptance for would be retained[18]. Since the explanation of the observed event as background is highly improbable, we conclude that we have likely observed a kaon decay .
To calculate the branching ratio indicated by this observation, we used the final acceptance for , , and the total exposure of kaons entering the target. Where possible, we employed calibration data taken simultaneously with the physics data for the acceptance calculation. We relied on Monte Carlo studies only for the solid angle acceptance factor, the phase space factor and the losses from nuclear interactions and decays in flight. The details of these calculations are in various Ph.D. theses [17]. If the observed event is due to , the branching ratio is .
The likelihood of the candidate event being due to () is small. Based on the measured resolutions, the CL for consistency with this hypothesis is 0.8%. Thus, using the acceptance for , , and no observed events in the region MeV/, a 90% CL upper limit of was derived.
The observation of an event with the signature of is consistent with the expectations of the SM which are centered at about . Using the result for () and the relations given in ref. [2], lies in the range . E787 has recently collected additional data and the experiment is continuing.
IV Future expectations
The E787 experiment has had four runs during 1995–98. The typical conditions for the 1995 run were protons per AGS spill, 5.3 MHz of incident of 790 MeV/c, a stopped kaon rate of 1.2 M/spill, a deadtime of 25%, and an acceptance of 0.16%. Over the course of the years we steadily increased the duty factor of the AGS from 41 to 52 percent. We also reduced the momentum of the kaons to 710 MeV/c to increase the fraction that stop in the detector; this lowered the accidental rates in the detector. The expected sensitivity from the 1995–98 runs is 4.4 that of the 1995 data alone without considering potential improvements in the analysis. A preliminary re-analysis of the E787 1995 data with improvements in the analysis software have demonstrated a background rejection that is 2.3 larger. This background level (roughly equivalent to a branching ratio of ) is sufficient for future measurements of the branching ratio. Results of the analysis of the larger data set are expected within a few months.
A new experiment, E949, recently received approval and is expected to run at the AGS starting in the year 2001. This experiment is designed to reach a sensitivity of (8–14), an order of magnitude below the Standard Model prediction and to determine to better than 27%. It is built around the existing E787 detector to take advantage of the extensive analysis of that detector, allowing a reliable projection of the new experiment to the required sensitivity with a high level of confidence.
The E949 detector will have significantly upgraded photon veto systems, data acquisition and trigger compared to the E787 experiment. The photon veto upgrade includes a barrel veto liner that will replace the outer layers of the range stack. It is 2.3 thick and will add substantially to the thin region at 45∘. Additional photon veto upgrades will be installed along the beam direction. The most important data acquisition upgrade will be to instrument the range stack with TDC’s to extend the search time for the Michel electron () and to allow the transient digitizer range to be shortened. The shortening of the transient digitizer range should allow a reduction of deadtime by 30–50%. Trigger upgrades should reduce the deadtime further and reduce the acceptance loss due to the online photon veto. Compared to the E787 running conditions in 1995 an improvement of 50% has already been realized. Additional improvements in these areas and in offline software are expected to gain another 90%. Additional sensitivity gains can be realized by including the region of phase space below the Kπ2 peak and by reoptimizing the analysis algorithms to run at higher rates. Each of these should provide a factor of 2 more sensitivity. The total gain in sensitivity per hour will be 6–13 times over the E787 published result on the 1995 data set.
V Conclusion
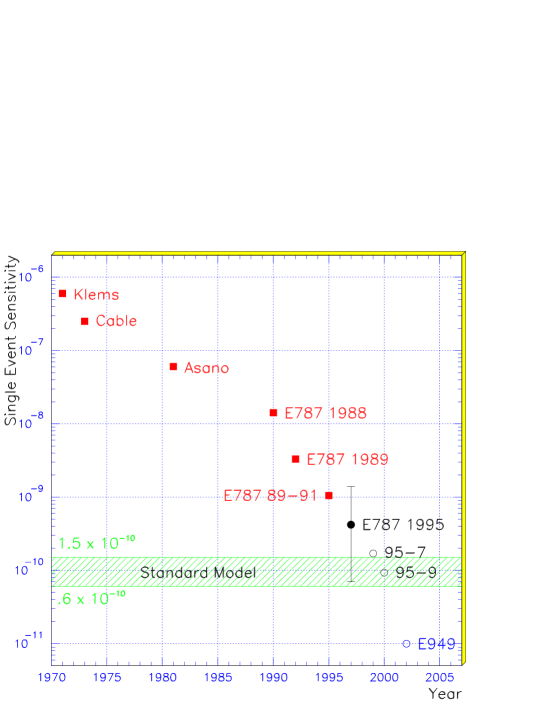
The prospects for further improvement in the determination of B() are bright. The first observation of this rare and interesting decay has recently been published. The data on hand, or soon to be available, from the E787 experiment, should provide almost an order of magnitude more sensitivity. The recently approved experiment E949 should reach at least a factor of five further than E787 and make a very interesting measurement of . There is also a proposal, CKM, at the FNAL Main Injector, to push even further, to by looking for the decay in flight. A plot showing the progress from past, current and approved experiments is shown in Figure 4. The search for this decay, with its very clean and well understood prediction within the standard model, could soon provide either a crucial test of the standard model or a precise measurement of .
REFERENCES
- [1] The E787 collaboration: S. Adler, M.S. Atiya, I-H. Chiang, M.V. Diwan, J.S. Frank, J.S. Haggerty, S.H. Kettell, T.F. Kycia, K.K. Li, L.S. Littenberg, C. Ng, A. Sambamurti, A. Stevens, R.C. Strand,C. Witzig, T.K. Komatsubara, M. Kuriki, N. Muramatsu, S. Sugimoto, T. Inagaki, S. Kabe, M. Kobayashi, Y. Kuno, T. Sato, T. Shinkawa, Y. Yoshimura, Y. Kishi, T. Nakano, M. Ardebili, A.O. Bazarko, M.R. Convery, M.M. Ito, D.R. Marlow, R.A. McPherson, P.D. Meyers, F.C. Shoemaker, A.J.S. Smith, J.R. Stone, M. Aoki, E.W. Blackmore, P.C. Bergbusch, D.A. Bryman, A. Konaka, J.A. Macdonald, J. Mildenberger, T. Numao, P. Padley, J.-M. Poutissou, R. Poutissou, G. Redlinger, J. Roy, A.S. Turcot, P. Kitching and R. Soluk
- [2] G. Buchalla and A.J. Buras, Nucl. Phys. B412, 106 (1994).
- [3] W.J. Marciano and Z. Parsa, Phys. Rev. D 53, R1 (1996).
- [4] G. Buchalla and A.J. Buras, SLAC-PUB-7575, TUM-HEP-280/97, hep-ph/9707243.
- [5] A.J. Buras and R. Fleischer, TUM-HEP-275-97, hep-ph/9704376, Heavy Flavours II, World Scientific, eds. A.J.Buras and M. Linder (1997), to be published.
- [6] G. Buchalla, A.J. Buras and M.E. Lautenbacher, Rev. Mod. Phys. 68, 1125 (1996).
- [7] J.S. Hagelin and L.S. Littenberg, Prog. Part. Nucl. Phys. 23, 1 (1989).
- [8] D. Rein and L.M. Sehgal, Phys. Rev. D 39, 3325 (1989); M. Lu and M.B. Wise, Phys. Lett. B324, 461 (1994); C.Q. Geng, I.J. Hsu, and Y.C. Lin, Phys. Lett. B355, 569 (1995); S. Faijfer, Nuovo. Cim. 110A, 397 (1997).
- [9] Y. Grossman and Y. Nir, Phys. Lett. B398, 163 (1997); G. Couture and H. Knig, Z. Phys. C69, 167 (1996); I.I. Bigi and F. Gabbiani, Nucl. Phys. B367, 3 (1991); K. Agashe and M. Graesser, Phys. Rev. D 54, 4445 (1996); M. Leurer, Phys. Rev. Lett. 71, 1324 (1993); S. Davidson, D. Bailey, and B. Campbell, Z. Phys. C61, 613 (1994); S. Bertolini and A. Santamaria, Nucl. Phys. B315, 558 (1989).
- [10] F. Wilczek, Phys. Rev. Lett. 49, 1549 (1982).
- [11] M.S. Atiya et al., Nucl. Instr. Meth. A321, 129 (1992).
- [12] S. Adler et al., Phys. Rev. Lett. 76, 1421 (1996).
- [13] D.A. Bryman et al., Nucl. Instr. Meth. (1997), to be published.
- [14] E.W. Blackmore et al., Nucl. Instr. Meth. (1997), to be published.
- [15] M. Atiya et al., Nucl. Instr. Meth. A279, 180 (1989).
- [16] I-H. Chiang et al., IEEE Trans. Nucl. Sci. NS-42, 394 (1995).
- [17] J. R. Stone, Princeton University Ph. D. thesis, May 1998.
- [18] The background estimates in the region with the tightest cuts were , , and .