An electromagnetic shashlik calorimeter with longitudinal segmentation
Abstract
A novel technique for longitudinal segmentation of shashlik calorimeters has been tested in the CERN West Area beam facility. A 25 tower very fine samplings e.m. calorimeter has been built with vacuum photodiodes inserted in the first 8 radiation lengths to sample the initial development of the shower. Results concerning energy resolution, impact point reconstruction and separation are reported.
, , , , , , , , , , , , , , .
1 Introduction
In recent years the “shashlik” technology has been extensively studied to assess its performance at , and accelerator experiments CMS ; heraB ; LHCB ; STIC . Shashlik calorimeters are sampling calorimeters in which scintillation light is read-out via wavelength shifting (WLS) fibers running perpendicularly to the converter/absorber plates fessler ; atojan . This technique offers the combination of an easy assembly, good hermeticity and fast time response. In many applications it also represents a cheap solution compared to crystals or cryogenic liquid calorimeters.
Shashlik calorimeters are, in particular, considered to be good candidates for barrel electromagnetic calorimetry at future linear colliders TESLA . In this context, the physics requirements impose , at least three longitudinal samplings, transversal segmentation of the order of ( cm2) and the possibility of performing the read-out in a 3 T magnetic field. The present shashlik technology can satisfy these requirements, except for the optimization of longitudinal segmentation which still needs development. The solution proposed in this paper consists of thin vacuum photodiodes inserted between adjacent towers in the front part of the calorimeter. They measure the energy deposited in the initial shower development that allows for longitudinal sampling and separation. A prototype detector was exposed to a beam with the aim of measuring the sampling capability and demonstrating that the insertion of diodes neither deteriorates critically the energy response nor produces significant cracks in the tower structure.
2 The prototype detector
The tested prototype had 25 Pb/scintillator towers, assembled in a matrix. Each tower consisted of 140 layers of 1 mm thick lead and 1 mm thick scintillator tiles, resulting in a total depth of . The sampling was the finest ever used with the shashlik technique. The transversal dimension of each tower was cm2. In the first the tiles had a smaller transverse dimension to provide room for the housing of the diodes. Plastic scintillator consisting of polystyrene doped with 1.5% paraterphenyl and 0.05% POPOP was used. Optical insulation between the towers was provided by white Tyvek paper.
As it is custumary in shashlik technique, the blue light produced in the scintillator was carried to the photodetector at the back of the calorimeter by means of plastic optical fibers doped with green WLS. The 1 mm diameter fibers crossed the tiles in holes drilled in the lead and scintillator plates and they were uniformly distributed with a density of 1 fiber/cm2. In the scintillator tiles the holes were 2 mm larger (4 mm in the lead) than the fiber diameter. The light transmission between the plastic scintillator and the fibers was in air. All the fibers from the same tower were bundled together at the back and connected to photodetectors. Two types of fibers were tested: Bicron BCF20 fibers and Kuraray Y11. In both cases, the emission peak was at about 500 nm. Light collection was increased by aluminizing the fiber end opposite to the photodetector by sputtering.
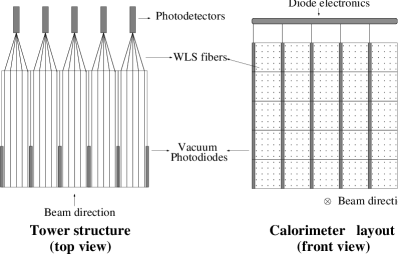
The light from the fibers was viewed after a 5 mm air gap by 1“ Hamamatsu R2149-03 phototetrodes. Each tetrode was placed inside an aluminium housing, containing a charge sensitive JFET preamplifier and a high voltage divider. The differential output signals were shaped with a shaping time of 1.500 s and digitized. Four towers were read-out with Hamamatsu Avalanche Photodiodes instead of tetrodes. A plexiglass light guide was used to match the smaller APD sensitive area to the fiber bundle. Preamplifiers and voltage dividers were housed in the same mechanical structure as the tetrodes.
Two types of vacuum photodiodes, viewed with a bialcali photocathode, were produced by EMI 111 EMI vacuum photodiode prototype D437. (Hamamatsu 222 Hamamatsu vacuum photodiode prototype SPTXC0046. ) with a rectangular (squared) front surface of cm2 ( cm2) and a thickness of 5 mm. The diodes were installed in the first part of the towers in order to sample the energy deposited in the first 8 . They were in optical contact with the lateral side of the scintillator tiles and the light emitted in first part of the detector was therefore read-out twice since the photons crossing the lateral scintillator surface were collected by the diode while those reaching the fibers, either directly or after reflections, were seen by the tetrodes. Due to the direct coupling, the light collection efficiency of the diodes was much larger than that of the tetrodes/APD’s and this compensated for the absence of gain in the diodes.
Most of the cells were equipped with EMI vacuum photodiodes. One diode prototype from Hamamatsu, sampling only 4 , was successfully tested during the last part of the data taking. Technical characteristics of these devices are listed in table 1. The Hamamatsu prototype dimensions are such that it is possible to house two diodes in the same tower in order to obtain three longitudinal samplings. For all diodes, the same front-end electronics and read-out chain as for the tetrodes were used. The read-out electronics was positioned above the tower stacks (cfr.fig.1).
| EMI | Hamamatsu | |
|---|---|---|
| Sensitive area | 28.9 cm2 | 10.9 cm2 |
| Diode thickness | 5.0 mm | 5.1 mm |
| Working bias | -10 V | -20 V |
| Capacitance | 250 pF | 17 pF |
| Energy equivalent e.noise | 1200 MeV | 900 MeV |
3 Testbeam setup
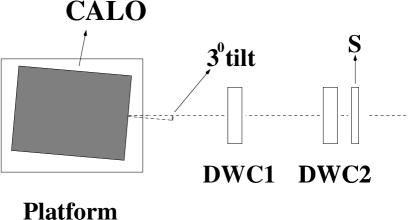
The prototype was tested at the X5 beam in the CERN West Area. Electrons ranging from 5 to 75 GeV and pions of 20, 30 and 50 GeV were used. The prototype (CALO in fig.2) was installed on a moving platform whose position was controlled at the level of m. In order to avoid particles from channeling through fibers or diodes, the calorimeter was tilted by 3 degrees in the horizontal plane with respect to the beam direction. The absolute impact position of the incoming particle was measured by means of two Delay Wire Chambers (DWC1 and DWC2) with a 2 mm wire pitch and a spatial resolution of 200 m, positioned at 0.5 and 1 m from the calorimeter frontface. External trigger was provided by a layer of scintillators installed near DWC2.
A calibration of each tower was carried out by exposing the calorimeter to a 50 GeV electron beam at the beginning of each of the two data taking periods. The diode signals were calibrated with 50 GeV electrons as well. Pedestal runs were taken periodically to monitor the noise of the electronic amplification chain.
4 Results
4.1 Energy resolution
The energy response is expected to depend on the impact point since the nearer the fiber the higher the light collection efficiency. The high fiber density was used in order to reduce the non uniformity in light response to a level of a few percent. This effect was however not achieved with BCF20 fibers, due to a small scintillating component deteriorating the energy resolution. KY11 fibers, on the other hand, had a non uniformity at the level of .

Fig.3 shows the energy response for 50 GeV electrons in
towers equipped with Kuraray fibers and tetrode redout.
The energy resolution achieved with KY11 fibers
and tetrode read-out as function of the beam energy
is shown in fig.4 and can be parameterized as333Alternatively, by adding the constant term in quadrature:
| (1) |
where is expressed in GeV. The last term corresponds to the electronic noise contribution and was measured from pedestal runs. A Geant Monte Carlo simulation of the shower development in a 1-mm-lead/1-mm-scintillator sampling gave a smaller value () for the first term of the energy resolution. Therefore the dominant contribution to the measured resolution was attributed to the photoelectron statistics.

The use of phototetrodes is not ideal for barrel calorimetry at colliders. Tetrodes have a rather long longitudinal dimension and must be kept at a small angle with respect to the magnetic field in order to operate with a maximum gain. The installation of Avalanche Photodiodes has been proposed by the CMS collaboration prop_CMS as an alternative solution. Given their very good quantum efficiency (), APD should also ensure a better energy resolution when the photoelectron statistics contribution dominates. Four APD’s were installed in the prototype, as described in section 2, but unfortunately no towers were equipped with APD and KY11 fibers. In fig.5 the energy response for 50 GeV electrons impinging on a tower equipped with APD is shown. The high energy tail coming from events reconstructed near the BCF20 fibers is evident.

4.2 Linearity
Fig. 6 shows the reconstructed energy versus the nominal electron beam energy when the beam was centered in towers equipped with KY11 fibers. No significant deviations from linearity were observed up to 75 GeV which was the highest energy measured.

4.3 Spatial resolution
A position scan along the towers was done using 50 GeV electrons to establish the precision in the impact point reconstruction. The shower position reconstruction was based on center of gravity method corrected for the detector granularity with the algorithm suggested by akopdjanov . The barycenter
| (2) |
( is the half-width of the tower and the energy deposited in tower ), was modified according to
| (3) |
where is a parameter describing the transversal shower profile and . Since the shower profile was not described by a single exponential, a two steps procedure was followed: in the first step was determined with cm and in the second one the value of was recomputed in the interval according to . was linear in most of the impact point range, showing non-linearities only near the diode housing as depicted in fig.7. The non-linear behaviour around the diode was corrected for by using the diode signal itself. In particular, in the range of close to the distortion region, a diode-based estimator was introduced so that
| (4) |
where
| (5) |
here is the diode energy in the tower with maximum signal, represents the energy (seen by tetrodes/APD’s) in the tower closest to the reconstructed impact position and the parameters and were determined with 50 GeV electrons and are cm and cm.

The position resolution of the prototype at the cell center was 1.6 mm with 50 GeV electrons and had the following energy dependence:
| (6) |
4.4 Energy leakage to the diode
The dead zone between two adjacent towers due to the diode affected only a limited portion of the calorimeter and was always followed by a sufficiently long () part of active detector. Therefore no complete cracks existed in the calorimeter. Nevertheless an energy loss for showers developing near the diode was visible. It was easily corrected for by using the reconstructed shower impact point. The energy response as a function of the distance of the reconstructed position from the two tower border was parametrized as
| (7) |
where , cm for and cm for . Fig.8 shows the energy response, before and after the correction, as function of the reconstructed position for 50 GeV electrons. Once the correction was introduced, the remaining non uniformity in the energy response was due to the difference in light collection near fibers.

4.5 Diode response
The EMI and the Hamamatsu diode responses to 50 GeV electrons and pions are shown in Fig. 9. The widths of both distributions were dominated by the fluctuations in the shower development. Due to the different sampling seen by the two detectors, the light signal was larger for the EMI and the fluctuations were more important in the case of the Hamamatsu prototype. On the other hand the smaller capacitance of the latter ensured a much lower electronic noise giving a comparable energy equivalent contribution as indicated in table 1.

Since the showers were not contained in the part of the calorimeter read-out by diodes and the longitudinal shower development depends on the energy, the response at different electron energies was not linear as shown in Fig. 10.

4.6 separation
Separation of electrons from pions was performed using discriminating variables based either on purely calorimetric data or involving also external information like the beam energy, known from the settings of main deflection magnet, which would be replaced by the momentum estimation from the tracking in a collider experiment. The fraction
| (8) |
can be combined with pure calorimeter variables like the fraction of energy seen by the diodes
| (9) |
and the lateral development of the shower
| (10) |
where is the number of towers with signal and the distance of the tower from the reconstructed impact position.
Fig.11 shows versus for pions and electrons at 20 GeV. The discriminating power of the different variables in terms of pion contamination for 90% electron efficiency, at energies ranging from 20 to 50 GeV is shown in Fig.12. In most of the cases, purely calorimetric variables improve the overall separation capability with a factor compared with by itself. At 50 GeV the pion contamination for 90% electron efficiency is .

5 Conclusions
The present test has demonstrated the technical feasibility of longitudinally segmented shashlik calorimeters in which lateral sampling is performed by vacuum photodiodes. Due to the small dimension of the diodes and to the tilt of fibers and diodes with respect to the incoming particles, no significant cracks or dead zones are introduced. Performance in terms of energy resolution, impact point reconstruction and separation seem to be adequate for applications at future collider experiments.
6 Aknowledgements
The IHEP workshop staff has been essential for the construction of the prototype: we are greatly indebted with A. Kleschov, P. Korobchuk and A. Tukhtarov. We wish to thank also C. Fanin for the mechanical project, V. Giordano and R. Cereseto for the careful work in the realization of the prototype, G. Rampazzo for the invaluable effort in the construction of the read-out chain and all the staff and technical support of the SL-EA group for the smooth operation of the accelerator during the testbeam. A special thank to C. Luci for providing the simulation code at the early stage of this work and to M. Pegoraro and G. Zumerle for usefull suggestions and for granting the use of EMI diodes.
References
- (1) J. Badier et al., Nucl. Instr. and Meth. A348 (1994) 74
- (2) HERA-B Design report, DESY/PRC 95-01.
- (3) LHCb Technical proposal, CERN/LHCC 98-4.
- (4) S.J. Alsvaag et al., CERN/EP 98-132.
- (5) H. Fessler et al., Nucl. Instr. and Meth. A240 (1985) 284.
- (6) G.S. Atoyan et al., Nucl. Instr. and Meth. A320 (1992) 144.
- (7) R. Brinkmann, G. Materlik, J. Rossbach, A. Wagner (eds.), DESY 1997-048.
- (8) CMS Technical Proposal, CERN/LHCC 94-38
- (9) G.A. Akopdjanov et al., Nucl. Instr. and Meth. 140 (1977) 441.