Status of Salerno Laboratory
(Measurements in Nuclear Emulsion)111Presented in The First
International Workshop of Nuclear Emulsion Techniques (12-14 June
1998, Nagoya, Japan), http://flab.phys.nagoya-u.ac.jp/workshop.
Abstract
A report on the analysis work in the Salerno Emulsion Laboratory is presented. It is related to the search for oscillations in CHORUS experiment, the calibrations in the WANF (West Area Neutrino Facility) at Cern and tests and preparation for new experiments.
1 INTRODUCTION
The analysis work in the Salerno Emulsion Laboratory is running at present along the following main lines:
-
•
the search for oscillations in CHORUS;
-
•
calibrations in the WANF;
-
•
tests and preparation for new experiments.
The Salerno Group, having developed a new system [1] for a completely automatic system for search and the analysis of interactions in nuclear emulsions, is also continuing to improve both hardware and software tools to increase the efficiency and the speed of the system.
This argument and some of the results obtained in CHORUS have been presented by E. Barbuto in this workshop.
2 MEASUREMENT OF MUON FLUX IN THE WANF
In the West Area Neutrino Facility (WANF) [2] at CERN, a muon-neutrino beam is obtained from the decay of a parallel beam of pions and kaons of a given sign; the beam is then dumped in order to remove the charged particles.
The neutrino beam thus obtained is monitored by means of suitable counters inserted around the primary beam and the target, and inside the dump at different depths, where the muon flux is measured.
As the neutrino flux is proportional to the number of detected muons, these measurements allow to center the neutrino beam on its target, and to estimate its intensity through a Monte Carlo simulation that takes into account the muon absorption and scattering in the dump.
In addition, this procedure constitutes a real on-line monitoring of the neutrino beam and allows to detect within a few seconds any fault that could have occurred along the beam line.
The use of nuclear emulsions is mainly intended to give an absolute calibration to few of the many Solid State Detectors (SSDs) inserted in the shielding, that are relatively calibrated one to the others. This technique was already used in past [3] to calibrate the detectors in the Wide-Band and in the Narrow-Band-Neutrino beam at CERN.
The present automatic analysis, however, allows to handle much higher fluxes, with considerably increased statistics and in much shorter times.
2.1 THE WANF
The CERN muon-neutrino beam was largely rebuilt in 1992 - 93, and optimized for a new round of oscillation experiments (CHORUS and NOMAD).
450 GeV protons from the CERN-SPS are focused onto a primary target in two spills, 6 msec long, separated in time by 2.7 sec. (fast-slow ejection), one at the start and one at the end of the flat top. The two spills collect about 80% of the primary intensity.
The target is made up of 11 beryllium rods (3 mm in diameter, 10 cm long, spaced by 9 cm), aligned in a cast aluminum box; the rods are cooled by means of a closed flux of helium gas.
An aluminum collimator, 2.75 m long, is placed 2.5 m downstream of the target to remove the wide angle secondaries ( 9 mrad).
After the first two years of successful operation, the station received more than protons at 450 GeV/c, with a peak intensity of protons per machine cycle.
Positive (negative) hadrons are produced in the target and are focused (defocused) by the subsequent beam elements.
The neutrino (antineutrino) beam is generated by positive (negative) hadrons decays, mainly , , or c.c.
In the case of a neutrino beam, a small contamination (about 5%) of is produced by wrong sign hadrons (, ) present in the selected beam, while (about 1%) or (about 0.2%) are produced by semileptonic decays of kaons.
A much smaller fraction of (about 10-6) is produced through the production and the prompt tauonic decay of .
The beam line of Cern West Area is divided in three principal regions.
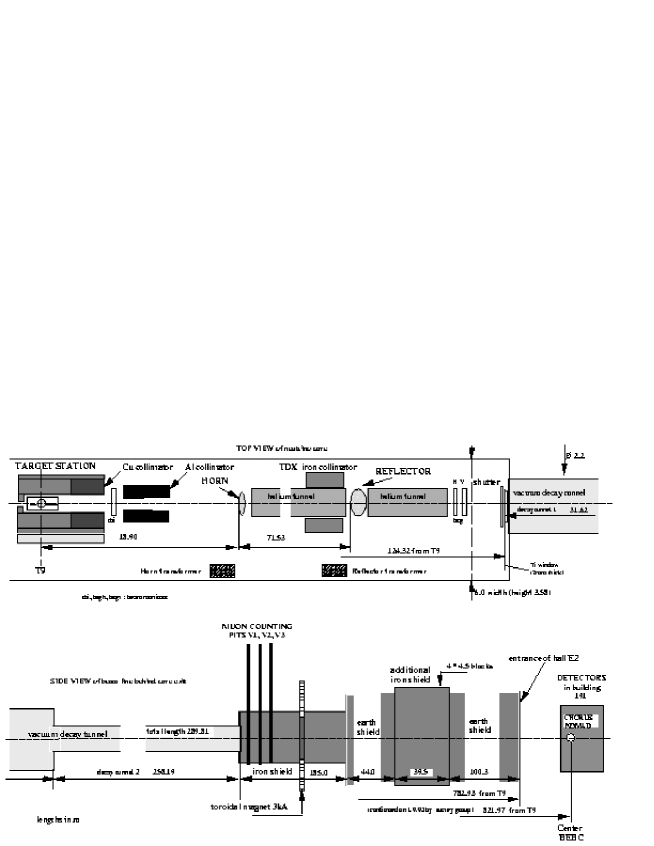
Figure 1 shows schematically, and not to scale, the beam line in the West Area.
The neutrino cave, 125 m long, contains the target and the focusing elements. These are the horn and the reflector, a system of two pulsed, coaxial conductors with cylindrical symmetry, studied by S. Van der Meer.
The decay tunnel, 290 m long and 60 cm in radius, is evacuated to a pressure of about 1 torr in order to minimize secondary interactions. Here, a sizeable fraction of the focused hadrons decay along a line very close to that of their parents.
The shielding -iron and earth- 400 m long, absorbs the remaining hadrons and decay muons.
In the shielding there are three pits about 15 m underground, 20, 40 and 60 m downstream of the decay tunnel. In each pit there is an array of 43 Solid State Detectors (SSD) to monitor the beam.
2.2 SSDs AND THEIR ABSOLUTE CALIBRATION
Solide state detectors measure the charge (as an integrated electric current) produced by crossing particles and need an accurate calibration to convert their electric signals into charged particles flux measurements.
The absolute calibration is made using the counting provided by nuclear emulsions. The choice of nuclear emulsions is due to their very high efficiency and to their excellent two track separation, that allow the detection of very intense particle fluxes (up to more than in our case).
Our work refer to measurements in pit n∘3, the most downstream, in which muon flux is less than in the others, and for this reason, it has been chosen for the emulsion set exposures.
Solid State Detectors (silicon detectors - sensitive surface from 30 up to 200 and thickness from 0.1 up to 1 mm) are placed in boxes on a rigid support, orthogonal to the beam line.
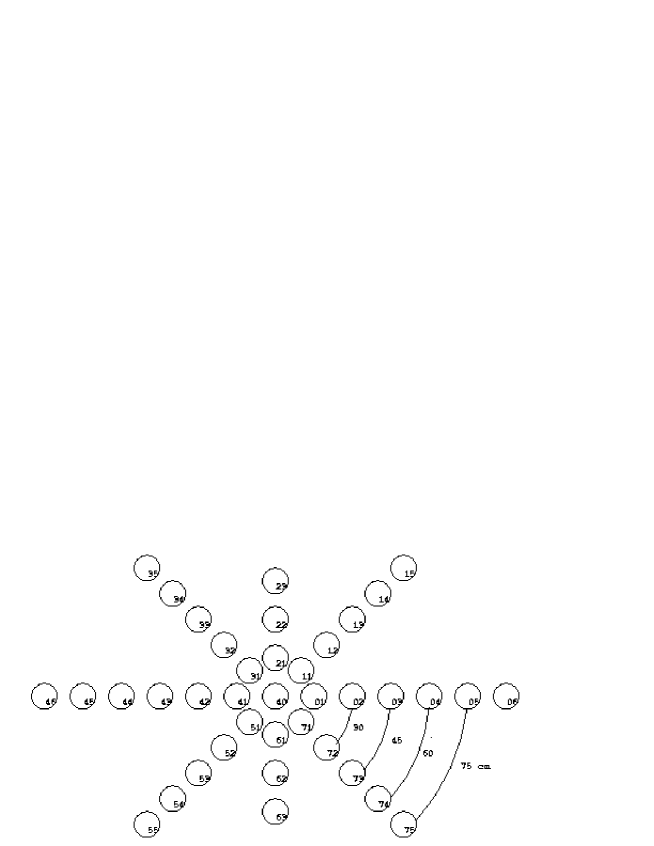
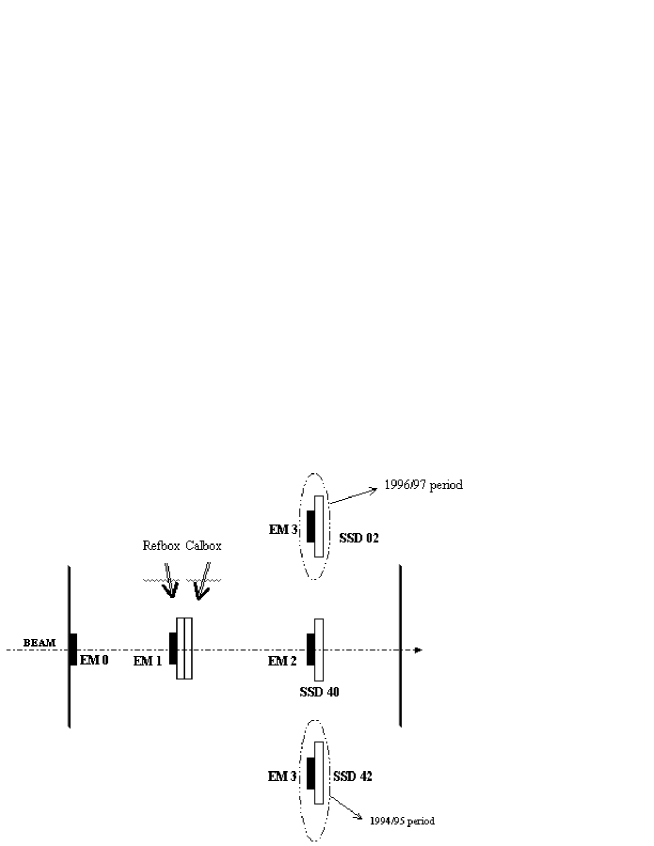
Figure 2 shows a typical arrangement of the counters.
A particular box with 5 SSDs, the calibration box (Cal.box), that can be moved in front of the other counters, calibrates them. The calibration sequence is automatically repeated every 8 hours, by successive movements of the Cal.box.
Another special box, the reference box (Ref.box), is moved from pit to pit, and placed in front of the calibration boxes, to calibrate them.
Finally, the absolute calibration of Ref.box, and hence of all the counters, is performed with emulsion measurements. To be safe, a set of 4 emulsion plates were used at the same time to calibrate also detector n∘40, on the center of beam line, and detector n∘2 (during 1994-95) and detector n∘42 (during 1996-97).
In the last 4 years, in pit n.3, 17 exposures of emulsion sets were performed.
Emulsion plates were stuck on the center of a box containing SSDs and exposed perpendicularly to the beam direction, so that tracks cross the emulsions nearly perpendicularly and fully automatic scanning can be successfully performed.
The location of the emulsion plates and their identification labels are shown in figure 3.
We used 3 or 4 plates () for each set, and two sets of emulsions were generally exposed the same day, each to one spill of intensity between and , corresponding to protons on target (p.o.t.).
We have used plates double coated on a 300 plastic base, with Fuji or Nikfi gel. The thickness of emulsion pellicles were 100 (150 for the last three exposures).
A total of 66 emulsion plates were exposed; together with each exposed set, we produced a reference plate that was not exposed in the beam line but was used for evaluating the background. In order to reduce the background, due to environment radioactivity, to cosmic rays, etc., the emulsion plates were poured immediately before and developed soon after the exposure (within a period, typically, of one week).
We used the automatic scanning, SYSAL (SYstem of SALerno). On each emulsion fields were scanned (about 0.39 ), with a gap among fields to prevent double counting of tracks.
Typically, 35 to 35 tracks/field were found, and a total of about tracks were measured.
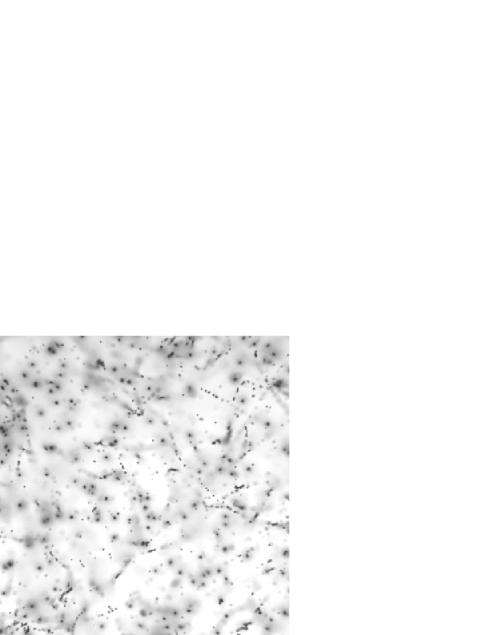
A two dimensional image as seen under a magnification is shown in figure 4, corresponding to a density of about 80 tracks/field.
2.3 Results
Tracks that cross the emulsion pellicle from one surface to the other are called passing - through tracks. In the data taking these tracks are built up with at least 20 aligned grains, and are the only ones capable to contribute to the electric signal of SSDs. So, all other tracks present in emulsion must be excluded from flux evaluation, because they don’t reach the SSDs.
Other tracks reconstructed by SYSAL are:
-
•
fake tracks due to association of random grains in emulsions, usually with few poorly aligned grains;
-
•
background tracks, like slow-energy electrons and cosmic rays, mostly with wide angle;
-
•
mixed tracks, poorly aligned grains with an intermediate number of grains, contribute to both good and background tracks.
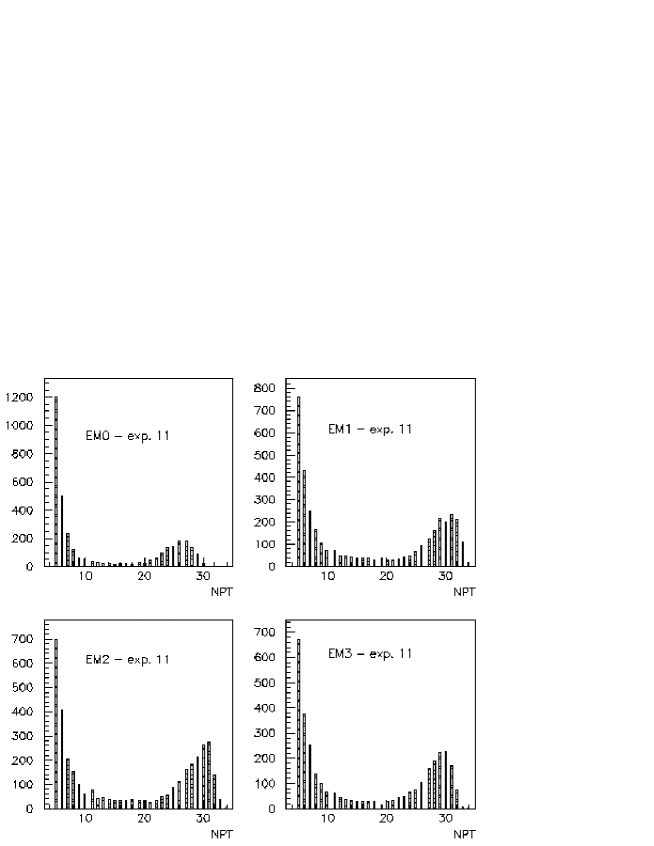
Figure 5 shows the distribution of track grain multiplicity for a particular exposure.
These plots show a peak at 28 - 30 grains due to passing through tracks; a flat region includes mixing tracks; another peak with a few grains is due to fake and background tracks. The cut off at number of points equal to 20, to calculate muon flux, was chosen in order to reject the latter peak.
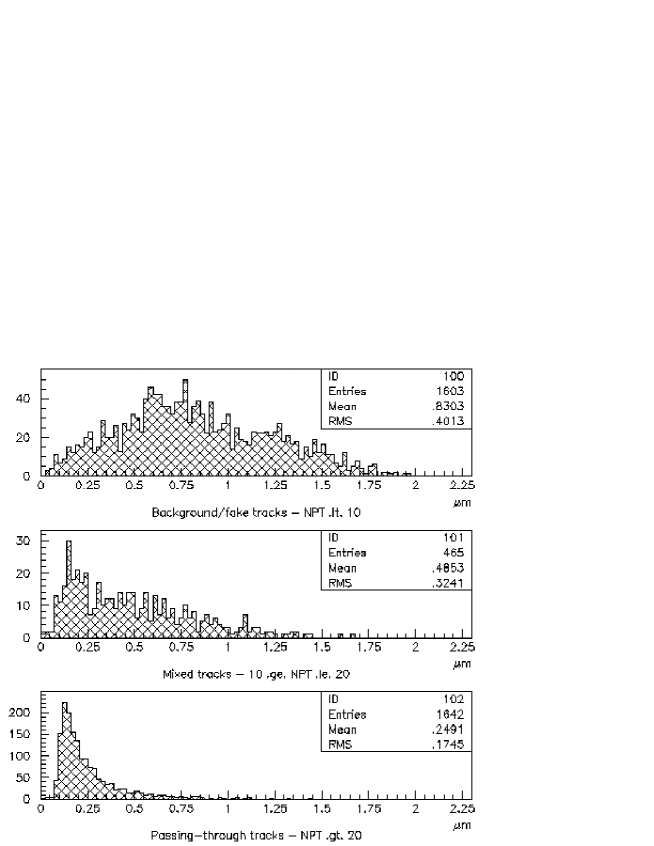
Figure 6 shows the distributions of the residuals from a parabolic fitting for the three categories of segments, according to their grain multiplicity.
To test the reproducibility of our measurements we have rescanned every time the same plate; such a scanning confirms that the measurements reproducibility is within a few percent.
For each plate we have also measured polar and azimuthal angle.
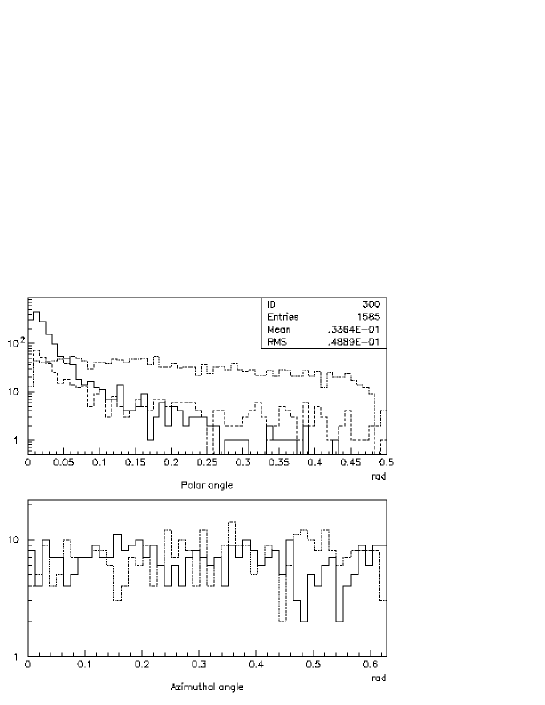
Figure 7 shows polar and azimuthal angle distributions, after distortion and shrinkage corrections.
We have studied the correlation between flux from SSDs (electric signal was converted with the existing calibration) and flux measured on all emulsion plates. We found a very good linear correlation. A linear correlation is also confirmed between BCTs222The neutrino flux monitoring system also collects data about the primary proton beam and the secondary hadron beam from Beam Current Trasformers (BCTs) upstream of the target. countings and emulsion measurements.
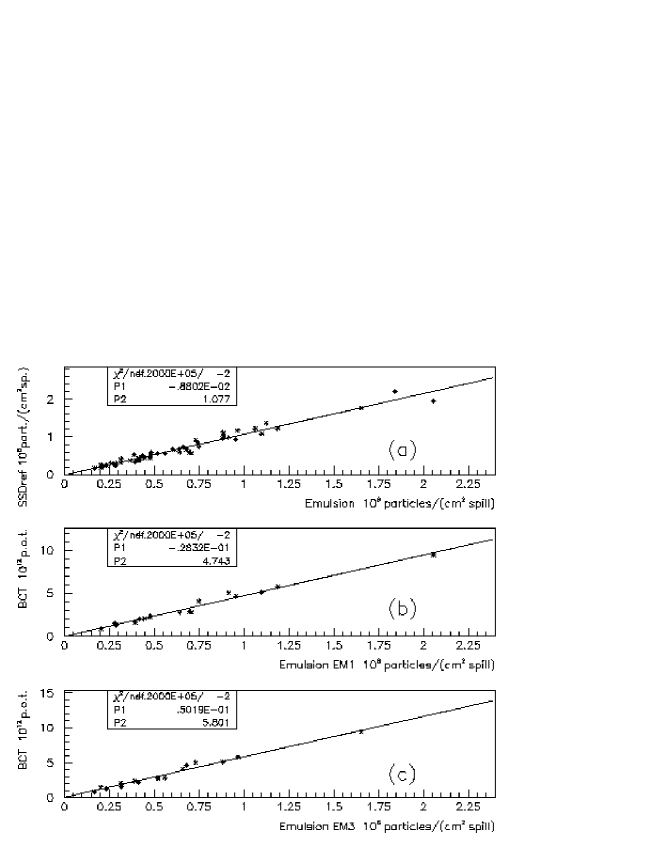
These correlations are shown in Figure 8. The correlation between flux measurements from Ref.box and flux measured from emulsion plate (Em 1) stuck on Ref.box gives a very good agreement (within about 1%).
The highest density of tracks is more than .
3 A TEST FOR TOSCA EXPERIMENT
Sysal was also used to test the set-up of possible, future experiments. Among these TOSCA [4], conceptually similar to CHORUS, aims to much better detection of charged particles, and foresees an emulsion target within a magnetic field.
An option for a wide-gap magnet could be the one built for UA1, at present in NOMAD (maximum field B=0.7 T).
An option for a suitable spectrometer is a Compact Emulsion Tracker (CET), a set-up already used in the past, for example in the study of high-energy heavy-ion experiments (EMU 08, 09,16, etc.)
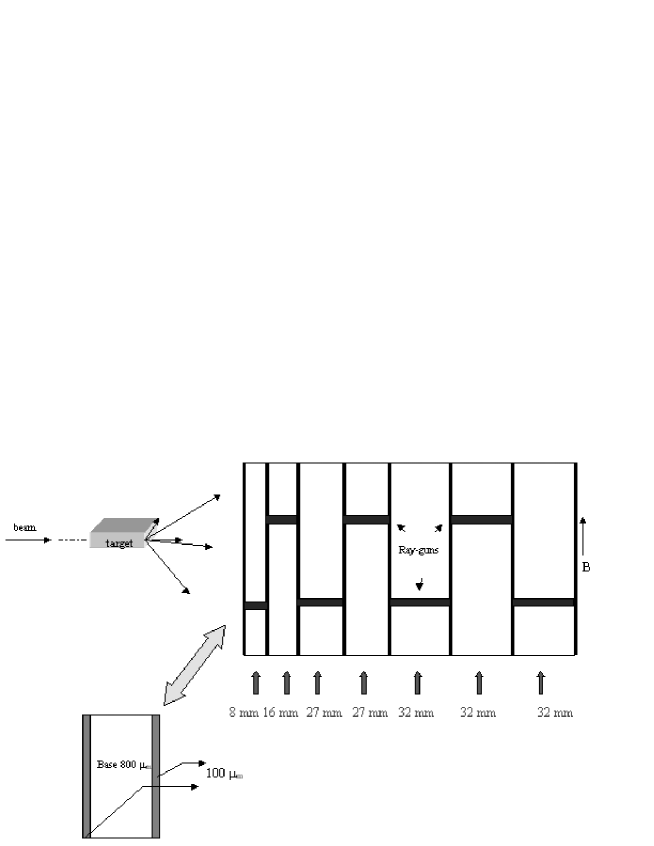
This set-up (fig. 9) was tested in September 1997 where an emulsion target 9 cm thick () was followed by silicon trackers and by a series of 8 thin, parallel emulsion sheets spaced from 8 to 32 mm over a total length of 180mm.
A 15 GeV beam of pions was used to produce interactions in the target, whose particles have been traced in the external apparatus.
A first alignment between pairs of CET sheets was realized by means of X-ray guns (see fig. 9). A better approximation was obtained by measuring positions and angles of a sample of primary particles, whose individual identity was recognized from one sheet to the next by comparing the topological pattern.
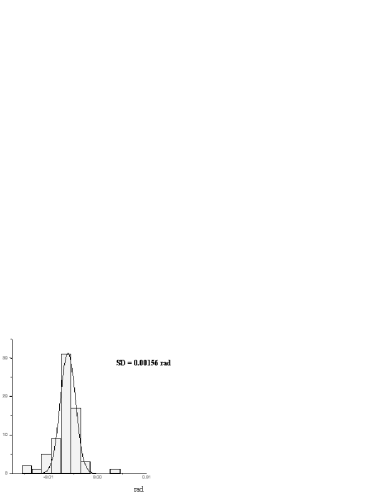
The angular spread of the beam (fig. 10) was found to be about 1.6 mrad, in excellent agreement with that expected for a 15 GeV parallel beam after having crossed a target.
This procedure allowed to place all sheets in a common reference frame by means of a fit of the rototraslational parameters.
Finally, a random search was performed in the first pellicle for random tracks out of the beam ( 50 mrad), and thus some tracks were searched and measured in the following pellicles.
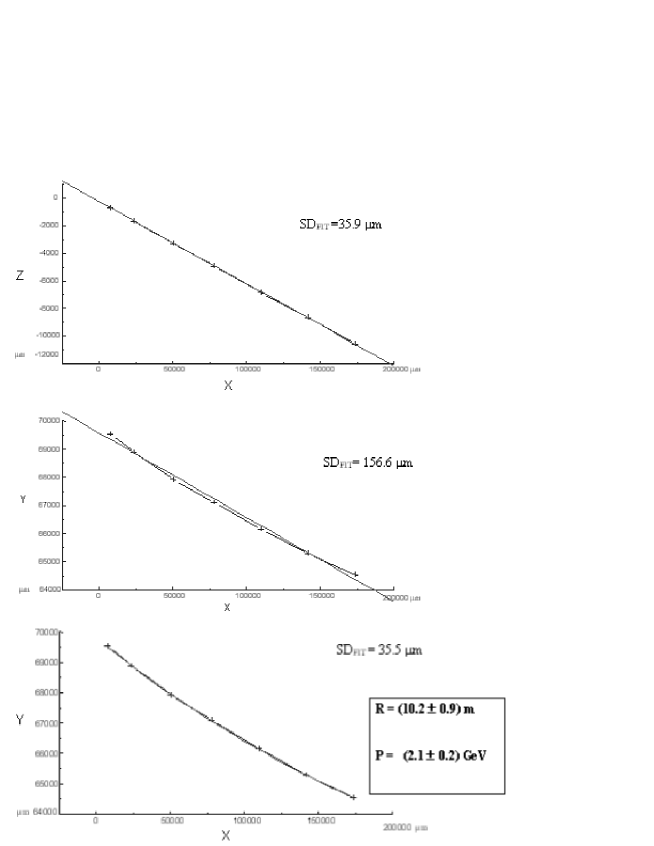
A linear fit was performed for the transverse coordinates as functions of the longitudinal one: as a result, systematically the residuals on the bending plane turned out to be about one order of magnitude larger with respect to those in the non-bending planes, and these are compatible with the accuracy in locating the pellicles with the location procedure described above.
A parabolic fit in the bending plane allowed to determine the radius of curvature, hence the momentum of the particles.
Now, the residuals turn out to be similar to those in the non-bending plane.
Fig. 11 shows a typical example of the results obtained on a particular track. Table n.1 shows the global results for a set of tracks.
|
Of course, this procedure assumes that the primary particles have straight trajectories, but their curvature could be easily taken into account.
In the near future it is planned to repeat these measurements on predicted tracks, whose momentum has been also measured in the external apparatus.
From these results it is concluded that this set-up allows to measure momenta with a minimum relative error , essentially due to multiple scattering in the emulsion sheets.
The measurement error, that could be possibly lowered, gives at present .
References
- [1] G.Rosa et al, Automatic Scan and Analysis of Digitized TV Images by a Computer Driven Optical Microscope, NIM A 394 (1997) 357-367.
- [2] C.Bozza, A. Di Bartolomeo, G.Iovane, P.Pelosi, Measurements of the muon flux in the CERN SPS wide band neutrino line, CHORUS Internal Note 97030, Geneva, January 1998.
- [3] E.H.M.Heijne, Muon flux measurements with silicon detectors in the CERN neutrino beams, CERN 83-06 Experiment Physics Facilities Division, Geneva, 21 July 1983.
- [4] European Organization for Nuclear Research, Request for a test of emulsion-silicon configurations for a neutrino experiment, CERN-SPSC/97-4 SPSC/M596, 21 February 1997.