High-purity germanium detector ionization pulse shapes of nuclear recoils, - interactions and microphonism
Abstract
Nuclear recoil measurements with high–purity Germanium detectors are very promising to directly detect dark matter candidates. The main background sources in such experiments are natural radioactivity and microphonic noise. Digital pulse shape analysis is an encouraging approach to reduce the background originating from the latter. To study the pulse shapes of nuclear recoil events we performed a neutron scattering experiment, which covered the ionization energy range from 20 to 80 keV. We have measured ionization efficiencies as well and found an excellent agreement with the theory of Lindhard. In a further experiment we measured pulse shapes of a radioactive –source and found no difference to nuclear recoil pulse shapes. Pulse shapes originating from microphonics of a HPGe–detector are presented for the first time. A microphonic noise suppression method, crucial for dark matter direct detection experiments, can therefore be calibrated with pulse shapes from –sources.
Authors
1 Introduction
The dark matter in the Galactic halo is assumed to be dominantly composed of WIMPs [1]. A direct detection method is through WIMP interaction with ordinary matter by elastic scattering off nuclei [2]. Direct detection experiments search for the energy deposition produced in a low background detector by a WIMP elastically scattered off a nucleus therein (typical below 100 keV). Most promising future approaches include experiments with scintillation– [3], cryogenic– [4] and semiconductor detectors [6]. The best results at present are obtained using NaI–crystals [3, 7] and HPGe–detectors [6]. The background of HPGe–detectors in the energy region below 100 keV originates from natural radioactivity and microphonic noise. Therefore a further step in reduction of the background from natural radioactivity by one order of magnitude or more [25] needs a reliable method to identify microphonic noise. The success of digital pulse shape analysis [9] in discriminating single and multiple scattered events is encouraging to think of a similar method in order to identify microphonics in the low energy region of HPGe–detectors. Another way to identify microphonics is the simultaneous use of two different shaping times in the processing of the signal (see [5] and references therein) which is however not the topic of this paper. Also are there other applications which use the information from the pulse shapes of the charge current of Ge–detectors [10, 11, 12]. All of the cited papers measure pulse shapes at higher energies (beyond 200keV).
A first step in developing a pulse shape analysis method is to study pulses of well defined origin. Nuclear recoil events comparable to those of not yet known particles, WIMPs, can be generated by elastically scattering of neutrons off nuclei in the germanium detector. Gamma interaction events in the energy region below 100keV can be generated for example by radiation of the detector with a 133Ba source.
We measured the pulse shape of neutron interactions, of –interactions and of microphonic noise. Simultaneously we measured the ionization efficiency of germanium recoil nuclei inside germanium. Nuclear recoil events were studied until now by a cryogenic experiment [4], which could demonstrate the difference in ionization and phonon signals produced by nuclear recoil and photon interactions. The ionization efficiency was measured already in the 60s. With exception of one early experiment, which measured the endpoint of the energy spectrum from elastically scattered neutrons [13], the shapes of a peak from inelastically scattered neutrons [14, 15, 16, 20, 19] were studied.
From the good agreement of our measured ionization efficiency with the theory of Lindhard [23] and the previous measurements we conclude to measure indeed pulse shapes of Ge recoil events in germanium. To sample the pulse shape of each recoil event we had to perform an event-by-event measurement. For this purpose we built up a coincidence experiment as described in section 2. In section 3 we discuss the measurement of –ray pulse shapes and in section 4 the measurement of microphonic pulses. We give a conclusion and an outlook in section 5.
2 Neutron Scattering Experiment
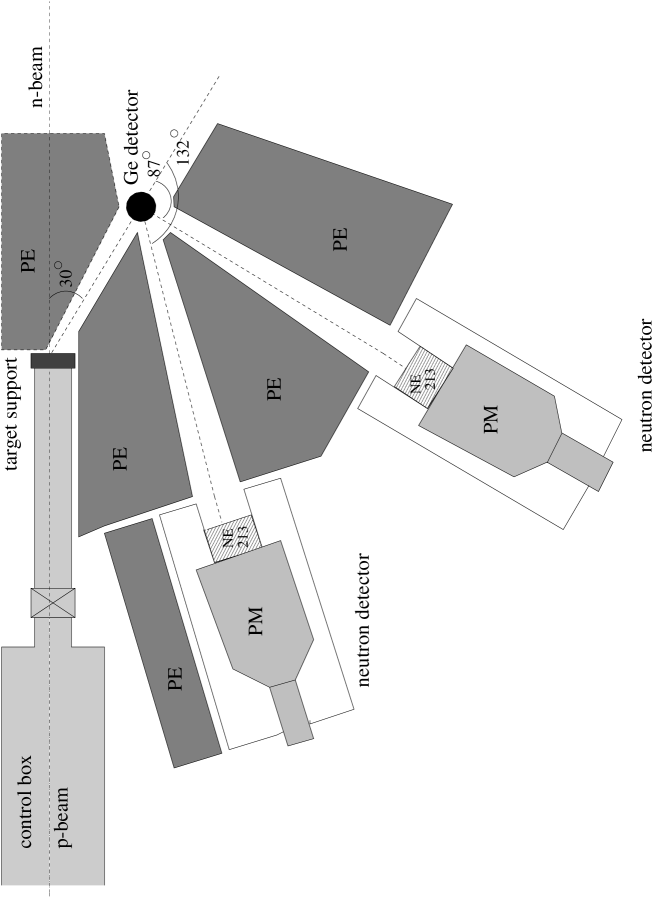
The experimental setup can be seen in Fig. 1. A 3.3 MHz pulsed proton beam with 16 MeV energy, 1 ns duration, and 1.5 nA current was used to produce neutrons in a Lithium coated copper target by p(7Li,7Be)n, p(65Cu,65Zn)n and p(63Cu,63Zn)n reactions. The maximal neutron energies for Ep = 16 MeV under 30∘ are listed in Tab. 1. Due to the different reactions and the large number of excited states in 65Cu the neutrons had a continuous energy spectrum which was measured in 1.36 m distance by time of flight (TOF).
To select events from elastic scattering of neutrons inside the germanium we placed NE 213 scintillators under 87 and 132 degrees (compare Fig. 1). The scintillators were equipped with n,–discrimination using the differences in pulse rise times of neutron and –interactions in the liquid scintillator [17]. Coincidence between the timing signal of the Ge–detector, one of the scintillators and of the proton beam signal was used as start signal for the time measurements. A coincidence of the delayed start signal and the n,–discrimination reduced the trigger rate down to 1 Hz due to rejection of random coincidences of –interactions in the scintillators and the Ge–detector.
For each event we recorded energy–deposits inside the HPGe and the neutron detectors, n,–signal of the neutron detectors, time differences between beam pulse and each of the three detectors and the pulse shape of the differentiated HPGe preamplifier output.
Our Ge-detector was a n-type coaxial, closed ended HPGe detector with a mass of 1.05 kg and a diameter of 5cm. N-type detectors are more resistant to fast neutron damage than p–types [22, 21].
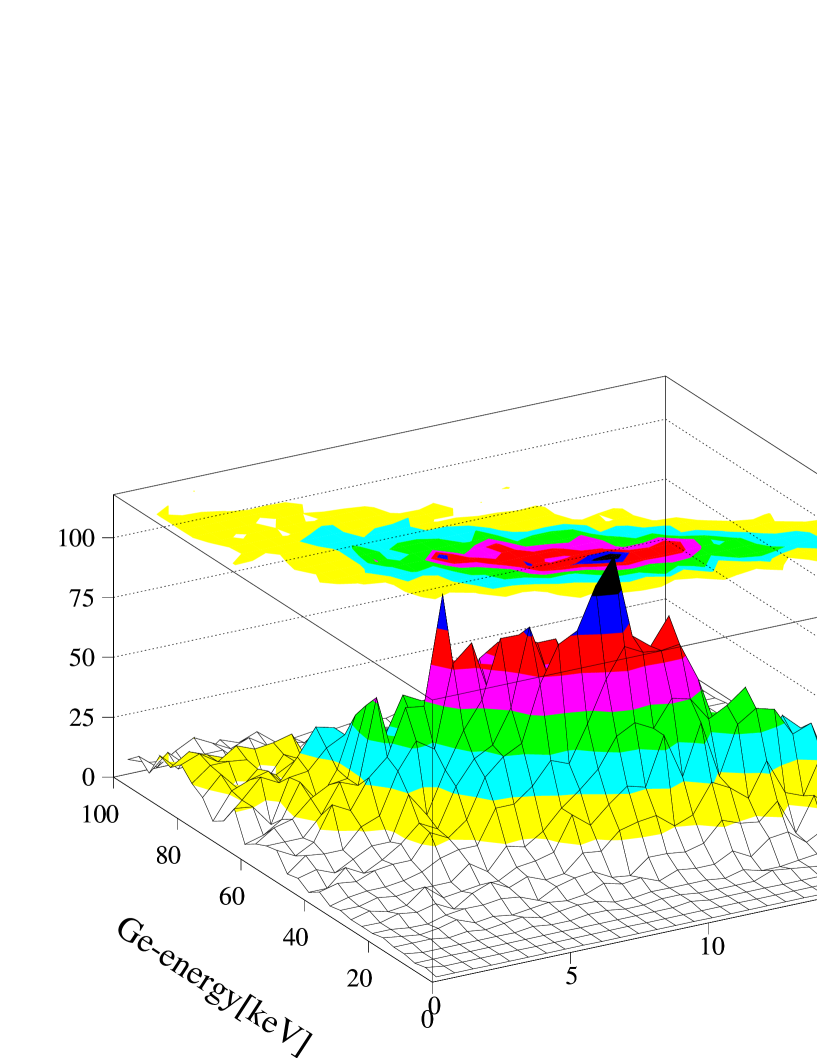
The Germanium detector was calibrated with a 228Th source, the TOF measurements with several delays from 2 ns up to 150 ns. The energy resolution of the Germanium detector was 1.55 keV at 80 keV. The time resolution of the scintillators was 1.5 ns. In Fig. 2 the energy deposited inside the germanium detector is plotted as function of the TOF of neutrons detected in one neutron detector. The events from elastically scattered neutrons form a continuous band towards the lower right.
From this measurement the ionization efficiency of germanium atoms in germanium can be calculated [8]:
| (1) |
Here ER is the energy of the recoil nucleus, En is the incident neutron energy, mn and mGe are masses of neutron and germanium nuclei, is the laboratory scattering angle of the neutron. The neutron energy En as function of the flight time and energy loss of the neutron which is equal to the recoil energy of the germanium nucleus can be calculated from:
| (2) |
where d1 is the distance from the copper target to the germanium detector; d2 from germanium detector to the neutron detector. Taking both formulae the recoil energy can be calculated and compared to the ionization energy measured by the germanium detector. The ionization efficiency is given by the ratio of ionization energy to recoil energy. The results are plotted in figure 3. The experimental values are in good agreement with the theory of Lindhard which is also verified by other experiments [13, 14, 15, 16, 20, 19] down to 0.3 keV. Therefore we conclude that we have measured recoil events from elastically scattered neutrons inside the germanium detector.
The pulse shapes of recoil events were obtained by differentiation of the customary integrating preamplifier output with 20 ns time constant. The signal was also integrated with 20 ns. To reduce the noise level we selected the pulse shapes according to their rise times and calculated mean pulse shapes. The mean pulse shapes were calculated by adding the individual pulses of certain rise times (ca. 100 pulses per rise time) and dividing by the number of pulses. In Fig. 4 we show as an example mean pulse shapes for 80keV Ge recoil nuclei from neutron scattering (left picture) with rise times of 88ns, 112ns and 136ns.
3 –Pulse shapes compared to nuclear recoils
Production of nuclear recoil pulses in a low–level experiment for a calibration measurement is not only a great effort but also polluting the experiment, since the neutrons would activate the detector and its shielding. Thus one has to think of a different source for generating pulse shapes to calibrate any pulse shape discrimination method. The usefulness of –sources is obvious. We have sampled pulse shapes from a 133Ba source by using the low energy Ba lines at 53keV and 80keV and the 133Cs X–ray lines at 30keV and 35keV.
The pulse shapes in a coaxial detector depend on the interaction radius. Therefore we have radiated the detector using a lead collimator at different radial positions. The resulting rise times as a function of the collimator position can be seen in Tab. 2. The shape of the pulses depends on the motion of the charge carriers in the electric field inside the Ge detector [24]. Shown in the table are also the rise times corrected for the differentiation of the pulses with 50ns shaping time and the rise times calculated under the assumption of a true coaxial Ge–detector and a constant electron drift velocity of 107 cm/s [24]. For the n–type coaxial Ge detector the collection time of the electrons (which are the majority charge carriers and move towards the inner contact) dominates the time response of the detector [24]. Thus interactions at smaller detector radii should show a smaller risetime than interactions which take place in the outer part of the detector. This dependence has been in principle confirmed in the behaviour of the pulses at low energies. The difference between calculated and measured rise times is due to the irradiation of the detector from the top, where the effect of the closed ended geometry is most visible. Since our aim was to measure pulse shapes of different rise times and not to determine the interaction radius from the measured rise time, this effect is of no importance for this work.
In order to reduce the noise background the pulse shapes from –ray events were selected and summed in the same way as the nuclear recoil pulses described in Section 2. As example we show in Fig. 4 (right picture) 80keV pulse shapes from –ray events. The three risetime classes are the same for nuclear recoil and –ray events. The number of summed pulses was ca. one thousand per risetime.
There is obviously no difference between nuclear recoil and –ray pulses within the timing resolution of Ge–detectors. The mean –pulses are smoother because of the higher statistics of the accumulated data with the –ray source. We conclude that it is not possible to differentiate between –ray– and Ge–recoil–events by means of the pulse shape.
Thus a relative background suppression method based on pulse shape analysis like for NaI scintillators [3, 7] will not be applicable for Ge–detectors. Consequently, one can calibrate the pulse shape analysis for nuclear recoils by –ray sources. This is an easy to handle method which needs no sophisticated experiments and without the risk of activating the detector and radiation damage.
4 Comparison of pulse shapes from microphonic events with –interaction pulses
When placed in a low level environment Germanium detectors are very sensitive to microphonic noise. Microphonism constitutes one of the main limitations of Germanium detectors in the low energy region and rends the evaluation of low energy spectra ambiguous. The usual way of discriminating against microphonism is to to use the timing information of each event [6]. The time distribution of all events in the spectrum is computed and cuts are set on the number of events per a certain time interval. This method makes the assumption that microphonic events occur in bursts and leads to run time losses up to 40%. A method of analysing the pulse shape of each individual event would be much more efficient.
To record a library of typical microphonic pulses we used the small p–type natural Ge–detector of the HDMS–Experiment [25] situated in the Gran Sasso Underground Laboratory. The detector has an active mass of 202 g and is situated in a low level cryostat with 60cm distance between FET and preamplifier. To reach a low energy threshold and record the pulse shape of each event we built up a special electronic and trigger system. The preamplifier energy signal is divided, amplified with 2s and 4s shaping time and measured by 13bit ADCs. The ADCs deliver fast, so called peak–detect signals, which are subsequently used for trigger purposes. The faster 2s shaped signal serves as a stop signal for the 250MHz flash ADC which records the pulse shapes. However, the 2s shaped signal yields a worse energy resolution and thus a higher energy threshold because of the remaining higher noise level of the baseline. The best energy resolution (1.87 keV at 1332keV) and threshold (2.5keV) are obtained using the 4s shaping. The preamplifier’s timing output is divided into four branches then differentiated, integrated and amplified in timing filter amplifiers with different time constants. The differentiation and integration time constants are (50ns, 50ns), (100ns, 100ns), and (200ns, 200ns). The signals are amplified in two different ways to record both low and high energetic pulses. For the purposes of this paper the (50ns, 50ns) shaped pulses are most suitable. The obtained pulse shapes are recorded with flash ADCs.
We recorded microphonic pulse shapes with energies up to 60keV. –ray pulses with comparable energies were measured with an EuTh source. Fig. 5 shows examples of both types of pulse shapes with the same energies. On the left side are microphonic pulses, –ray pulses are on the right side. The patterns of the two kind of pulses are clearly different and it is obvious that microphonic pulses are not like the baseline noise which is present in the microphonic free –ray pulses. For a more quantitative comparison between microphonic– and –ray pulses we suggest several discrimination methods. One might analyse the power spectra of the pulses, compute the second derivative and count the number of extrema or compute the integrated signal. Which, or which combination of the above mentioned methods will deliver the highest rejection efficiency and will be applied has yet to be seen. Moreover the characteristics of microphonic pulses will depend on the single detector and its operational environment. Thus it is not reasonable to further investigate the different methods in this paper.
5 Conclusion and Outlook
Pulse shapes of recoil events from neutron scattering inside a germanium detector were collected for the first time. The measured ionization efficiencies of recoiling germanium atoms in germanium are in good agreement with the theory of Lindhard and earlier measurements. We use this confirmation as cross check for our sample of nuclear recoil pulse shapes. A difference to the pulse shapes from –ray interaction has not been found. For a calibration of the nuclear recoil pulse shape we confirm the reasonable practice to use –ray sources instead of neutrons as a calibration standard. We found instead a relevant difference between nuclear recoil pulse shapes ( –pulse shapes) and microphonic pulses. Thus further development of an electronic noise reduction method for dark matter experiments like [25] is possible by measuring the pulse shape of each recorded event. This microphonic noise mainly obscures energy spectra for WIMP detection in the most interesting near–threshold energy region. A discrimination method against microphonics would eliminate one of the last systematic uncertainties for Ge–detectors. We are confident to apply such a method in our new dark matter experiment, starting it’s operation during this year, the Heidelberg Dark Matter Search (HDMS) Experiment [25].
References
- [1] G. Jungmann, M. Kamionkowski and K. Griest, Phys. Rep. 267 (1996) 195.
- [2] P. F. Smith and J. D. Lewin, Phys. Rep. 187 (1990) 203.
- [3] N. J. Spooner and P. F. Smith, Phys. Lett., B 314:430, 1994.
- [4] T. Shutt et al. Phys. Rev. Lett., 69:3425, 1992.
- [5] E. Garcia et al., Phys. Rev., D 51:1458, 1995.
- [6] M. Beck et al., Heidelberg–Moscow Collaboration, Phys. Lett., B 336:141–146, 1994.
- [7] R. Bernabei et al. Phys. Lett., B 389:757, 1996.
- [8] L. Baudis . Diploma Thesis, 1997, unpublished.
- [9] L. Baudis et al., Heidelberg–Moscow Collaboration, Phys. Lett., B 407:219, 1997
- [10] G. J. Bamford, A. C. Rester, R. L. Coldwell, C. M. Castanada IEEE Trans. Nucl. Sci. NS-38 (1992) 200.
- [11] B. Aspacher and A. C. Rester, Nucl. Inst. and Meth. A 338 (1994) 516.
- [12] J. Roth, J. H. Primbsch and R. P. Lin, IEEE Trans. Nucl. Sci NS-31 (1984) 367.
- [13] A. R. Sattler. Phys. Rev., 138:A1815, 1965.
- [14] C. Chasman, K. W. Jones, and R. A. Ristinen. Phys. Rev. Lett., 15:245 (E) 684, 1965.
- [15] C. Chasman, K. W. Jones, and W. Kraner, H. W.and Brandt. Phys. Rev. Lett., 21:1430, 1968.
- [16] Y. Messous et al. Astroparticle Physics, 3:361, 1995.
- [17] J. W. Hammer et al. Nucl. Inst. and Meth., A 244:455–476, 1986.
- [18] J. Lindhard and M. Scharff. Phys. Rev., 124:128, 1961.
- [19] K. W. Jones and H. W. Kraner Phys. Rev., A 11 (1975) 1347–1353.
- [20] K. W. Jones and H. W. Kraner Phys. Rev., C 4 (1971) 125–129.
- [21] M. Eschenauer et al., Nucl. Inst. and Meth. A 340 (1994) 364–370.
- [22] H. W. Kraner, IEEE Trans. Nucl. Sci NS-27 (1980) 218.
- [23] J. Lindhard, V. Nielsen, M. Scharff, and P. V. Thomsen, Mat. Fys. Medd. Dan. Vid. Selsk. 33 (1963) 1.
- [24] G. F. Knoll, Radiation Detection and Measurement, 2. ed., Wiley, 1989.
- [25] L. Baudis et al. Nucl. Inst. and Meth., A 358:265–267, 1997.
| Energy [MeV] | Reaction |
|---|---|
| 13.77 | p(7Li,7Be)n |
| 13.75 | p(65Cu,65Zn)n |
| 11.78 | p(63Cu,63Zn)n |
| radial position cm | tr(10–90%) ns | tr (0–100%) | ns | ns |
|---|---|---|---|---|
| 0.00.1 | 6020 | 7220 | - | - |
| 0.50.1 | 6020 | 7220 | 4011 | 10 |
| 1.00.1 | 12020 | 14420 | 13418 | 60 |
| 1.50.1 | 15020 | 18020 | 17319 | 110 |
| 2.00.1 | 16015 | 19215 | 18715 | 160 |
| 2.50.1 | 18010 | 21610 | 21310 | 210 |