, , , , , , , , , , , , , , , , , , , , , , , , , , , , , , , , , , , , , , , , , , , , , ,
The Atmospheric Neutrino Flavor Ratio from a 3.9 Fiducial Kiloton-Year Exposure of Soudan 2
Abstract
We report a measurement of the atmospheric neutrino flavor ratio, R, using a sample of quasi-elastic neutrino interactions occurring in an iron medium. The flavor ratio (tracks/showers) of atmospheric neutrinos in a 3.9 fiducial kiloton-year exposure of Soudan 2 is of that expected. Important aspects of our main analysis have been checked by carrying out two independent, alternative analyses; one is based upon automated scanning, the other uses a multivariate approach for background subtraction. Similar results are found by all three approaches.
[a] Now at CERN, Geneva, Switzerland [b] Now at Fermilab, Batavia, IL 60510, USA [c] Now at IFIC, E-46100 Burjassot, Valencia, Spain [d] Now at Physics Department, Colorado College, Colorado Springs, CO 80903, USA [e] Now at Cypress Semiconductor, Minneapolis, MN, USA [f] Now at Lucent Technologies, Naperville, IL 60566, USA
1 Introduction
The flavor ratio in sub-GeV atmospheric neutrino interactions as measured in underground detectors has sensitivity to a breakdown of the Standard Model in the neutrino sector. The flavor double ratio, defined as
| (1) |
factors out the dependence on the absolute flux and in principle provides a measurement with small systematic errors. In practice the pure and rates cannot be measured directly and the experiments measure
| (2) |
for the iron calorimeters or
| (3) |
for the water Cherenkov detectors. The measured values of R depend on the acceptance and misidentification in each individual experiment and are thus not expected to be equal to each other or to . However a measurement different from 1.0 in any experiment is evidence of an anomaly.
Six experiments have reported results on R [1, 2, 3, 4, 5, 6]. These measurements suggest a value of R significantly lower than unity. The highest statistics on this measurement come from the water Cherenkov experiments, Kamiokande, IMB, and SuperKamiokande. Three iron calorimeter experiments, NUSEX, Frejus, and Soudan 2, have reported results. Our previous result [6], (stat.)(syst.) was based on an exposure of 1.52 kton-years. The confirmation of the low atmospheric flavor ratio with good statistical significance in a calorimeter would provide additional evidence that there is no significant unexpected source of systematic error in water detectors. In this paper we report a value of obtained in a 3.9 fiducial kiloton-year exposure of Soudan 2.
There are three stages involved in our analysis. First a sample of contained events is identified. These are then classified for neutrino flavor. Finally a background subtraction is made and a value of R calculated. Each of these stages, particularly the flavor classification, could introduce bias into the flavor ratio measurement. We have therefore checked the procedure by using different analyses. These analyses give consistent results and confirm the validity of our principal result.
Sections 3-5 describe our principal result, the flavor ratio as measured in a sample of quasi-elastic interactions from a 3.9 fiducial kiloton-year exposure. The main analysis relies on physicist scanning for the verification of containment and for the flavor determination. By performing an analysis in which computer programs largely replace the scanning (the Automated Analysis), we have verified that the main procedure does not introduce biases due to subjectivity in the scanning. We have also checked our method of background subtraction and R calculation by an additional analysis in which an alternative method for background estimation is used (the Multivariate Analysis). These analyses are described in Section 6.
2 The Soudan 2 Detector
The Soudan 2 detector is a 963 ton fine-grained gas tracking calorimeter located in the Soudan Underground Mine State Park in Soudan, Minnesota. The detector currently operates with 90% live time and has been taking data since 1989. It consists of 224 iron modules, each 1 meter x 1 meter x 2.7 meters in size, and occupies a volume 8 meters wide x 5.5 meters high x 16.1 meters long. Each module has a mass of 4.3 tons. Ionization deposited in the plastic tubes of a module drifts in an electric field to the faces of the module where it is detected by vertical anode wires and horizontal cathode strips. The third coordinate of the charge deposition is determined from the drift time in the module. The calorimeter modules operate in proportional mode; the measured pulse height is proportional to the ionization deposited in the tube. Pulse height measurements are used for particle identification. More details of the module construction and performance can be found in References [7, 8].
The detector is surrounded by a 1700 active shield mounted on the cavern walls. The shield is designed to identify particles entering or exiting the cavern. It tags events associated with cosmic ray muons passing close to the detector. It has a measured efficiency of 95% for cosmic muons crossing a shield element. The complete shield covers about 97% of the total solid angle. Reference [9] contains more information about the shield.
The most recent 2.4 kton-yrs of data were obtained with a number of improvements to the detector modules and shield. Additional layers added to the shield provided a third layer of shield coverage for much of the floor and ceiling sections.
3 Data Analysis
The data described in this paper come from a 3.9 fiducial kiloton-year exposure taken between April 1989 and January 1998. This corresponds to a total exposure of 4.8 kiloton-years. During this time some 100 million triggers were recorded.
3.1 Contained Event Selection
In the initial stage of our data analysis a sample of contained events is selected. A contained event is one in which all tracks and the main body of any showers are located within the fiducial volume, defined by a 20 cm depth cut on all sides of the detector. All events are processed by software filters. Events that satisfy the filter criteria are then scanned by physicists to finalize the containment selection. Data events are interspersed with Monte Carlo events so that on an event by event basis the scanner does not know if he or she is scanning Monte Carlo or data. The scanning is performed in two stages with three independent scans carried out at each stage. The contained event selection is fully described in References [6, 10].
The Monte Carlo sample used in this analysis is 5.45 times the size of the expected neutrino sample. The Monte Carlo simulates neutrino interactions in the detector; background processes are not simulated. The Monte Carlo detector simulation reproduces the actual performance of the Soudan 2 detector to a high degree of accuracy. The real detector geometry is simulated, as are local variations in the detector performance, particularly pulse height and drifting. Background noise in the detector is included by overlaying Monte Carlo events onto randomly initiated triggers generated throughout the exposure of this data set. For the first 2.2 kton-yrs exposure the MC and data events were combined prior to the scanning while for the latter 1.7 kton-yrs exposure Monte Carlo events were inserted into the data stream during data acquisition at the Soudan mine. Data and MC events are analyzed identically at each stage of the data reduction.
3.2 Flavor Classification
During scanning, events are classified into one of three categories: single track, single shower, and multiprong. The single track category is further subdivided into mu-like tracks and protons as described in the following paragraph. The track and shower categories include primarily and quasi-elastic scattering respectively; they are largely equivalent to the ‘single ring’ category in the water Cherenkov experiments. In addition to the lepton, events in these categories may contain recoil nucleons at the vertex and/or small showers from muon decay at track endpoints. Events with two or more particles (other then recoil nucleons) emerging from the primary vertex, or single track events which are charged pions having visible scatters, are classified as multiprong.
Proton tracks can be identified because they are straight and highly ionizing. All tracks are fitted to a straight line trajectory and the track residual and average pulse height are calculated. Tracks with low fit residuals and high average pulse height are classified as protons. There is some overlap between protons and short, low energy muons where most of the observed track has . The separation algorithm is tuned to minimize the incorrect tagging of muons as protons. Muon tracks are incorrectly classified 4% of the time and 80% of protons are correctly identified.

Figure 1 shows the track residual versus average pulse height for MC tracks (mostly muons) and recoils (mostly protons).
4 The Flavor Ratio
4.1 Shield Classifications
Contained events are a mixture of neutrino interactions and background processes. Neutral particles which are produced by the interaction of cosmic ray muons in the rock surrounding the detector cavern are the principal source of background. These particles (neutrons and photons) can produce contained events if they travel into the fiducial volume of the detector before interacting. Such events are usually accompanied by large numbers of charged particles which strike the active shield located at the cavern walls. The presence of shield activity accompanying a contained event therefore provides a tag for background events.
The shield information allows us to identify two separate event samples in our data. An event with zero shield hits is referred to as ‘gold’; such an event is a neutrino candidate. Events with two or more shield hits are referred to as ‘rock’ events; they comprise a shield-tagged background sample. Table 1 gives the number of ‘gold’, ‘rock’, and Monte Carlo events in each of the scanned categories. Data events with one shield hit are a mixture of neutrino events with a random shield hit, stopping muons that pass the containment tests, and multiple shield hit events where shield hits are missing due to shield inefficiency. Consequently the single shield hit events include both neutrino signal and backgrounds, and we have excluded them from our analysis. The loss of neutrino events due to random shield hits is simulated by rejecting Monte Carlo events with shield hits in the randomly triggered background event.
4.2 Background Corrections
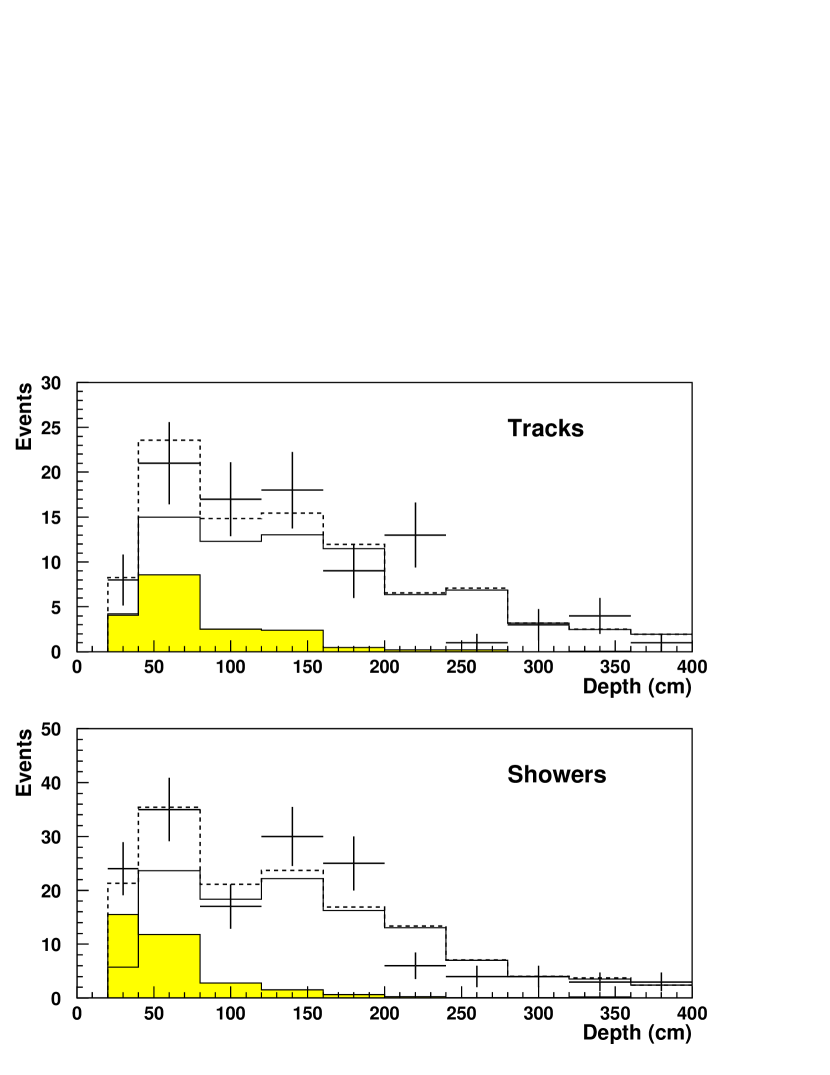
It is possible that some muon interactions in the rock produce contained events unaccompanied by shield hits, due either to shield inefficiency or because the interaction did not produce any charged particles which entered the shield. The number of such interactions is determined by examining the distributions of event depths in the detector, where the event depth is defined as the minimum distance between the event vertex and the detector exterior, excluding the detector floor. These are shown in Figure 2.
| Event | Track | Shower | Multi- | Proton |
|---|---|---|---|---|
| Type | prong | |||
| Gold | 95 | 151 | 125 | 49 |
| Rock | 278 | 472 | 232 | 277 |
| MC | 749 | 729 | 711 | 82 |
We fit the depth distributions to determine the amount of background present in the gold sample. An extended maximum likelihood (EML) fit, that correctly handles bins with small numbers of events, is performed which describes the data distributions as a sum of background and neutrino distributions. The shapes of the neutrino and background depth distributions are obtained from the MC simulation and the rock samples respectively. From the rock sample, we have determined that the track/shower ratio for background is . We have previously shown that the track/shower ratio of the background does not vary as a function of shield hit multiplicity [6]. We therefore expect background present in the gold (zero shield hit) sample to occur in this same track/shower ratio and we include this expectation as a constraint in the fit. Since the ‘flavor ratio’ in the background is very similar to that measured for neutrino events, background subtraction does not produce a large change in our measured ratio.
Early data had some contamination of the shower sample from electrical breakdown inside the modules. A cut requiring at least 9 hits on all showers was used to remove this contamination. A minimum of 6 hits were required on all tracks.
5 The Flavor Ratio
The results of the depth fits are that of the gold tracks and of the gold showers are due to neutrino interactions.
We use these numbers to calculate the background corrected atmospheric neutrino flavor ratio. Table 2 shows the flavor ratios with and without (‘raw’) the background subtraction.
| Number of Gold Tracks | 95 |
|---|---|
| Number of Gold Showers | 151 |
| Number of MC Tracks | 749 (137.4) |
| Number of MC Showers | 729 (133.8) |
| Corrected Number of Tracks | |
| Corrected Number of Showers | |
| Raw Value of R | |
| Corrected Value of R |
The systematic error due to the background subtraction has two components.
-
1.
Many of the single tracks in the background sample are protons, which come from neutrons entering the fiducial volume of the detector and elastically scattering. Hence the proton classification, which removes single protons from the track sample and places them in a separate category, serves as a background correction even before the depth fits are performed. An alternative approach to the one we have taken is to leave the single protons in the track sample and determine the amount of background solely from the depth fits. The resulting value for the flavor ratio differs from our main value by ; the full difference is taken as a component of the systematic error.
-
2.
Our method assumes that any background present in the gold sample behaves identically to the shield-tagged background of the rock sample. We have investigated how the results change if this assumption is not valid. For instance, if the zero-shield hit shower background has a different depth distribution than the rock shower sample then the depth fit (which assumes the rock distribution for the background) will incorrectly estimate the amount of background present. We have considered a number of such effects and have determined the resulting uncertainty on R to be .
The total error on R due to the background subtraction can be obtained by adding these two contributions in quadrature: . Systematic errors due to the uncertainty in the expected flavor ratio, Monte Carlo, and scanning procedure are calculated to be [6]. Here we have taken the systematic uncertainty in the expected flavor ratio to be . Adding this in quadrature to the error from the background subtraction results in a total systematic error of . Our primary measurement of the flavor ratio is therefore R = .
6 Alternative Analysis Methods
We have used two other methods to determine the flavor content of the atmospheric neutrino flux.
6.1 Multivariate Discriminant Analysis
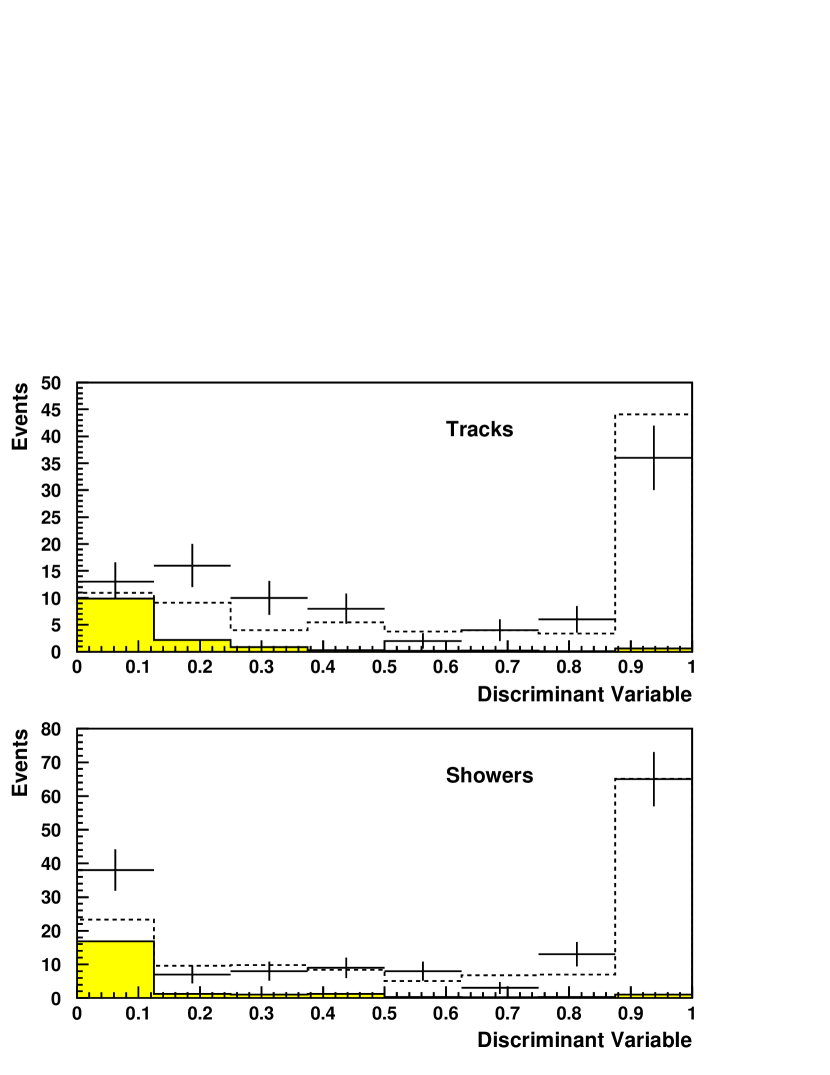
This method uses the same event sample as the main analysis but uses additional event variables to provide discrimination between background and neutrino interactions. There are several quantifiable differences between background events and neutrino events. In comparison with neutrino interactions, background events are (on average) closer to the detector exterior, of lower energy, traveling preferentially downward, and are more likely to be traveling into the detector (rather than outward). The corresponding variables are the event depth, energy, zenith angle, and ‘inwardness’ (defined as the cosine of the angle between the event direction and the inward-pointing normal vector to the nearest face of the detector). These event variables are combined, using the method of multivariate discriminant analysis [11, 12], to form a single variable.
Figure 3 shows the distributions of the discriminant variable for MC neutrino, rock, and gold events. The improved discrimination between the expected neutrino and rock distributions is clearly visible in the first and last bins. A fit of the discriminant variable distributions for the gold events to a sum of the distributions for rock and Monte Carlo events then gives the amount of background for track and shower events separately and thus a value of R. The track/shower ratio in the background sample is again used to provide a constraint on the zero shield hit background determined from the fit, as in the main analysis. The result of the fit, using the four variables described above is (stat. only).
Unlike the event depth, the distributions of other variables in this analysis would be influenced by possible new physics. This analysis therefore should only be regarded as a test of the null hypothesis, i.e. no new physics, for which the value expected is R=1.0.
6.2 Automated CEV Selection and Flavor Determination
A third analysis that uses software for both event selection and flavor determination has been developed and is described in detail elsewhere [13]. It has been applied to a subsample of the data corresponding to a 2.7 fiducial kiloton-year exposure. Since this method has been applied to a smaller data set and the contained event selection is done differently, the event sample used in this analysis is not identical to that used in the main analysis. The important virtues of this method are that it almost entirely eliminates the role of subjective decisions and permits the use of much larger Monte Carlo samples. The shield is used to separate data events into neutrino candidates (GOLD events) and a background sample (ROCK events), using the same principles as in the main analysis. The ‘GOLD’ and ‘ROCK’ samples here are not the same as the gold and rock samples described previously since the contained event samples are different and shield information is used differently. Events are required to have more than 10 hits. The distinction between track and shower events is made on the basis of , a variable derived from a spherical harmonic analysis of inter-hit correlations in each event. Figure 4 shows distributions of for the data and all true and interactions as given by the Monte Carlo. All events are included and no attempt is made to distinguish neutral current interactions, inelastics and quasi-elastics. From the Monte Carlo we expect neutral current interactions to account for 12% of the events in the final data sample.
Events are separated into ‘-like’ and ‘-like’ sub-samples by application of an energy dependent cut on . Of interactions (neutral and charged current), 78.3% are correctly tagged as -like while 80.7% of interactions are correctly tagged as -like.
A depth fit is performed to the GOLD data in terms of a combination of ROCK and Monte Carlo distributions [13]. The results of this procedure are summarized in Table 3. The ratio of ratios is (stat.)(syst.). This figure is calculated using all events: quasi-elastic, inelastic and neutral current.

| -like | -like | |
| Monte Carlo | 17353 | 15915 |
| Rock | 328 | 410 |
| Contained Events | 109 | 171 |
| due to -interactions | ||
| due to Rock |
7 Conclusion
The flavor ratio of atmospheric neutrinos (data/MC) has been measured from a 3.9 fiducial kiloton-year exposure of the Soudan 2 detector to be . This result is obtained after applying a background correction to a sample of 246 quasi-elastic neutrino candidates. The probability of a statistical fluctuation to R=0.64 or below is less than . Two other independent analyses have been performed. These check the contained event selection, flavor determination, and background correction procedures of our main analysis. Both alternative analyses confirm the validity of the main analysis. The good agreement of these three rather different methods gives confidence that the effect is not an artifact of a particular analysis. This measurement is in good agreement with the previously published result from this experiment as well as the results from the water Cherenkov experiments.
Acknowledgements
This work was undertaken with the support of the U.S. Department of Energy, the State and University of Minnesota, and the U.K. Particle Physics and Astronomy Research Council. We would also like to thank: the Minnesota Department of Natural Resources for allowing us to use the facilities of the Soudan Underground Mine State Park; the staff of the Park, particularly Park Managers P. Wannarka and J. Essig, for their day to day support; and Messrs B. Anderson, J. Beaty, G. Benson, D. Carlson, J. Eininger and J. Meier of the Soudan Mine Crew for their work in the installation and running of the experiment.
References
- [1] Kamiokande Collaboration: K.S. Hirata et al., Phys. Lett. B 205 (1988) 416. Kamiokande Collaboration: K.S. Hirata et al., Phys. Lett. B 280 (1992) 146. Kamiokande Collaboration: Y. Fukuda et al., Phys. Lett. B 335 (1994) 237.
- [2] IMB Collaboration: D. Casper et al., Phys. Rev. Lett. 66 (1991) 2561. IMB Collaboration: R. Becker-Szendy et al., Phys. Rev. D 46 (1992) 3720.
- [3] SuperKamiokande Collaboration: Y. Fukuda et al., Phys. Rev. Lett. 81 (1998) 1562.
- [4] NUSEX Collaboration: M. Aglietta et al., Europhys. Lett. 8 (1989) 611.
- [5] Frejus Collaboration: K. Daum et al., Z. Phys. C 66 (1995) 417.
- [6] Soudan 2 Collaboration: W.W.M. Allison et al., Phys. Lett. B 391 (1997) 491.
- [7] Soudan 2 Collaboration: W.W.M Allison et al., Nucl. Instrum. Methods A 376 (1996) 36.
- [8] Soudan 2 Collaboration: W.W.M Allison et al., Nucl. Instrum. Methods A 381 (1996) 385.
- [9] W.P. Oliver et al., Nucl. Instrum. Methods A 276 (1989) 371.
- [10] H. Gallagher, Neutrino Oscillation Searches with the Soudan 2 Detector, PhD Thesis, University of Minnesota (1996).
- [11] R. Granadesikan, Methods for Statistical Data Analysis of Multivariate Observations, 2nd ed., Wiley (1997).
- [12] J. Schneps, ‘Multivariate analysis of atmospheric neutrino data: Part 1 - The ratio of ratios’, Soudan 2 Internal Memo PDK-690, Nov. 1997, unpublished.
- [13] A. Stassinakis, A Study of the Atmospheric Neutrino Content Using the Soudan 2 Detector, D. Phil Thesis, Oxford University (1997). W.W.M Allison et al., ‘Atmospheric Neutrino Flavour Detection in the Soudan 2 Detector, a New Experimental Analysis’, in preparation .