Observation of the decay
Abstract
The reaction has been studied with SND detector at VEPP-2M collider in the vicinity of the meson resonance. The observed interference pattern in the energy dependence of the cross section is consistent with existence of the decay with a branching ratio of
The real and imaginary parts of the decay amplitude were measured. The decay was observed for the first time.
PACS: 13.65.+i,14.40.Cs
1 Introduction
Recently in experiments with SND and CMD-2 detectors at VEPP-2M collider the study of -meson rare decays with branching ratios of 10-4–10-5 became available [1, 2, 3]. One of such decays is an OZI and G-parity violating decay. The predicted branching fraction of this decay is of the order of [4, 5]. It varies within wide limits depending on the nature of , and -meson mixing and existence of direct transition. Since the nonresonant cross section of the process in the vicinity of the -meson peak is relatively large, the decay reveals itself as an interference pattern in the cross section energy dependence. This allows to extract from the data both real and imaginary parts of the decay amplitude.
2 Experiment
The experiment was carried out with SND detector at VEPP-2M in 1996–1997. SND is a general purpose non-magnetic detector [6], based on 3.6 t three layer spherical electromagnetic calorimeter with 1620 NaI(Tl) crystals covering 90% of solid angle. The energy resolution for electromagnetic showers is , the angular resolution is about 1.5∘. The angles of charged particles are measured by two cylindrical drift chambers covering 95% of solid angle. The angular accuracy of charged track measurements is about 0.4∘ and 2.0∘ in azimuth and polar directions respectively.
Seven successive data taking runs were performed at 14 energy points in the energy range 2E=980–1060 MeV. The total integrated luminosity L=3.7 corresponds to produced mesons. The integrated luminosity was measured using and reactions with the accuracy of 3%.
3 Event selection
For a search for the decay we studied the cross section of the process
| (1) |
in the vicinity of the -meson. Events with two charged particles and four or more photons were selected for analysis. To suppress beam background the production point of charged particles was required to be within 0.5 cm from the detector center in the azimuth plane and 7.5 cm along the beam direction (the longitudinal size of the interaction region is about 2 cm).
Since for the process under study a probability to find spurious photons in the events is rather large (about 15%), nearly all main -meson decays are a source of background in our search:
| (2) |
| (3) |
| (4) |
| (5) |
The main source of the nonresonant background is the process
| (6) |
which has the same final state as the process (1), but without the intermediate state. The interference between the processes (1) and (6) is significant only in the small part of the decay phase space, where invariant mass is within the -meson width. Estimated contribution of the interference term in the energy region under study does not exceed 2% of the cross section of the process (1) and was neglected in the further analysis. It was treated instead as an additional source of systematic error in the nonresonant cross section of the process (1).
To suppress the background from the processes (2) and (3), the following cuts were imposed:
-
•
average losses in the drift chamber , where are average losses of a minimum ionizing particle;
-
•
the spatial angle between charged particles is less than .
The first condition suppresses events of the process (2) with slow () charged kaons having large losses in the SND drift chamber. The second condition suppresses events from the process (3) with a minimum angle between pions from the decay close to 150 degrees.
For each selected event independent kinematic fits were performed under three following assumptions about the reaction mechanism:
-
1.
The event originates from the process . The value of the likelihood function is calculated.
-
2.
The event originates from the process . The photon recoil mass is calculated.
-
3.
The event is due to the process . The value of the likelihood function is calculated together with – the recoil mass of the -meson closest to the -meson mass.
In the events where the number of photons exceeds that required by a certain hypothesis, extra photons are considered as spurious ones and rejected. To do that all possible subsets with a correct number of photons were tested and the one, corresponding to a maximum likelihood of a certain hypothesis, was selected.
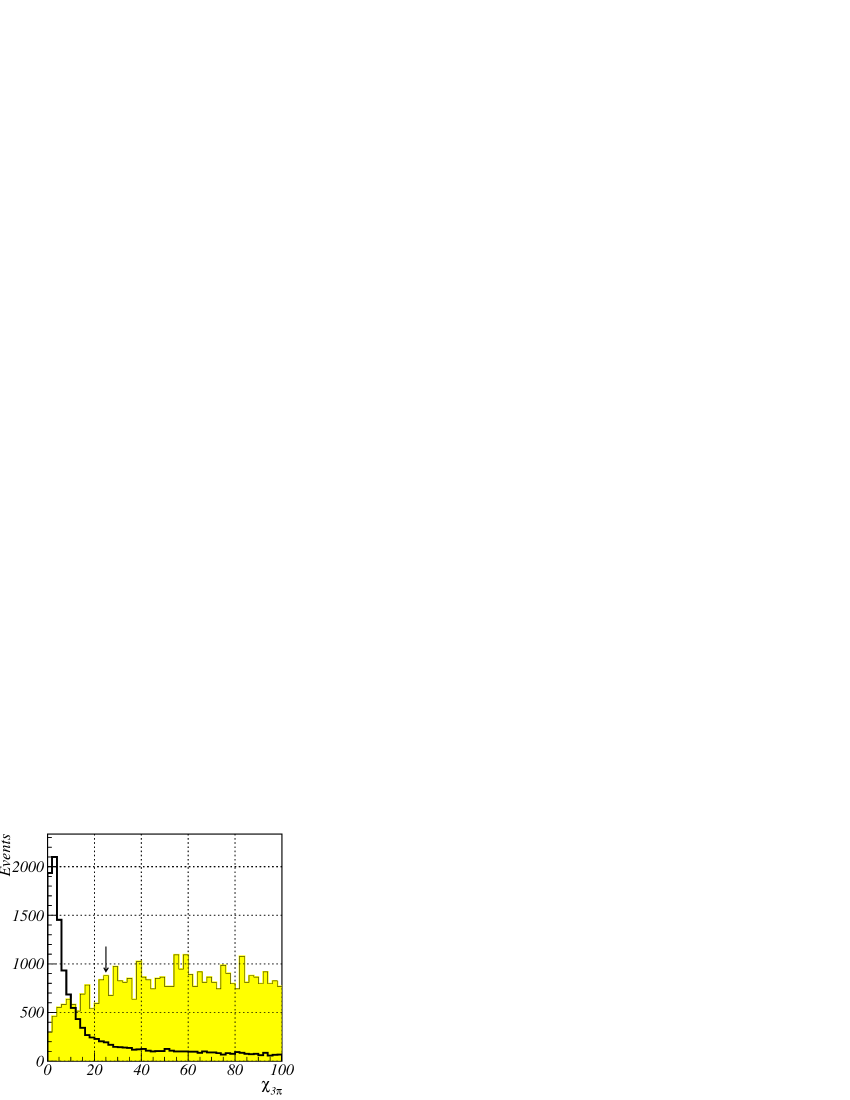
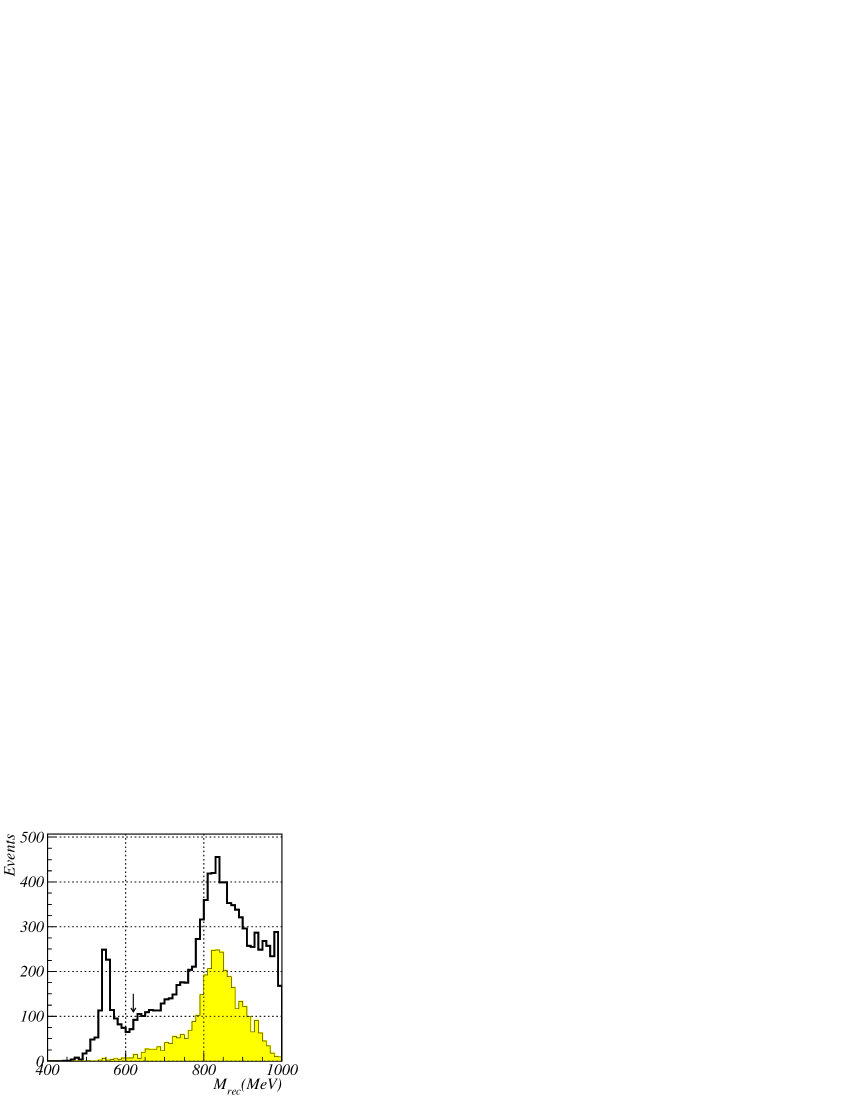
The distribution of experimental and simulated events of the process (1) over the parameter , is shown in Fig. 1. One can see a considerable contribution from the process (4), producing a peak at low . Fig. 2 shows the experimental spectrum, where a clear -meson peak from the reaction (5) is seen. To suppress the background from the processes (4) and (5) the following cuts were applied:
4 Data analysis
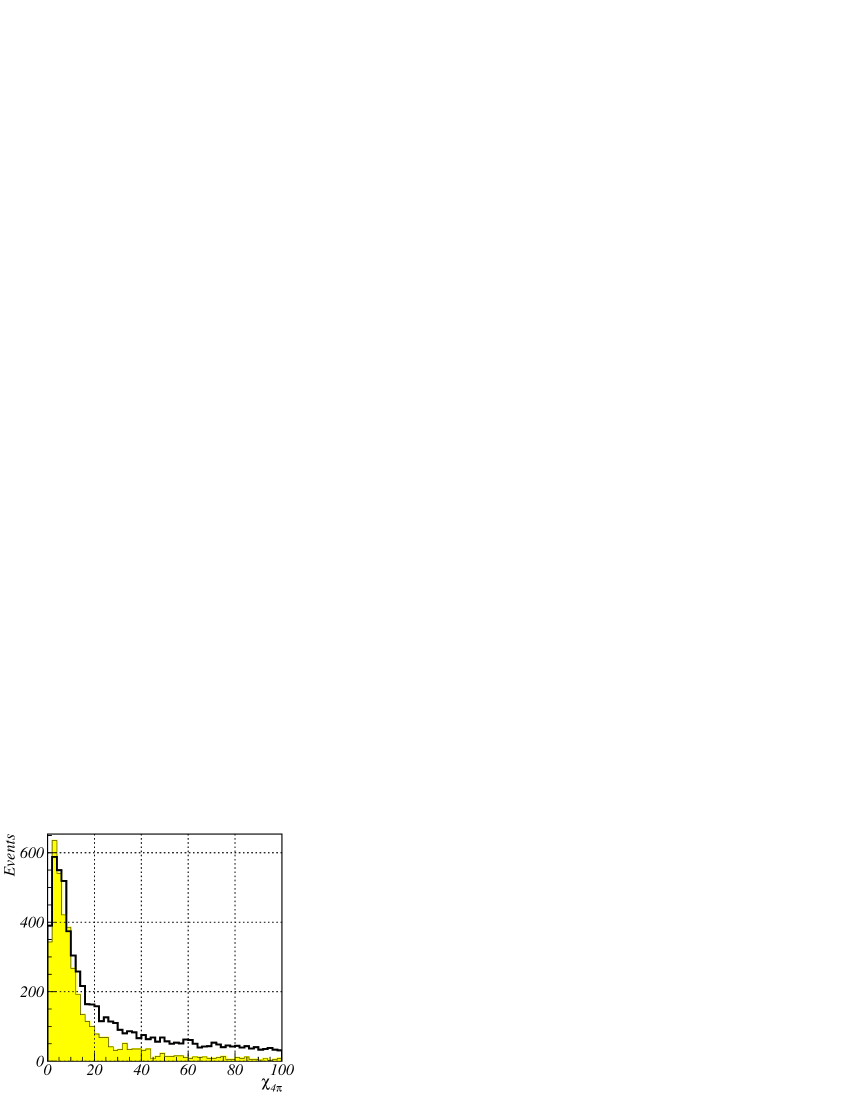
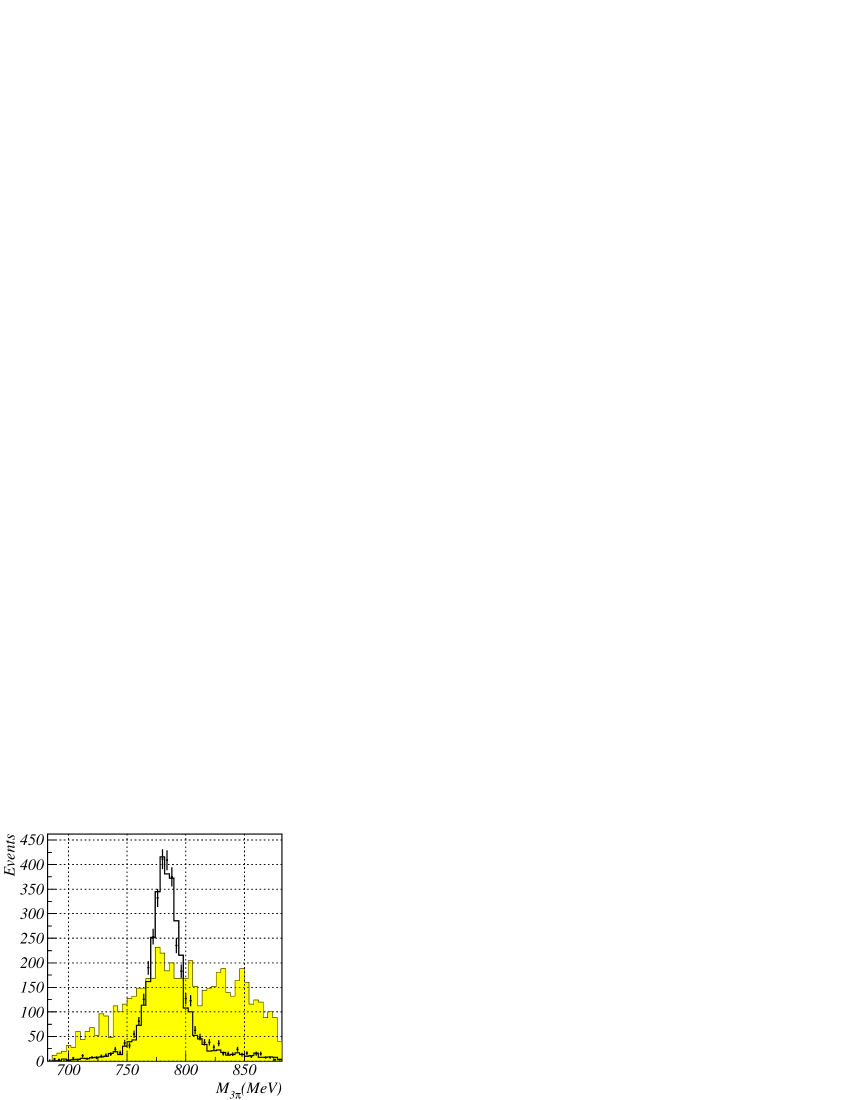
Figure 3 shows the distribution of experimental and simulated events of the process (1) over . Considerable difference between the tails of measured and simulated spectra indicates the presence of a background surviving the cuts. One can see that the experimental peak in Fig. 3 is broader than a simulated one. It means that the simulation of the distribution is not precise. In Fig.4 the distributions over the recoil mass for experimental events with , simulated events of the process (6) (the mechanism was assumed), and simulation of the process (1) with the 11% admixture of the process (6) are presented. The last distribution is in good agreement with the experimental one. For further analysis two additional cuts were applied:
The total of 4500 events which survived the cuts were divided into 4 classes:
-
1.
;
-
2.
;
-
3.
;
-
4.
;
with the relative populations of 0.69:0.09:0.16:0.06 respectively.
The visible cross section for each class was fitted according to the following formulae:
| (7) |
Here , are the visible cross sections of the processes (1) and (6), , are the probabilities for events of the processes (1) or (6) to be found in the -th class ( and at ), is the visible cross section of the resonant background in the -th class, is the nonresonant cross section of the process at , is its slope, is the detection efficiency for the process (1) at , is the complex interference amplitude, , are the mass, width and -meson propagator function respectively, is the branching ratio of the decay[9], is a radiative correction calculated according to [8].
The fitting was performed for all 4 classes simultaneously. The class 1 with a small resonant background was the most important for the determination of , , . Classes 2–4 were used to determine the background from decays: , , . In the fit it was assumed that for the resonant background the distribution over is independent of , and therefore the background for the class 1 can be obtained from the expression: . The validity of this relation was checked with the statistical accuracy of 15% for simulated events and specially selected experimental events of the processes (2)–(5). The cross section of the resonant background in the resonance maximum was found to be , that is about 4% of the visible cross section in the class 1.
The contribution of the process (6) was determined using the value of the nonresonant part of the cross section in the class 2 and the ratios and , obtained from simulation. The cross section was fitted by a sum of a linear function and an interference term similar to in the expression (4). For the OZI-rule and G-parity double suppressed decay, the main mechanism is a transition of the meson into via a virtual photon. The calculated real part of the interference amplitude due to this decay mechanism is equal to 0.127. In the fit the real and imaginary parts of the interference amplitude of the process (6) were set to 0.127 and 0.0 respectively, while their errors were set to 0.07 and 0.15 in agreement with the accuracy of theoretical estimations and experimental data on another double suppressed decay . The nonresonant cross section (6) was found to be equal to % of the cross section of the process (1). In the class 1 the contribution of this process is smaller: .
Since the simulated distribution over the may differ from the experimental one, the coefficients and were determined from the fit. Other coefficients and were derived from the relations described above, with the additional assumption that the distributions over in the processes (1) and (6) are the same. The coefficients , vary slowly with energy, and their energy dependence approximated by linear functions was obtained by simulation.
The detection efficiency for the process (1) was also obtained from simulation. To estimate a systematic error in , we processed data with softer cuts and studied the class of events with one charged particle and four photons. It was found, that the detection efficiency obtained by Monte Carlo simulation must be corrected by -11%. The correction is mainly due to the inaccuracy in the simulation of distribution and loss of charged particles during track reconstruction. With this correction, the detection efficiency is equal to with a systematic error of 10%.
The total number of fit parameters describing energy dependence of the cross sections in all 4 classes of selected events is 11. For each class the cross section was measured in 14 energy points. At the following values of main fit parameters were obtained:
| (8) | |||
where the first error is a statistical one obtained during the fitting, and the second is systematic to be discussed below.
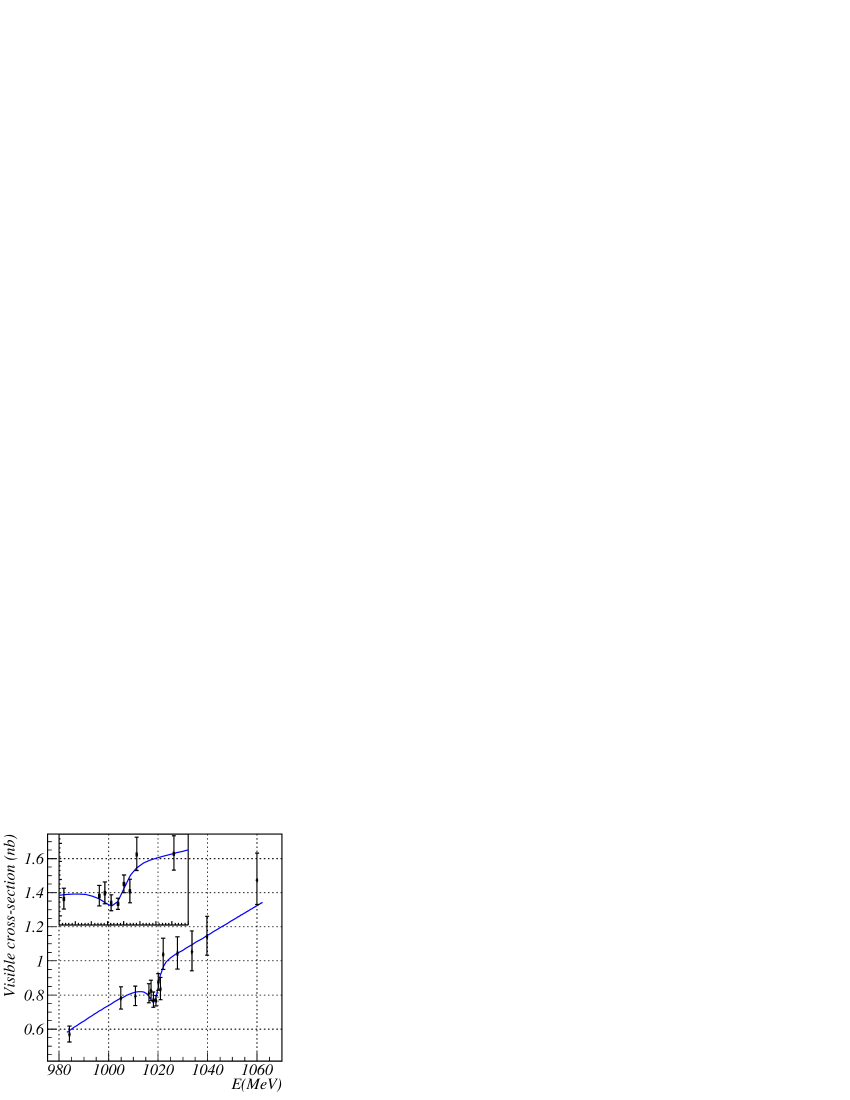
The visible cross section for the class 1 and the fitted curve are shown in Fig. 5. Despite a 4% resonant background, the interference pattern is clearly seen. Another representation of the interference amplitude is with
| (9) | |||
The branching ratio for the decay can be obtained from the following relation:
where nb is the cross section in the -meson peak [9].
The following sources of systematic errors were considered: inaccuracy of the detection efficiency estimation, interference between the processes (1) and (6), contribution from the nonresonant reaction, inaccuracy of Monte Carlo simulation of the distribution, and possible deviations from linear energy dependence of the nonresonant cross section. The total systematic error in the nonresonant cross section was estimated to be 11%. It is determined mainly by the 10% uncertainty in the detection efficiency.
Of the factors listed above, the main systematic error in the measured interference amplitude is introduced by a possible nonlinearity of the energy dependence of the cross section of the process (1). It is equal to 4% for and 7% for . Other factors contribute to only at a level of 2%. This nonlinearity also determines the error in the slope .
To estimate systematic errors caused by a possible detector instability during lengthy data taking, we divided data into three subsets and processed them separately. It was found that all three subsets are consistent with the fit obtained from the summary data. The fit parameters obtained from each subset agree well with each other and with (4). To check the stability of the obtained results, we loosened cuts: for the parameter the cuts 50 and 100 were used instead of 20 and 40, for the parameter – 50 and 100 instead of 35 and 100. As a result, the detection efficiency increased up to 20% and the resonant background in the maximum became nb, that is 20% of the visible cross section (1). However the obtained interference amplitude was , which does not contradict (4), thus confirming the validity of the background subtraction procedure. As a final result we take (4), because it was obtained with a lower resonant background. The difference between the results was considered as an estimate of the systematic error of the resonant background subtraction. Thus, the total systematic error of the interference amplitude is equal to 6% for and 8% for .
5 Conclusion
The nonresonant cross section of the process obtained in this work is in agreement with our old result [10] on the neutral -meson decay mode: = nb. The measured nonresonant cross section is almost twice higher than the expected value, calculated with only transition taken into account. The agreement may be significantly improved if the known radial excitations of the meson are taken into account.
The measured interference amplitude (4) is close to the lower limit of theoretical predictions [5], although contributions from radial excitations of not considered in [5], may affect its value. Another important remark is a small value of the measured real part of the interference amplitude , which could be hardly explained by the standard mixing model [5]. For example, the value of predicted in [4] for the branching ratio of the decay , is 1.5 times higher than one measured in this work.
The interference amplitude (9) measured in this work is five standard deviations above zero. Thus, we claim the existence of the decay with the branching ratio of
6 Acknowledgement
The authors are grateful to S.I.Eidelman for useful discussions and valuable comments. This work is supported in part by The Russian Fund for Basic Researches, grants No. 97-02-18561 and 96-15-96327.
References
- [1] S.I.Serednyakov, Proc. of HADRON97, Upton, NY, August 24–30, 1997, pp.26–35.
- [2] M.N.Achasov et al., Preprint Budker INP 97-78, Novosibirsk, 1997, e-print hep-ex/9710017.
- [3] R.R.Akhmetshin et al., Phys. Lett. B 415 445 (1997).
- [4] V.A.Karnakov, Yad. Fiz., 42 1001 (1985).
- [5] N.N.Achasov,A.A.Kozhevnikov, Int. J. Mod. Phys. A 7 4825 (1992).
- [6] V.M.Aulchenko et al., Proc. Workshop on Physics and Detectors for DAFNE, Frascati, April 9–12, 1991, p.605.
- [7] M.N.Achasov et al., Preprint Budker INP 96-47, Novosibirsk, 1996.
- [8] E.A.Kuraev,V.S.Fadin, Sov. J. Nucl. Phys. 41 466 (1985).
- [9] C.Caso et al. (Particle Data Group) Europ. Phys. Jour. C 3 1 (1998).
- [10] S.I.Dolinsky et al., Phys. Reports 202 99 (1991).