GLAS-PPE/98–0716 December 1998
The latest structure function results, as presented at the ICHEP98 conference, are reviewed. A brief introduction to the formalism and the status of global analyses of parton distributions is given. The review focuses on three experimental areas: fixed-target results and their constraints on the parton densities at high ; spin structure and spin parton densities as well as the status of the associated sum rules; HERA results on the dynamics of at low , charm and as well as the measurement and interpretation of the high- neutral and charged current cross-sections.
Plenary talk presented at the XXIX ICHEP98 Conference,
Vancouver, July 1998.
Slides are available from
http://www-zeus.desy.de/conferences98/#ichep98
1 Introduction - Formalism and Road Maps
The differential cross-section for a lepton (, ) with four-momentum scattering off a nucleon with four-momentum can be expressed as
where is the four-momentum transfer squared, is the Bjorken scaling variable, is the inelasticity variable and . The contribution from dominates the cross-section. The contribution from is a QCD correction which is important only at large and that from is negligible for . To investigate sensitivity to at large or at large , the reduced cross-section is adopted. In the Quark Parton Model (or in the DIS scheme of NLO QCD) and for is the charge-weighted sum of the quark densities
where is the singlet summed quark and anti-quark distributions. Similarly, the charged current cross-section at HERA can be expressed as
For fixed-target experiments, , and in the QPM
where is the non-singlet difference of these distributions.
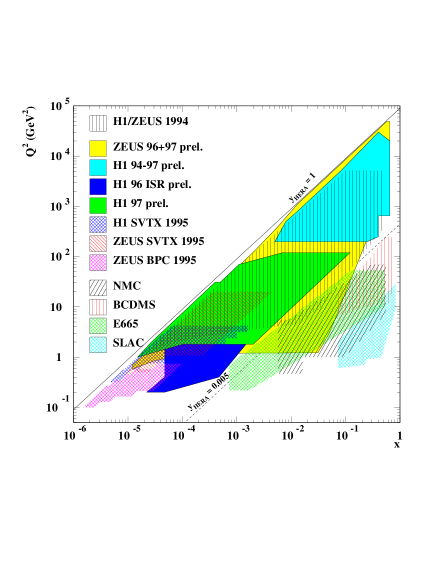
In Fig. 1, the kinematic plane covered by the measurements is shown, including the new preliminary datasets from H1 and ZEUS which are seen to extend to: low () providing overlap with the fixed-target experiments; very low () at low exploring the transition region from soft to hard physics; high () giving sensitivity to ; high probing sensitivity to electroweak effects in and as well as constraining the valence quarks at large . The fixed-target experiments NMC, BCDMS, E665 and SLAC experiments have provided final measurements at higher and lower . New information was presented at ICHEP98 from CCFR, E866 and the Tevatron which also constrain the medium-high partons.
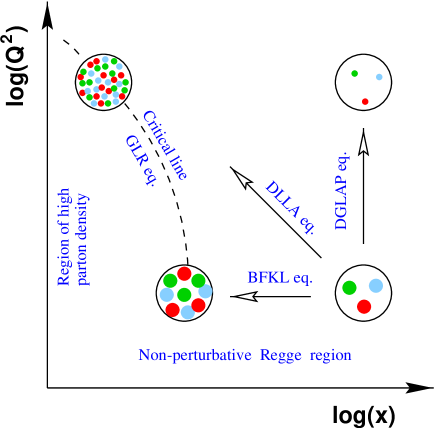
Theoretically, the directions in can be mapped out according to the dominant dynamical effects, as illustrated in Fig. 2. Given a phenomenological input as a function of , the parton distributions are evolved to different physical scales () via the DGLAP evolution equations. The alternative BFKL approach is to attempt to calculate the dependence directly from pQCD, where the running of the effective coupling constant is neglected to leading order. BFKL predicts an dependence of at small . The BFKL equation has recently been calculated to NLO. [1] These corrections are numerically very large in the experimentally accessible low () range, resulting in being reduced to . The understanding of the NLO corrections to the BFKL equation is therefore an active area of study. [2] In the DLLA (‘double leading log approximation’), non-leading terms can also be evaluated, but a method which reliably maps the complete region of in terms of pQCD is still not known. The region of high parton density may be reached at very low , where these approaches are not strictly valid. The expectation from the GLR equation [3] is that the region where the partons overlap is accessible at slightly higher for decreasing . However, should also be sufficiently large that higher twist and non-perturbative effects parameterised in terms of Regge exchanges can be neglected.
In the DGLAP approach, the non-singlet contribution evolves as
where and the ’s represent the NLO DGLAP splitting probabilities for radiating a parton with momentum fraction from a parton with higher momentum . Quantities such as provide a measure of which is insensitive to the a priori unknown gluon distribution. Similarly, the singlet quark and gluon densities are coupled via
and quantities such as provide input for as well as coupled knowledge of and the gluon, .
At the starting scale, , the light valence quarks () and the sea of quark and anti-quarks () as well as the gluon () are attributed a given functional form. For example in the MRST parameterisations
where some parameters are set to 0 or fixed by sum rules and differences of and quarks may additionally be constrained. The heavy quark (sea) contributions are calculated explicitly at NLO and their uncertainty is typically determined by the range allowed for the effective mass of the heavy quark. The measured structure functions are then described by the convolutions of the light quark densities with the appropriate NLO matrix elements.
The outlined procedure defines the structure of a nucleon in terms of its constituent quarks and gluons. However, guided by the new datasets and analyses which were presented to this conference, it should be noted that the following assumptions are made:
-
•
(DGLAP) terms are large compared to (BFKL) terms in the perturbative splitting functions; 111 The study of inclusive quantities such as at small are presently unable to distinguish these BFKL terms. The status of forward jet production searches which enhance sensitivity to these effects is reviewed by J. Huston. [4]
-
•
higher-twist (HT) contributions (suppressed by factors of ) are negligibly small; 222Progress in determining the size of these higher twist and other hadronisation power corrections via infra-red renormalons is reviewed by Y. Dokshitzer. [5]
-
•
Nuclear binding effects are treated as small corrections or ignored in analyses of deuteron data. 333A discussion of diffractive final states in D.I.S including nuclear effects is included in the review by M. Erdmann. [6]
In Table 1, the experimental datasets considered in the MRST analysis are listed along with the underlying physics process and the parton behaviour which is being probed. The experiments denoted by correspond to final measurements reported at ICHEP98. Those denoted by correspond to new preliminary measurements reported at this conference. The latest global fits of MRST [7], GRV98 [8] and CTEQ4 [9] are used here to compare with the data.
| Process/ | Leading order | Parton behaviour probed |
|---|---|---|
| Experiment | subprocess | |
| DIS | ||
| Four structure functions | ||
| (SLAC, BCDMS, | ||
| NMC, E665)∗ | ||
| DIS | (assumed = ), | |
| but only | ||
| (CCFR)∗ | and | |
| DIS (small ) | ||
| (H1, ZEUS)∗ | ||
| DIS () | ||
| NMC, HERA | ||
| (EMC; H1, ZEUS)∗ | ||
| (CCFR)∗ | ||
| at | ||
| (WA70∗, UA6, E706, …) | ||
| (E605, E772)∗ | ||
| (E866, NA51)∗ | ||
| with | ||
| (HERMES) | ||
| at | ||
| (UA1, UA2; CDF, D0) | ||
| asym (CDF)∗ | slope of at | |
| at | ||
| (CDF, D0) | ||
| jet | at | |
| (CDF, D0) |

The output MRST parton distributions evolved to GeV2 are shown in Fig. 3. At this , the expected fractions of the total momentum carried by the valence quarks is 25%() and 10%(). 6%(), 8%(), 5%() and 2%() is carried by the symmeteric sea and 44%() is carried by the gluons.
Incorporating new datasets and theoretical understanding improves the precision with which individual parton densities are known. In particular, uncertainties in at high , at intermediate , at all values, at low and at low , are discussed in the context of the presentations made at ICHEP98.
2 Fixed-Target Results
2.1 Determination of
Gross-Llewellyn Smith (GLS) Sum Rule: The GLS sum rule expresses the fact that there are three valence quarks in the nucleon, subject to QCD corrections
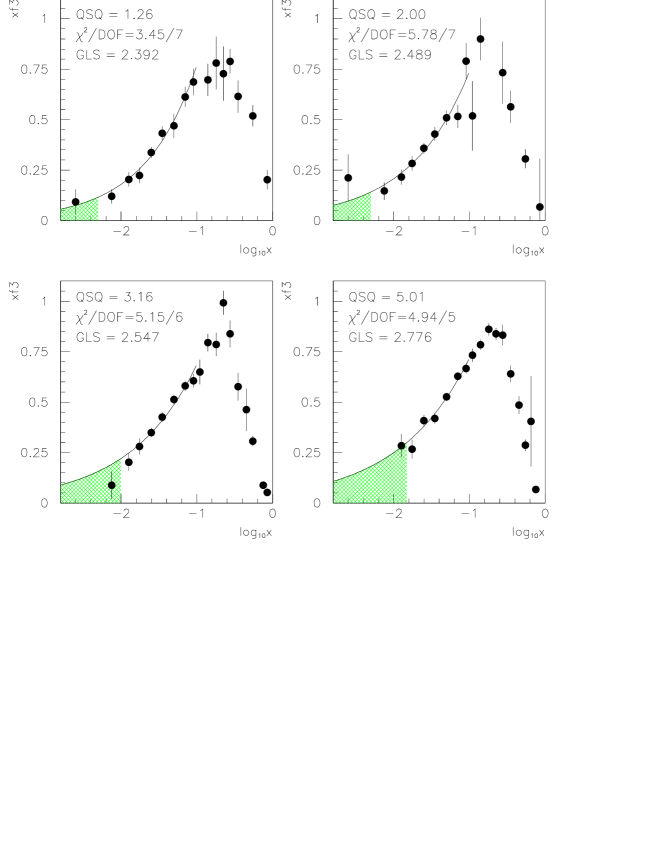
This is a fundamental prediction of QCD which, as a non-singlet quantity, is independent of the gluon distribution. The sum rule has been calculated to and estimated to . [10, 11] The CCFR collaboration have now published their final results, [12] incorporating earlier neutrino measurements (WA25, WA59, SKAT, FNAL-E180 and BEBC-Gargamelle) to determine the GLS sum rule. In Fig. 4, the sum rule is proportional to the area under the data in four regions of .
The analysis of the world data enables GeV to be determined at NNLO () accuracy and evolved to as
The largest contribution to the systematic error is the uncertainty on the ratio of the total neutrino and anti-neutrino cross-sections, which determines the overall normalisation of . This uncertainty will be improved with the NuTeV tagged - beamline. The nuclear target corrections to the GLS sum rule are predicted to be small. [13] The largest theory uncertainty is that associated with the higher twist contribution, GeV2. Here, a renormalon approach, where chains of vacuum polarisation bubbles on a gluon propagator lead to a prediction of the higher twist contribution in the perturbative expansion, predicts a small correction, GeV2. Other models predict significantly larger HT corrections and the uncertainty encompasses this range. The renormalon approach is now rather successful in describing a range of power corrections to hadronic final state variables [5] and leads to a central value of . The most recent analysis of the data determines the same central value with a similar theoretical uncertainty. [14]
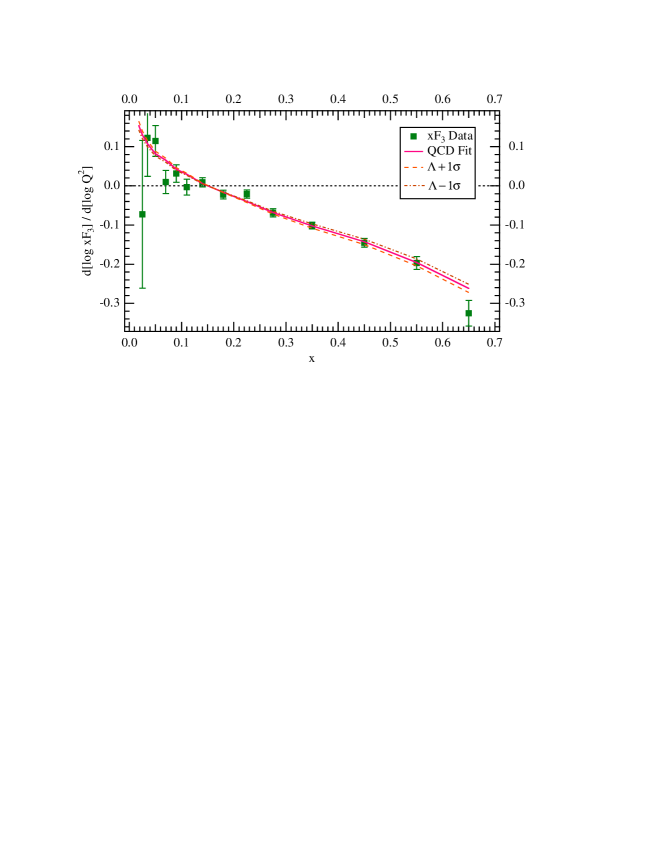
Scaling Violations at Large : The most accurate method to determine from the CCFR data remains the measurement of the scaling violations of the structure functions, and , using a NLO QCD fit. [15] The scaling violation slopes and are shown in Fig. 5. From , the high- gluon is also constrained to be
in agreement with global analyses using prompt photon data. From the combined results on and
which represents one of the most precise determinations of this quantity. This improved measurement is higher than the earlier CCFR value due to the use of a new energy calibration. It is also higher than the SLAC/BCDMS analysis value of . [16] Here it is noted that there is a small but statistically significant discrepancy between the SLAC and BCDMS data (see the points in Fig. 6), which can be resolved if the correlated systematics of the BCDMS data at low are taken into account. The quoted central value of the combined analysis, however, does not take these systematics into account. [18] There is therefore little evidence for any discrepancy with respect to the world average value . [17]
Improved statistics will enable the NuTeV collaboration to determine decoupled from the gluon using the data alone. Further progress in the analysis requires the calculation of NNLO terms in order to reduce the renormalisation and factorisation scale uncertainties. In this way the overall uncertainty on can be reduced to . In this area, there is still an outstanding 20% discrepancy between the CCFR and NMC data in the region of which is discussed in the context of the strange quark sea and the ZEUS preliminary data later. However, this effect is negligible in the determination of , which depends mainly upon the high- data as seen in Fig. 5.
2.2 Nucleon Structure
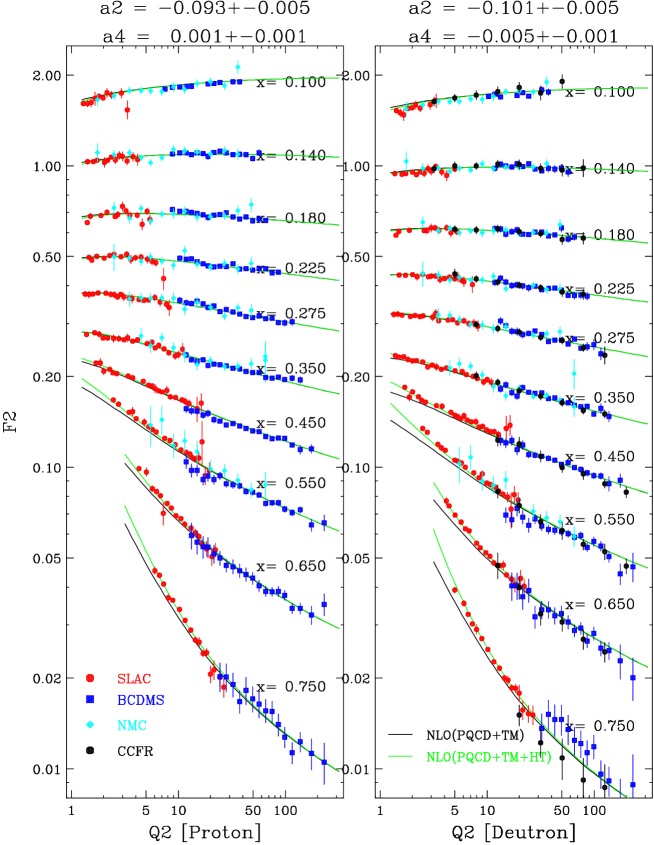
at large : Valence parton distributions at high received attention at this conference provoked by new data and corrections of the ratio from an analysis by U. Yang and A. Bodek. [19] Extractions of from NMC and SLAC deuteron data have previously accounted for Fermi motion but not nuclear binding effects. A physically appealing model by Frankfurt and Strikman [20] assumes that binding effects in the deuteron and heavier nuclear targets scale with the nuclear density. This nuclear binding correction is about 4% at for fixed-target deuteron experiments, which is parameterised as an additional term added to the MRS(R2) PDF. This is sufficient to increase the distribution significantly at high GeV2 by about 40% at , due to DGLAP evolution of the partons. The modification gives an improved fit to the NMC deuteron data. It is compelling in that this simple modification now improves the description of high- CDHSW data (not shown) as well as the new data on the asymmetry from CDF (probing intermediate values) and the charged current cross-sections from ZEUS (see later), data which are free from nuclear binding effects.
The world and fixed-target data at high is plotted in Fig. 6. Here the NLO pQCD calculation incorporates target mass (TM) effects determined using Georgi-Politzer scaling where the scaling variable is replaced by as well as the correction for nuclear binding effects for the deuteron data. The description of the low data is significantly improved () if higher twist (HT) corrections are incorporated as indicated by the fit denoted NLO(pQCD+TM+HT). [19] A good description is also obtained for the very high SLAC DIS data (not shown) up to , although there is some residual dependence in the resonance region (). The renormalon approach [21] therefore successfully predicts the dependence of the higher twist terms although the normalisation constant is half of the previously estimated value. This renormalon approach also successfully describes the dependence of (not shown). In a NNLO fit this higher twist contribution tends to zero which suggests that the non-singlet higher twist contribution (relevant for ) is also small, as discussed in relation to the GLS sum rule. In addition, new measurements of , covering the range of from CCFR were presented which are in agreement with those from EMC, BCDMS and SLAC and extend the kinematic range up to GeV2. [22]
As can be seen in Fig. 3, the quarks in the proton carry more momentum on average than the quarks. (The quarks carry only slightly more momentum than the quarks at high .) and production in collisions is primarily due to the annihilation processes and . On average the ’s are therefore produced relatively more forward than the ’s. CDF [23] measure the lepton asymmetry from the decays,
where are the cross-sections for decay leptons as a function of lepton rapidity relative to the proton beam direction. The decay to leptons tends to reduce the asymmetry at forward but in a well-defined manner (assuming the decays proceed via a SM V-A interaction). In Fig. 7, the final results from runs Ia and Ib are shown compared to various PDF’s using the DYRAD NLO calculations. The best agreement with the data is obtained using the modified MRS(R2) or the MRST PDF (not shown), which incorporates this data as input, indicating that the ratio of is larger than previously thought.

at intermediate : The structure function measurements constrain the sum of and but not the difference. The classic method to constrain this difference is via the Gottfried sum rule where
The NMC result for extrapolated over all gives , significantly below 1/3. [24] It should be noted however that the deuterium data used to derive are not corrected for the effects noted above. This correction is estimated to be i.e. 50% of the uncertainty. [25]
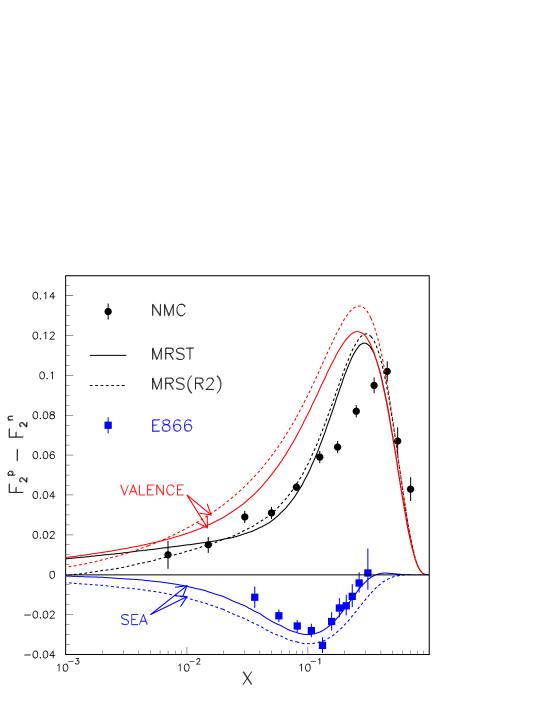
At this conference, the E866 data were reported, [26] which provide a significant constraint on the ratio of via the measurement of Drell-Yan dimuons with mass GeV from 800 GeV protons on proton and deuterium targets as shown in Fig. 8. Here, the ratio of is measured as a function of the reconstructed momentum fraction of the target quark in the range . The MRST calculations incorporate a direct parameterisation of in order to fit the data. Earlier PDF’s such as MRS(R2) clearly overestimate this asymmetry but a sea is still ruled out.

The E866 data require an overall decrease of the sea compared to the MRS(R2) parameterisation. This is seen in the lower part of Fig. 9 where the E866 data are plotted as the sea contribution to , which contributes negatively to , evolved to the NMC values. The NMC data are plotted in the upper plot, compared to the valence as well as the summed contribution for the MRST and MRS(R2) partons. Although the valence and sea distributions differ, these distributions give similar results for the total . However, it is clear that the agreement of the NMC data with either parameterisation is poor at intermediate , which would require additional changes to the valence quark distributions. The MRST NLO fits determine , above the NMC measured value discussed earlier. This discrepancy is induced in part by the inclusion of the E866 data in the fit.
A further constraint is provided via the HERMES semi-inclusive measurement of the ratio of the differences between charged pion production for (unpolarised) proton and neutron (3He) targets
also reported at this conference. [28] The ratio is observed to scale as a function of the fragmentation scaling variable and the data are used to constrain at leading order as a function of , as shown in Fig. 10a. Using the PDF’s to constrain the valence quarks, the distribution obtained from the E866 and (lower ) HERMES data are shown to be in agreement in Fig. 10b.
Generically, the Pauli exclusion principle, suppresses production of sea quarks at large due to the additional quark. Hence the excess of over is a direct consequence of the excess of over . The currently favoured dynamical approach is to include non-perturbative effects from virtual mesons directly from Fock states in a virtual pion model or to derive the sea from the valence quarks coupling to Goldstone bosons (e.g. from ) in a chiral model. [27] In conclusion, the latest data indicate that the ratio of is less than previously thought, a decrease which is correlated with the increase of .

quark contribution: The strange contribution to the quark sea is determined using opposite-sign dimuon events in scattering from CCFR where one muon comes from the lepton vertex and the other results from the semi-leptonic decay of a charmed hadron. The ratio of to and quarks integrated over in an NLO analysis was determined to be . [30] This large uncertainty requires, for example, that NuTeV tag and and take the difference of these cross-sections in order to reduce the uncertainty on , also reviewed at this conference. [31] A second potential method to constrain the strange quark contribution is by comparing and . The analysis of this data was discussed by C. Boros. [29] To leading order the muon (NMC) and neutrino (CCFR) structure functions are related by the “5/18ths rule”
where the ( symmetric) strange sea enters as a correction. However, the CCFR data corrected using the dimuon result to constrain the strange sea lies significantly () above the NMC data for all values of at . Here nuclear shadowing corrections, estimated independently for (CCFR) and (NMC) data, indicate that part of the discrepancy between the two experiments at low may be accounted for in this way. [29] However, there remains a significant discrepancy: the strange quark sea and the relation between and data for is therefore an active area of theoretical and experimental investigation.
3 Spin Structure Functions
Major progress has been made in the last two years in the measurement and QCD analysis of spin structure functions. The second generation CERN and SLAC experiments have been augmented by the HERMES experiment at DESY and these experiments now provide detailed information on the proton, neutron and deuteron spin structure. Here, we discuss measurements of the longitudinal asymmetry
where () is the cross-section when the lepton and nucleon spins are parallel (antiparallel) to each other. This asymmetry takes into account the beam and target polarisations as well as the dilution factor, the fraction of polarisable nucleons in the target. The asymmetry can then be related to the virtual-photon nucleon asymmetries and
where is the depolarisation factor depending upon and is a kinematic factor. The spin structure function
where is a further kinematic factor and is then calculated using the known and values. The term dominates and to a reasonable approximation the extracted structure function is proportional to the measured asymmetry
In the Quark Parton Model
where is the singlet summed quark and anti-quark distributions where () is the quark distribution with the spins parallel (antiparallel) to the nucleon spin. In the QPM is therefore the charge-weighted vector sum of the quark polarisations in the nucleon. Similarly the non-singlet quark distribution , where for 3 light flavours is defined such that this contribution evolves separately from the gluon () and singlet () contributions when QCD corrections are taken into account. The DGLAP formalism outlined earlier can therefore be applied and constrained by via QCD corrections.
The corresponding integrals determine the total spin carried by the quarks at the measured . In the QPM, below charm threshold
and, by isospin symmetry
Beyond the QPM, the total spin of the nucleon can be written as the sum of the contributions from its constituents
where the ’s correspond to the intrinsic spins and the ’s correspond to the angular momentum of the quarks and gluons. The proton spin puzzle is that only a fraction of the total spin is due to quarks. This puzzle remains, but first steps have now been taken to constrain the gluon contribution via the scaling violations of and the valence and sea quark contributions via semi-inclusive measurements.
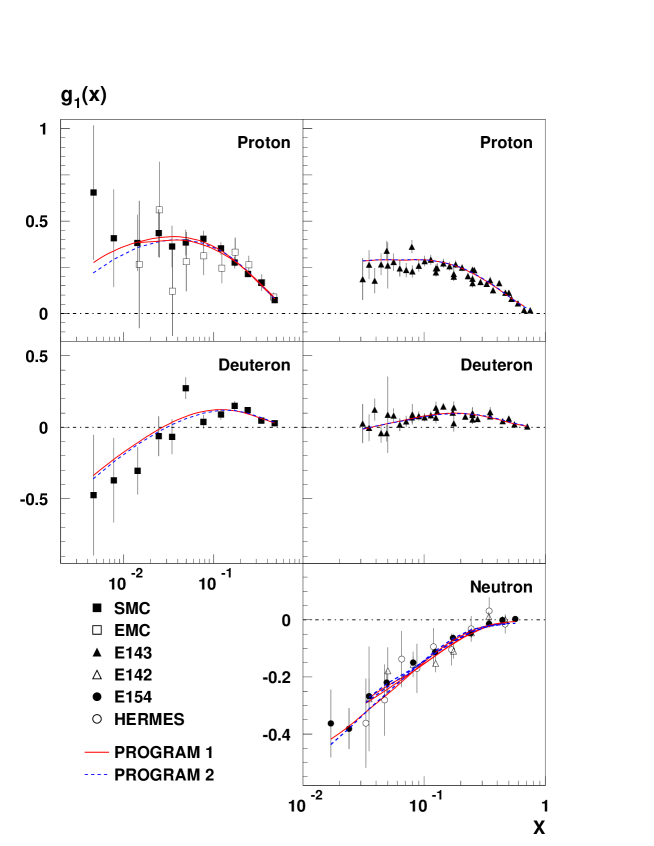
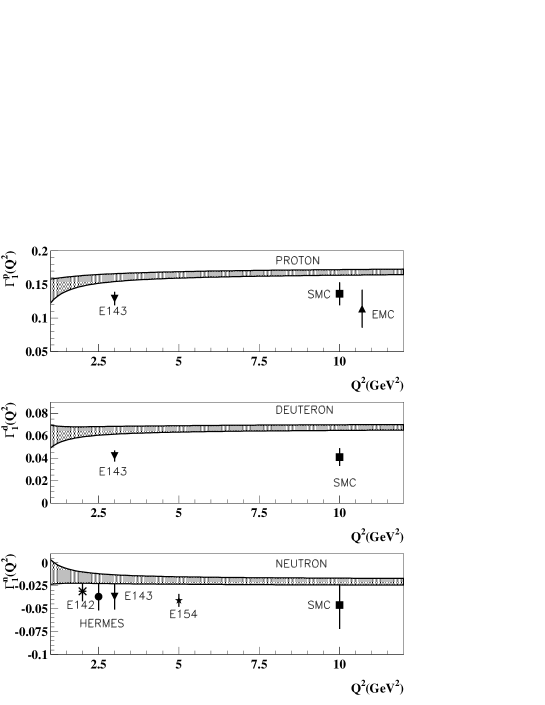
The world data on for the proton, deuteron and neutron are summarised in Fig. 11 for the CERN, SLAC and DESY experiments. [32] Comparison of the lower and higher data indicates that the scaling violations are relatively small over the well-measured range of GeV2. The data are taken using a variety of targets (e.g. H(), D() and 3He() for HERMES; NH3(), ND3(), 6LiD() and 3He() for the SLAC experiments; and, NH3(), butanol() and deuterated-butanol() for SMC) and widely varying experimental techniques.
There is no evidence for a rise of at the smallest values of explored by SMC and E155. Indeed the QCD fit prediction is that becomes negative for due to the relatively large positively polarised gluon at higher driving the polarised gluon negative at small . [33] Clearly this will be of interest in the light of the HERA unpolarised results and of significance in the extrapolations required for the determination of the sum rules. SMC presented data on the virtual-photon proton asymmetry, at low GeV2 which extend to very low , as shown in Fig. 12. [35] The low data were obtained with a dedicated low- trigger, requiring an observed hadron in each event which rejects radiative and other events with low depolarisation factors. At these very low values the data indicate that extreme QCD behaviour of (full line) proposed in [36] is ruled out. However the less extreme QCD behaviours or indicated by the dotted lines give reasonable descriptions of the data. Clearly higher data are desirable in order to test the pQCD models, but the data do constrain the Regge behaviour.

The values of in Fig. 11 fall monotonically with decreasing . The precision of this data is now approaching that of the proton data, which is important in the context of the Bjorken sum rule discussed below. All data are observed to be in good agreement, where the systematic errors (not shown) are typically smaller than the statistical errors. In addition, E155 presented new preliminary data on and (not shown) at GeV2 which are in good agreement with these published datasets. [34] These data have very small statistical errors and extend the range compared to the E143 data. This improved precision also requires that nuclear effects due to the assumed superposition of D and 4He states in the 6Li target data are understood, but possible uncertainties can be tested by comparison with data from different targets and other experiments.

SMC have performed a NLO QCD fit [32] to extract the singlet () and gluon () as well as the proton () and neutron () non-singlet polarised parton distributions shown in Fig. 13. Here, the deuteron spin structure function is assumed to be related to the proton and neutron structure functions by
where is the D-wave state probability in the deuteron.
The results of the fits from two NLO QCD programs are shown by the full and dashed lines in Fig. 11 at the measured of each of the datasets. The comparison indicates that a good fit is obtained to the world data with , considering statistical errors only. The parton densities are parameterised and determined in analogy to the unpolarised case via the NLO DGLAP splitting kernels. Results are quoted in the Adler-Bardeen (AB) scheme, a modified version of the more conventional scheme, defined such that is independent of . These renormalisation/factorisation schemes are related via
where is the singlet axial-current matrix element and the ’s correspond to the parton densities integrated over . This scheme dependence is large and sufficient to create a negative at small and a smaller in scheme. [32] However, the physical structure functions and their integrals, such as are unaffected by this definition. In Fig. 13, the singlet contribution is seen to be well constrained by . This remains true when account is taken of the theoretical uncertainties which include the variation of the renormalisation and factorisation scale by factors of two, varying within the given limits and changes to the starting scale and the functional forms of the parameters. Similarly the non-singlet contributions are reasonably well constrained and the rise of is mirrored by the fall of . However, is rather poorly constrained especially when taking into account the theoretical uncertainties. Integrating over at
in AB scheme compared to in scheme. Consistent results are obtained in either scheme for the singlet contribution expressed in terms of the axial-current matrix element
which compares to the QPM expectation and corresponds to about one third of the nucleon spin being carried by quarks.
In the latest analysis by J. Ellis and M. Karliner, [37] the world average value of the singlet matrix element in scheme is given by
This approach utilises the calculations and estimates discussed below in relation to the Bjorken sum rule. Here, the consistency of the data taken at different values improves as successive higher-order QCD corrections are taken into account.
Bjorken Sum Rule: The Bjorken sum rule is a fundamental prediction of QCD determined by the difference of the spins carried by the and the quarks
where and are the axial-vector and vector weak coupling constants of neutron -decay and is the non-singlet perturbative QCD correction which has been calculated up to and estimated up to using the same approach as for the GLS sum rule. [10, 11] Here, higher twist contributions to the difference of the structure functions are assumed to be negligibly small.
In the SMC NLO fits discussed above, the sum rule is imposed as an input with fixed rather precisely from -decay experiments. However, the NLO fits provide two methods to check the Bjorken sum rule. First, the input can be relaxed and fitted as an additional parameter in the global fit yielding
at , which is in agreement with the theoretically expected value of . Second, the non-singlet contributions can be evolved to a common in order to determine the sum rule more directly and with a minimum number of parameters. This yields a consistent value of when evaluated at . This second method is potentially more precise, but awaits the high statistics data on from E155 combined with the existing data on from E154.
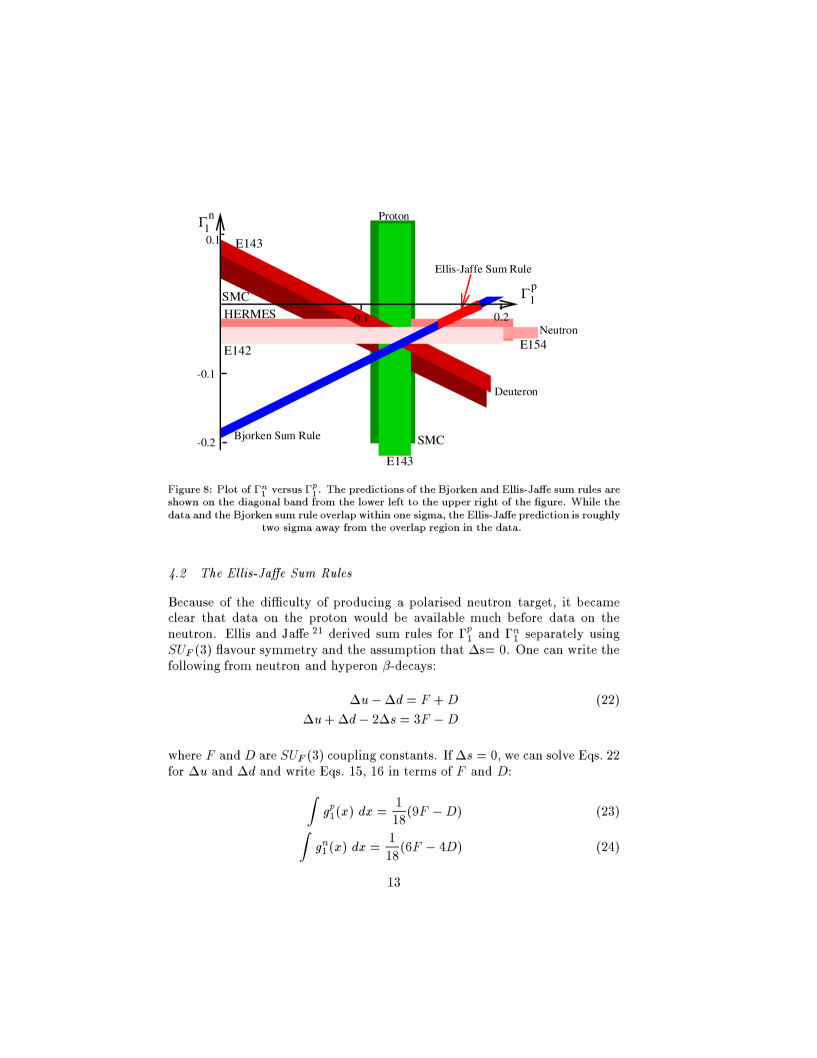
Ellis-Jaffe Sum Rule: Assuming that strange quarks do not contribute to the nucleon spin and SU(3)f symmetry, Ellis and Jaffe derived independent sum rules for the proton and neutron
in the high- limit and modified by singlet and non-singlet QCD corrections. In Fig. 14 the world data on the Bjorken and Ellis-Jaffe sum rules are depicted graphically. As noted in relation to the SMC analysis, the data are in agreement and consistent with the Bjorken sum rule with a precision of around 10%. The origin of the spin puzzle was the EMC measurement of . In Fig. 15, the world data on , and all indicate that the Ellis-Jaffe sum rule is broken at the 2-3 level. The strange sea quarks and/or the gluon therefore carry a significant fraction of the spin. It is currently impossible to distinguish an SU(3)f symmetric sea or a (large gluon) solution in the NLO QCD fits. [38] A natural assumption would be that SU(3)f symmetry is violated at the same level as in the unpolarised structure functions and the rest of the spin can be attributed to a large gluon polarisation, but this requires further experimental input.
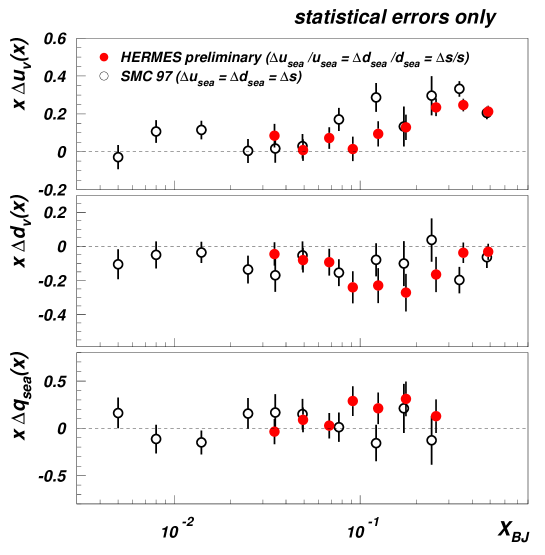
Semi-inclusive Asymmetries: SMC [39] and HERMES [40] have recently produced data tagging the charge of final state hadrons. The asymmetry is defined in analogy to the inclusive case where the distribution of charged hadrons with momentum fraction is statistically correlated with the struck quark flavour in a flavour tagging analysis. In Fig. 16 the extracted spin contributions , and (introduced for ) from SMC and HERMES are observed to be in agreement. Slightly different assumptions are made with respect to the strange quark sea where SMC assume an SU(3)f symmetric sea and HERMES assume this symmetry is violated at the same level as in the unpolarised structure functions. However these effects are negligible for the predominantly pion final states in this LO QCD analysis. Both experiments observe is positive and is negative. The SMC results integrated over are
in agreement with the expectations from the NLO QCD fits. The polarised sea is compatible with zero although there are indications from the HERMES data that this contributes positively.
Outlook: The analysis of polarised structure function data enables first measurements of the scaling violations to be performed. These provide a test of QCD and indicate that the gluon polarisation is positive. Similarly, the semi-inclusive measurements give first constraints on the sea. The structure function data from E155 and semi-inclusive data from HERMES will soon provide further input. These data are, however, insufficient to determine the various spin parton distributions within the nucleon. By analogy with Table 1, we can therefore consider a future programme of spin structure measurements which will enable the partonic spin structure to be unravelled, as shown in Table 2. In the next few years HERMES, COMPASS and the RHIC experiments will focus on the determination of the gluon. It is also possible that the polarised proton technology developed at RHIC could be utilised at HERA in order to explore polarised structure functions at low . With a high luminosity HERA machine the data would also extend to high where neutral current and charged current events would provide detailed information on this spin structure.
| Process/ | Leading order | Parton behaviour probed |
|---|---|---|
| Experiment | subprocess | |
| DIS | Two structure functions | |
| (SLAC, EMC/SMC, | ||
| HERMES) | ||
| with | , , | |
| (SMC,HERMES) | ||
| (COMPASS, HERMES) | ||
| (COMPASS) | ||
| , , , | ||
| (RHIC) | () | |
| (?) | ||
| (RHIC) | (x0.03) | |
| (RHIC) | (x0.03) | |
| DIS | Two structure functions | |
| (HERA) | ||
| DIS (small ) | ||
| (HERA) | ||
| (HERA) | ||
| (HERA-) | () |
4 HERA Results
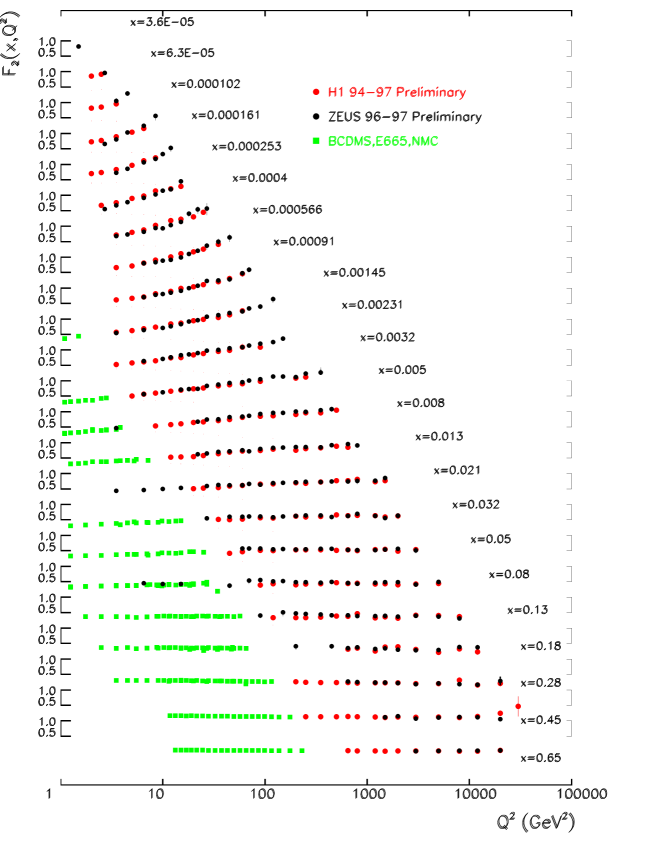
The HERA collider has improved its performance in successive years, providing large datasets from 1994-97 running. During this period 27.5 GeV positrons collided with 820 GeV protons resulting in data samples of 37pb-1 and 46pb-1 for H1 and ZEUS, respectively. As a measure of the progress which has been made in the study of the scaling violations of , Fig. 17 illustrates how the latest HERA data, presented for the first time at ICHEP98, extend the reach in beyond 10,000 GeV2 with extending up to 0.65. At high values, the effects of exchange are significant and the value of is quoted where
where , and are the contributions due to photon exchange, interference and exchange, respectively. The data also extend to very low below : here it should be noted that the precision of the low- data is now comparable to that of the fixed-target data at higher . There is a region of overlap where the HERA and fixed-target experiments can be compared. In particular, the analysis of the ZEUS results at low may resolve the CCFR-NMC discrepancy discussed earlier in the context of the “5/18ths rule”. However, this comparison (not shown) is currently inconclusive, with the ZEUS data lying between the NMC and CCFR data.
4.1 Low- Results
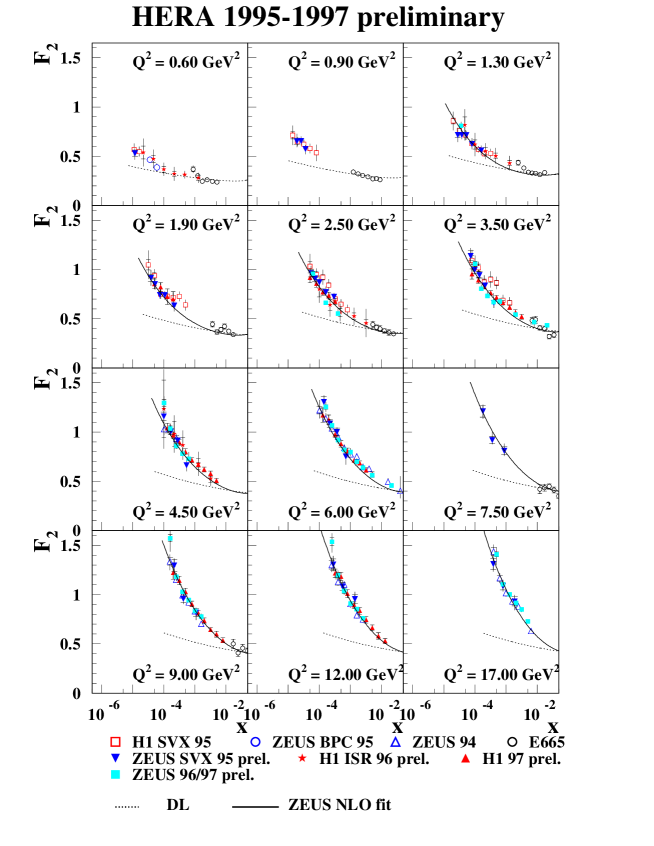
Transition Region: The rise of with decreasing or, equivalently, the rise of with increasing has stimulated significant experimental and theoretical developments in the understanding of QCD at high energies. One challenge is to explore how and where the transition occurs from soft to hard physics and interpret low- data. Measurements have been performed using dedicated low-angle taggers (e.g. the ZEUS BPC) and shifted vertex (SVX) data [41] as well as QED Initial State Radiation (ISR) data [42] in order to map out this region. In Fig. 18, a compilation of the latest measurements available from HERA and E665 indicates that the different experiments and techniques agree with a precision of around 5% from the most recent data. The significant rise of is apparent for GeV2, a behaviour which is described by the ZEUS NLO (pQCD) fit. This behaviour is not reproduced in the DL (Donnachie-Landshoff Regge) fit.
The ZEUS collaboration has performed both types of fits to the data exploring this transition region. [41] In order to determine the relationship between low- ZEUS BPC data measured in the range GeV2 and GeV2 data, a Generalised Vector Meson Dominance (GVMD) approach can be taken. GVMD relates the virtual-photon cross-section to the real cross-section via
for fixed and . A good description of the data is found with GeV2. Regge theory then determines the dependence of the data, combined with lower energy photoproduction experiments, as
where the Reggeon intercept is fixed to 0.5 from hadroproduction data and lower energy photoproduction data also constrain , and . From the BPC data alone, the pomeron intercept value is
to be compared with the Donnachie-Landshoff value . In this range, the rise of the cross-section is therefore relatively modest. Combining the GVMD and Regge approaches, the resulting ZEUSREGGE fit is used to parameterise the and dependence of the low GeV2 data. The ZEUS NLO QCD fit to the ZEUS 94 and ZEUS SVX data, incorporating NMC and BCDMS data, (discussed below) is used to determine the behaviour and the uncertainties on the gluon and singlet quark densities at low for GeV2.


To quantify the behaviour of , fits to the E665 and ZEUS data of the form are performed. The parameter for is then plotted as a function of in Fig. 19. A relatively slow transition from is observed with increasing . Also shown are fits to the DL and ZEUSREGGE parameterisations, fitted over the same range as the data, for GeV2. These describe the data reasonably but are systematically lower. For GeV2, the data are compared to the GRV94 prediction where the starting scale for the evolution of the parton densities is rather low ( GeV2) and pQCD evolution generates the rise at small : this approach is observed to reasonably describe the data and the description is improved using the GRV98 PDF (not shown). [8] The rise at small is also described by the ZEUSQCD fit, where the ZEUS data is used as an input.
This rise of with decreasing is intimately coupled to the scaling violations via the gluon density (in leading order neglecting sea quark contributions). In Fig. 20, fits of the form have been performed to the ZEUS data and the parameterisations discussed above. For , corresponding to GeV2 there is a qualitative change in behaviour where the scaling violations stabilise and then decrease for lower- values, a behaviour which is not reproduced by the GRV94 PDF. The question is whether this scaling violation behaviour and the slow onset of the rise of with decreasing can be simultaneously understood.
A. Mueller has discussed the scaling violation behaviour in terms of a geometric model where the spatial extent, , of the fluctuation of the virtual photon in the fixed-target frame is related to the height of the plateau in the scaling violations [43]
For GeV-2 and GeV2, the spatial extent fm. This appears to be the scale at which a transition takes place and the partons in the proton start to overlap. [3] However, perturbative QCD is pushed to its limit and it will be important to test that the parton densities extracted from can be universally applied.
The ZEUS NLO fit to the GeV2 data describes the data, demonstrating that there is sufficient flexibility in such an approach to go down to relatively low . However, the relatively stable scaling violations observed around GeV2 in Fig. 20 yield a gluon contribution which is rapidly diminishing at small- and which is in fact smaller than the singlet sea quark contribution for small starting scales. For larger values the gluon dominates the sea and we have an intuitively appealing picture where gluons radiate sea quarks whereas, in this low- region, the sea appears to be driving the gluon at low . Whether such low- partons are universally valid could be tested using e.g. low- diffractive vector meson data. [6, 43]
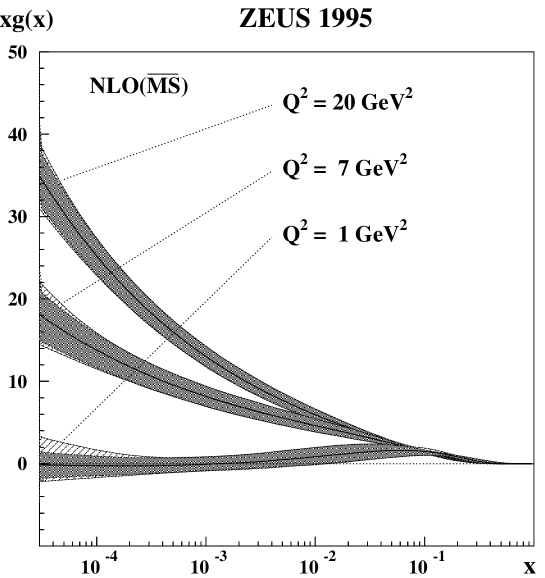
An important part of the ZEUS NLO QCD fit is the determination of the uncertainties on the gluon and singlet quark densities. These are given for the gluon distribution in Fig. 21. The overall uncertainty is estimated by combining in quadrature: the experimental systematic uncertainties on the ZEUS as well as the NMC and BCDMS data; the theoretical uncertainties on by , the relative strange quark content by and the charm mass by GeV; and, the parameterisation uncertainties on the starting scale, by varying GeV2, as well as using a more flexible form of the input in terms of Chebycheff polynomials and redefining the including errors. These variations correspond to a precision on the gluon of at GeV2 where the renormalisation and factorisation scales are set to . The role of the scale uncertainties is discussed in [44] with respect to future capabilities to determine at HERA. The theoretical and parameterisation uncertainties are amplified at low such that the gluon is rather poorly determined from the scaling violations of in the transition region discussed above.444 The gluon can even become negative at low (in scheme) but the physical quantities, , and remain positive within the quoted errors. It is clear, however, that the gluon is significantly suppressed at low .
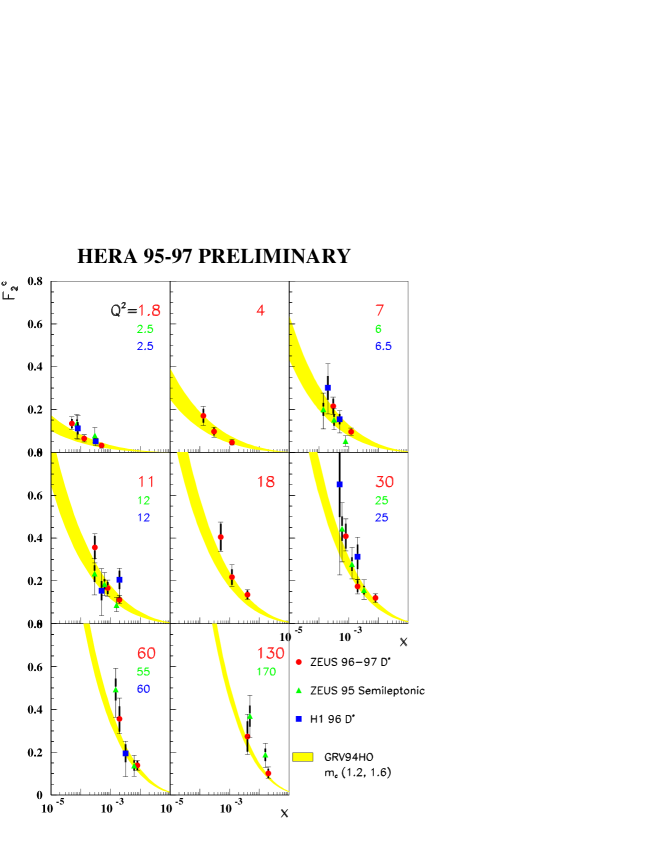
Determination: measurements in DIS provide a significant test of the gluon density of the proton determined from the scaling violations of . They also help to constrain theoretical uncertainties in the fits to where different prescriptions for charm production are adopted. The ZEUS preliminary cross-section nb is measured in the range GeV2, GeV, and . In general, the H1 [45] and ZEUS [46] data agree with the Harris-Smith NLO calculations [47] where the fraction is determined from LEP data [48], the Peterson fragmentation function is characterised by and the renormalisation and factorisation scales are set to . There is, however, a small discrepancy at lower and higher , corresponding to the proton direction, where the data lie above the prediction. A similar discrepancy is also observed in the first analysis in the semi-leptonic decay channel. [46] Together these results indicate that the fragmentation of charm in processes is worthy of further investigation. At this stage, it is reasonable to extrapolate the measured cross-section to the full range555This procedure neglects the possibility of additional contributions outside the measured region due, for example, to intrinsic charm. to determine via the expression
where the contribution can be estimated as a QCD correction. In Fig. 22, the HERA data mirror the rise of at small . The data are in agreement with the GRV94 PDF, where the band represents an estimated theoretical uncertainty due to the effective charm mass ( GeV). This comparison verifies the steep rise of the gluon density at low with a precision of .
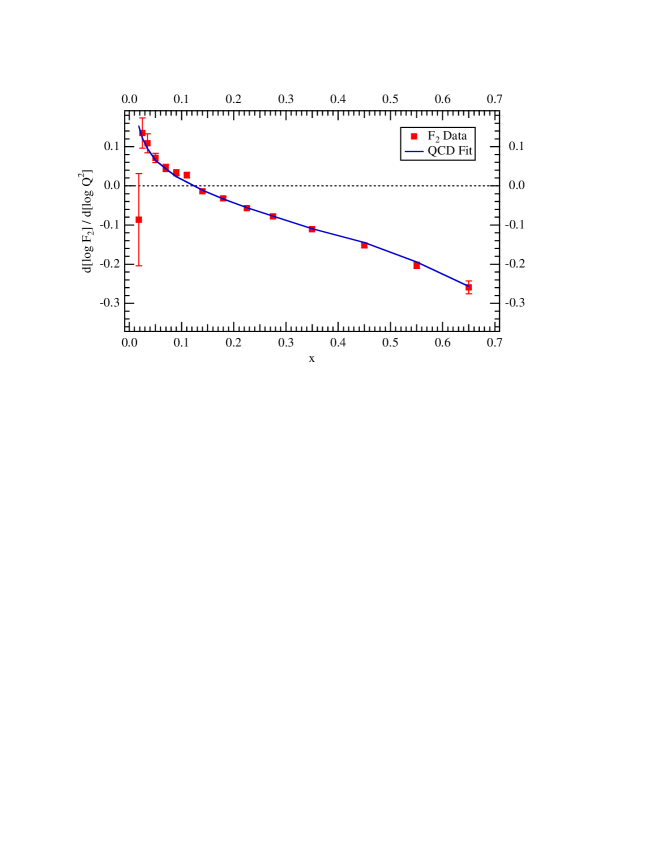
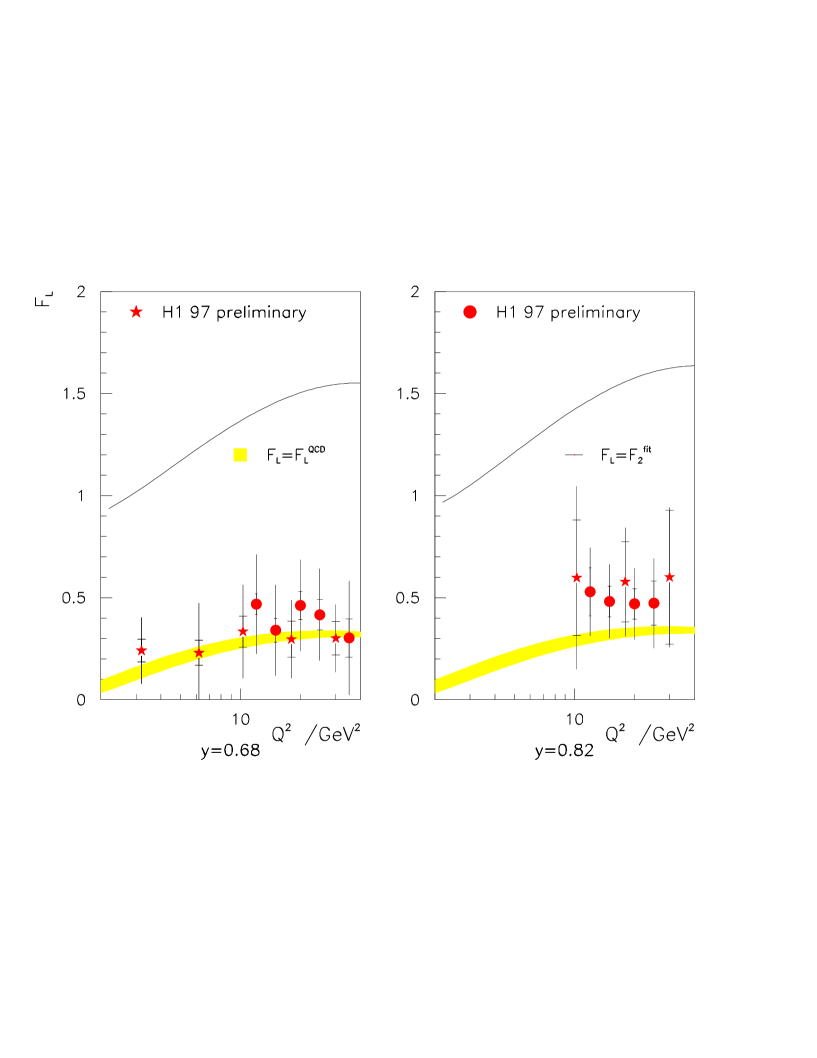
Determination: The contribution of enters as a QCD correction to the total DIS cross-section where . As such it provides an additional method to calibrate the gluon at low . H1 [42] have used two methods to extract from the reduced cross-section at high . This is the region where the scattered electron energy is low: in the H1 analysis scattered positrons are measured down to GeV and backgrounds reduced by requiring the associated track to have correct charge. is determined as a function of GeV2 by measuring local derivatives of and observing deviations from a straight line at high . These data are denoted by the stars in Fig. 23. Here, the data are compared to an earlier extrapolation method [49] applied to the same data, which yields consistent results, as well as to the H1 NLO QCD fit to H1, NMC and BCDMS data. The data are in agreement with the QCD expectations although there is an indication of a relatively large contribution at the highest (corresponding to lowest ) values. In conclusion, a consistent value for the gluon density at low may be extracted from the data on , and with a precision of at GeV2.
4.2 High- Cross-Sections
The HERA collider provides a unique window to explore interactions at the highest energies, extending the range of momentum transfer by about two orders of magnitude compared to fixed-target experiments. As the HERA luminosity increases we explore the region of GeV2, where electroweak effects play a rôle. It is in this unexplored kinematic region that we are sensitive to deviations from the standard model (SM).
In 1997, H1 [50] and ZEUS [51] reported an excess of events compared to the SM predictions from the neutral current (NC) data taken during 1994 to 1996. For the H1 analysis an accumulation of 7 events in a reconstructed mass window of 20012 GeV was found, compared to an expectation of from 15 pb-1 of data. One further event was found from the 1997 data corresponding to a further 22 pb-1, yielding 8 events compared to an expectation of . For the ZEUS analysis the observed rates agreed with expectations except for an excess at the highest where two outstanding events with GeV2 were observed from a luminosity of 20 pb-1. These events still clearly stand out but no new NC outstanding events are observed in the 1997 data, corresponding to a further 26.5 pb-1. Similarly in the charged current (CC) channel, the number of events is higher than expectations but is consistent with the standard model. Attention has therefore focussed on measuring the cross-sections at the highest accessible values.
The theoretical uncertainty on the cross-sections was determined as discussed w.r.t. the ZEUS low- NLO QCD fit using high- and data to yield SM cross-section uncertainties of 6-8% on the NC cross-section and 6-12% on the CC cross-section at the highest accessible values. These cross-sections therefore represent a benchmark for the standard model. The cross-sections, discussed below, are corrected to the electroweak Born level and integrated over the measured range of for H1 [52] and corrected to the complete range for ZEUS. [53]
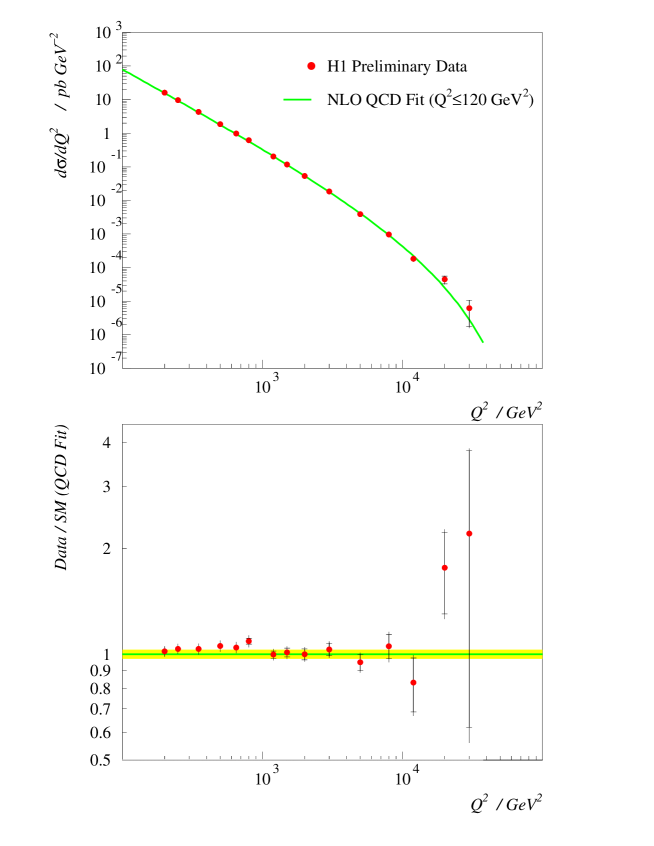
Neutral Current Cross-Sections: High- neutral current events are easily identified from the high-energy scattered positron. The cross-section is particularly sensitive to the valence -quark distribution in the proton
Here, is the generalised structure function, incorporating and terms, which is sensitive to the singlet sum of the quark distributions and is the parity-violating (-contribution) term which is sensitive to the non-singlet difference of the quark distributions . The data are now becoming sensitive to electroweak interference effects, which suppress the NC cross-section by 30% for GeV2. [52, 53]
In the upper plot of Fig. 24, the H1 cross-section is observed to fall over more than six orders of magnitude. The ratio of the data to the SM, adopting the H1 NLO QCD fit, is shown in the lower plot of Fig. 24 where agreement is observed up to 30,000 GeV2. Comparison of the the data uncertainties with those from theory (not shown) indicates that the data will constrain the parton densities of the proton at large .
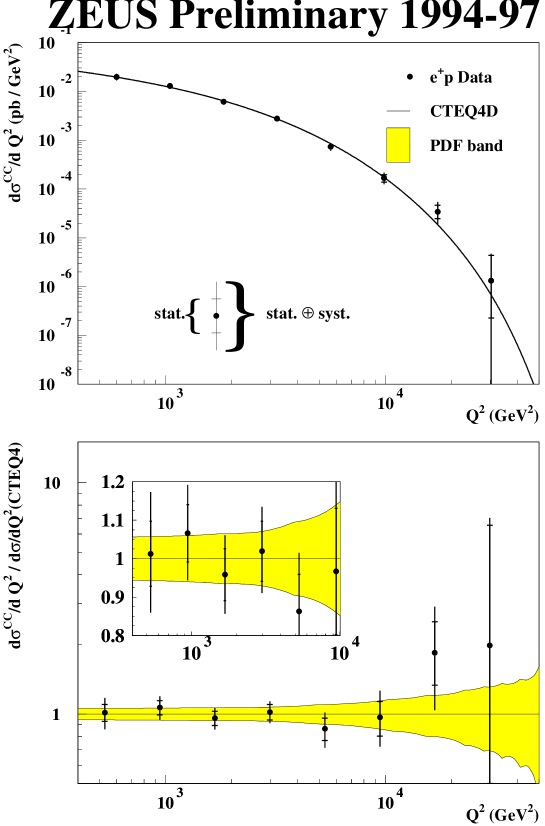
Charged Current Cross-Sections: Charged current events are identified by their missing transverse momentum () due to the escaping neutrino. The cross-section is sensitive to the valence -quark distribution in the proton
In the ZEUS analysis, was measured for GeV2 using the Jacquet-Blondel method where , with an RMS resolution on , reflecting the hadronic energy resolution. The systematic uncertainties, mainly due to the hadronic energy scale uncertainty of , correspond to uncertainties on the cross-section at lower but increase at larger and .
In the upper plot of Fig. 25 the cross-section is observed to fall over more than four orders of magnitude. The ratio of the data to the SM, adopting the CTEQ4D PDF, is shown in the lower plot of Fig. 25 where good agreement is observed up to of 10,000 GeV2. Comparison of the the data uncertainties with those from theory (shaded band) indicates that the data will help to constrain the -quark densities at large-. The cross-section is suppressed relative to NC exchange due to the propagator term: this characteristic dependence on has been fitted to yield a value for the mass of the exchanged (space-like) -boson of
with an additional PDF uncertainty of GeV estimated in the ZEUS analysis and an uncertainty of GeV due to electroweak radiative corrections estimated in the H1 analysis.
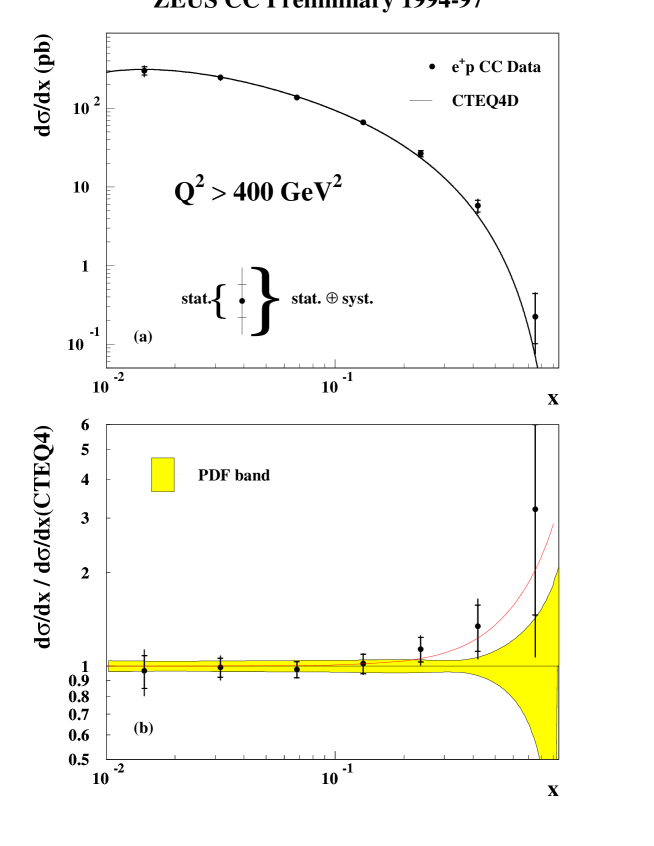
Returning to the Bodek-Yang analysis, [19] discussed in relation to the fixed-target results, the ZEUS CC cross-section is plotted as function of for GeV2 in Fig. 26. The increase in the ratio of corresponds to an increase of the CC cross-section at high . The uncertainties on the data are large in this region, but this modification does result in better agreement with the data than the standard PDF’s at large .
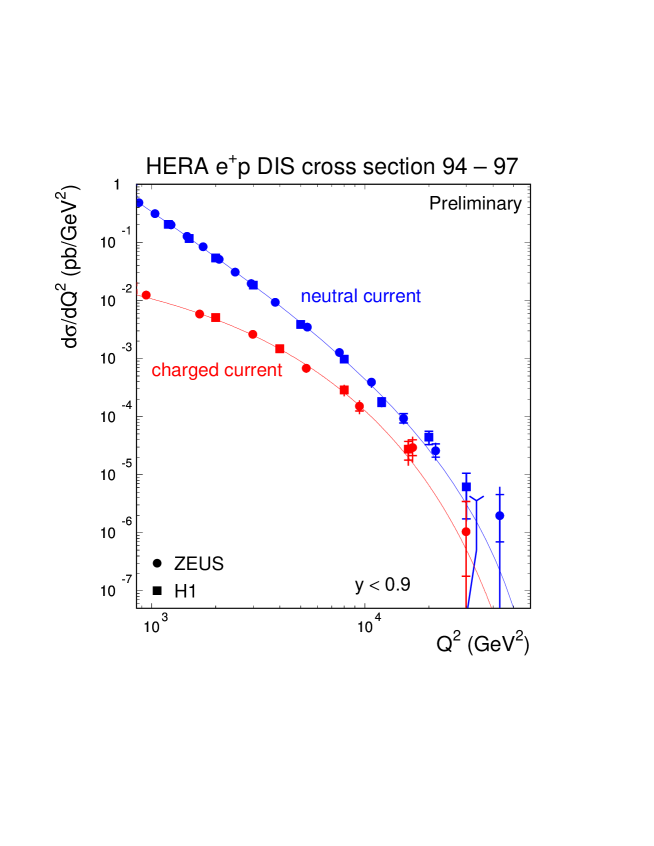
A comparison of the H1 and ZEUS NC and CC cross-sections for GeV2 is given in Fig. 27. The NC and CC data are in agreement and both cross-sections agree with the SM prediction over a broad range range of . At high GeV2, the CC cross-section is suppressed relative to the NC cross-section due to the ratio being less than unity. The measurement of the HERA CC/NC ratio of cross-sections will therefore provide a direct determination of this ratio, free from the uncertainties due to nuclear binding effects.
5 Summary and Outlook
There were many highlights in our deepening understanding of nucleon structure presented at the ICHEP98 conference. CCFR have performed final analyses of their structure function data which lead to precise tests of QCD. NuTeV already provide electroweak input and aim to reduce the uncertainty on to . Important developments have been made in the understanding of higher twist effects in terms of renormalon theory. Input from various experiments and a reassessment of the importance of nuclear binding effects in the deuteron lead to the conclusion that the ratio of parton densities increases, whilst the ratio of decreases compared to earlier determinations.
The second phase of spin experiments are now exploring spin structure via NLO QCD fits. The first observations of scaling violations from combined fits to the world data indicate that the source of the spin puzzle lies with the gluon spin density, , although large uncertainties remain. Semi-inclusive measurements now provide input on the quark composition of the spin.
The first discovery at HERA was the rise of at low . Precise data now enable the rise of the associated scaling violations with decreasing and hence the gluon to be determined. The determinations of and enable this gluon distribution to be calibrated. The fall of these scaling violations at low enables the region where parton confinement effects take place to be explored at high energies.
The large data sample enables cross-sections to be measured at very large where electroweak effects start to play a rôle. The HERA data are consistent with the Standard Model and place constraints on the parton densities at large . The outlook is for a similar sample of pb-1 of data in the next two years, prior to the HERA upgrade where luminosities will be increased five-fold. Deep inelastic scattering has historically led to the discovery of the nucleus, quarks and electroweak neutral currents. The discovery potential of current and future experiments is high and the field continues to provide important input to our understanding of sub-nuclear structure.
Acknowledgements
It is a pleasure to thank Alan Astbury and co-organisers for an excellent conference. Many thanks to Halina Abramowicz, Arie Bodek, Antje Brull, Allen Caldwell, Abe Deshpande, John Dainton, Robin Devenish, Martin Erdmann, Laurent Favart, Thomas Gehrmann, Tim Greenshaw, Beate Heinemann, Peppe Iacobucci, Robert Klanner, Max Klein, Masahiro Kuze, Ludger Lindemann, Alan Martin, Gavin McCance, Jan Okrasiński, Jen-Chieh Peng, Alex Prinias, Robert Waugh, Arnulf Quadt, David Saxon, Stefan Schlenstedt, Mike Vetterli, Manuella Vincter, Bryan Webber, Jim Whitmore, Un-Ki Yang, Rik Yoshida, Jaehoon Yu and all the speakers in the structure functions parallel session for their help, inspiration and advice. I am grateful to the Alexander von Humboldt Foundation, DESY and PPARC for their financial support.
References
- [1] V. Fadin and L. Lipatov, hep-ph/9802290.
- [2] J.R. Forshaw, G.P. Salam and R.S. Thorne, hep-ph/9812304.
- [3] L.V. Gribov, E.M. Levin and M.G. Ryskin, Phys. Rep. 100, 1 (1983); E.M. Levin and M.G. Ryskin, Nucl. Phys. B 18C, 92 (1990).
- [4] J. Huston, ICHEP98 proceedings.
- [5] Y. Dokshitzer, ICHEP98 proceedings.
- [6] M. Erdmann, ICHEP98 proceedings.
- [7] A.D. Martin, R.G. Roberts, W.J. Stirling and R.S. Thorne, hep-ph/9803445.
- [8] M. Glück, E. Reya and A. Vogt, hep-p/9806404.
- [9] CTEQ Collab., H.L. Lai et al., Phys. Rev. D 55, 1280 (1997).
- [10] S.A. Larin and J.A.M. Vermarseren, Phys. Lett. B 259, 345 (1991).
- [11] A.L. Kataev and V.V. Starshenko, Mod. Phys. Lett. A 10, 235 (1991).
- [12] J.H. Kim, D.A. Harris et al., hep-ex/9808015, submitted to Phys. Rev. Lett..
- [13] S.A. Kulagin, hep-ph/9809219.
- [14] A.L. Kataev, G. Parente and A.V. Sidorov, hep-ph/9809500.
- [15] CCFR Collab., W. Seligman et al., hep-ph/9701017.
- [16] M. Virchaux and A.M. Milsztajn, Phys. Lett. B 274, 221 (1992).
- [17] C. Caso et al., Euro. Phys. C 3, 1 (1998).
- [18] F. Eisele, Physics in Collision proceedings, hep-ph/9807028.
- [19] U. Yang and A. Bodek, ICHEP98 proceedings, hep-ph/9809480.
- [20] L. Frankfurt and M. Strikman, Phys. Rep. 160, 235 (1988).
- [21] M. Dasgupta and B.R. Webber, Phys. Lett. B 382, 273 (1996).
- [22] CCFR Collab., U.K.Yang et al., DIS98 proceedings, hep-ex/9806023; J. Yu, ICHEP98 proceedings.
- [23] CDF Collaboration, F. Abe et al., hep-ex/9809001, submitted to Phys. Rev. Lett.; W. Sakumoto, ICHEP98 proceedings.
- [24] NMC Collab., M. Arneodo et al., Phys. Rev. D 50, 1 (1994).
- [25] S. Kumano and K. Umekawa, hep-ph/9803359.
- [26] E866 Collab., E.A. Hawker et al., Phys. Rev. Lett. 80, 3715 (1998).
- [27] E866 Collab., J.C. Peng et al., hep-ex 9804288, submitted to Phys. Rev. D.
- [28] HERMES Collab., K. Ackerstaff et al., hep-ex/9807013; M. Vincter, ICHEP98 proceedings.
- [29] C. Boros, J. Londergan and A. Thomas, hep-ph/9804410. C. Boros, ICHEP98 proceedings.
- [30] CCFR Collab., A. Bazarko et al., Z. Phys. C 65, 189 (1995).
- [31] D. Karlen, ICHEP98 proceedings.
- [32] SMC Collab., B. Adeva et al., CERN-EP/98-86, submitted to Phys. Rev. D; A. Deshpande, ICHEP98 proceedings.
- [33] G. Altarelli, R.D. Ball, S. Forte and G. Ridolfi, Nucl. Phys. B 496, 337 (1997).
- [34] L. Sorrell, ICHEP98 proceedings.
- [35] E. Rondio, ICHEP98 proceedings.
- [36] F.E. Close and R.G. Roberts, Phys. Lett. B 336, 1257 (1994).
- [37] J. Ellis, DIS98 proceedings (World Scientific) in press; J. Ellis and M. Karliner, Phys. Lett. B 341, 397 (1995).
- [38] B. Lampe and E. Reya, hep-ph/9810270.
- [39] SMC Collab., D. Adeva et al., hep-ex/9711008, submitted to Phys. Lett. B.
- [40] C.A. Miller, ICHEP98 proceedings.
- [41] ZEUS Collab., J. Breitweg et al., DESY 98-121, submitted to Euro. Phys. C; A. Quadt, ICHEP98 proceedings.
- [42] H1 Collab., C. Adloff et al., ICHEP98 contributed papers 534 and 535; M. Klein, ICHEP98 proceedings.
- [43] A.H. Mueller, DIS98 proceedings (World Scientific) in press.
- [44] M. Botje, DIS97 proceedings, AIP Conf. Proc. 407, 393 (1997).
- [45] H1 Collab., C. Adloff et al., ICHEP98 contributed papers 538 and 540; E. Tzamariudaki, ICHEP98 proceedings.
- [46] ZEUS Collab., J. Breitweg et al., ICHEP98 contributed papers 768 and 772; W. Verkerke, ICHEP98 proceedings.
- [47] B.W. Harris and J. Smith, Nucl. Phys. B 452, 109 (1995); B.W. Harris and J. Smith, Phys. Lett. B 353, 535 (1995); B.W. Harris and J. Smith, hep-ph/9706334.
- [48] OPAL Collab., K. Ackerstaff et al., Euro. Phys. C 1, 439 (1998).
- [49] H1 Collab., S. Aid et al., Phys. Lett. B 393, 452 (1997).
- [50] H1 Collab., C. Adloff et al., Z. Phys. C 74, 191 (1997).
- [51] ZEUS Collab., J. Breitweg et al., Z. Phys. C 74, 207 (1997).
- [52] H1 Collab., C. Adloff et al., ICHEP98 contributed paper 533; M. Fleischer, ICHEP98 proceedings.
- [53] ZEUS Collab., J. Breitweg et al., ICHEP98 contributed papers 751 and 752; J. Grosse-Knetter, ICHEP98 proceedings.