New Limit on Muon and Electron Lepton Number Violation from Decay
Abstract
The most sensitive experiment to date to search for the muon and electron lepton number violating decay has detected no events consistent with this process. Based on this result, the 90% confidence level upper limit on the branching fraction is .
This Letter reports a significantly improved experimental upper limit on the rate for the decay . This process would violate the conservation of muon and electron lepton number (referred to as separate lepton number) while conserving total lepton number; it is not allowed in the Standard Model of particle physics. Incorporating neutrino masses and mixing into the Standard Model, consistent with current information on these quantities, leads to predicted rates for well below experimental sensitivities [1]. Hence, observation of this decay would signal new physics processes.
Experiments to search directly for separate lepton number violation have been performed for many years, all with null results. Some of the best limits come from previous searches for [2, 3], for which the combined upper limit is , and from searches for [4], [5], [6], [7], and [8]. The sensitivity of these processes to mechanisms which allow for separate lepton number violation varies. Several theoretical models allow , including some at rates as large as current experimental limits: horizontal gauge interactions [9], left-right symmetry [1, 10], technicolor [11], compositeness [12], and supersymmetry [13].
The experiment (E871) was performed in the B5 beam line of the Alternating Gradient Synchrotron at Brookhaven National Laboratory (BNL). Data were collected during running periods in 1995 and 1996. A 24 GeV proton beam incident on a 1.4 interaction length platinum target produced the neutral beam. A targeting angle of 3.75∘ was chosen to maximize the yield while minimizing the ratio. Sweeping magnets downstream of the target removed charged particles. Thin lead foils in the first magnet aperture reduced the flux in the beam. Three collimators defined the neutral beam to subtend a solid angle of approximately 416 mrad2. The proton intensity was typically in a 1.2-1.6 s pulse every 3.2-3.6 s, resulting in per pulse ( GeV/c), 7.5% of which decayed in an evacuated decay volume between 9.75 and 20.75 m from the target. We measured the ratio to be .
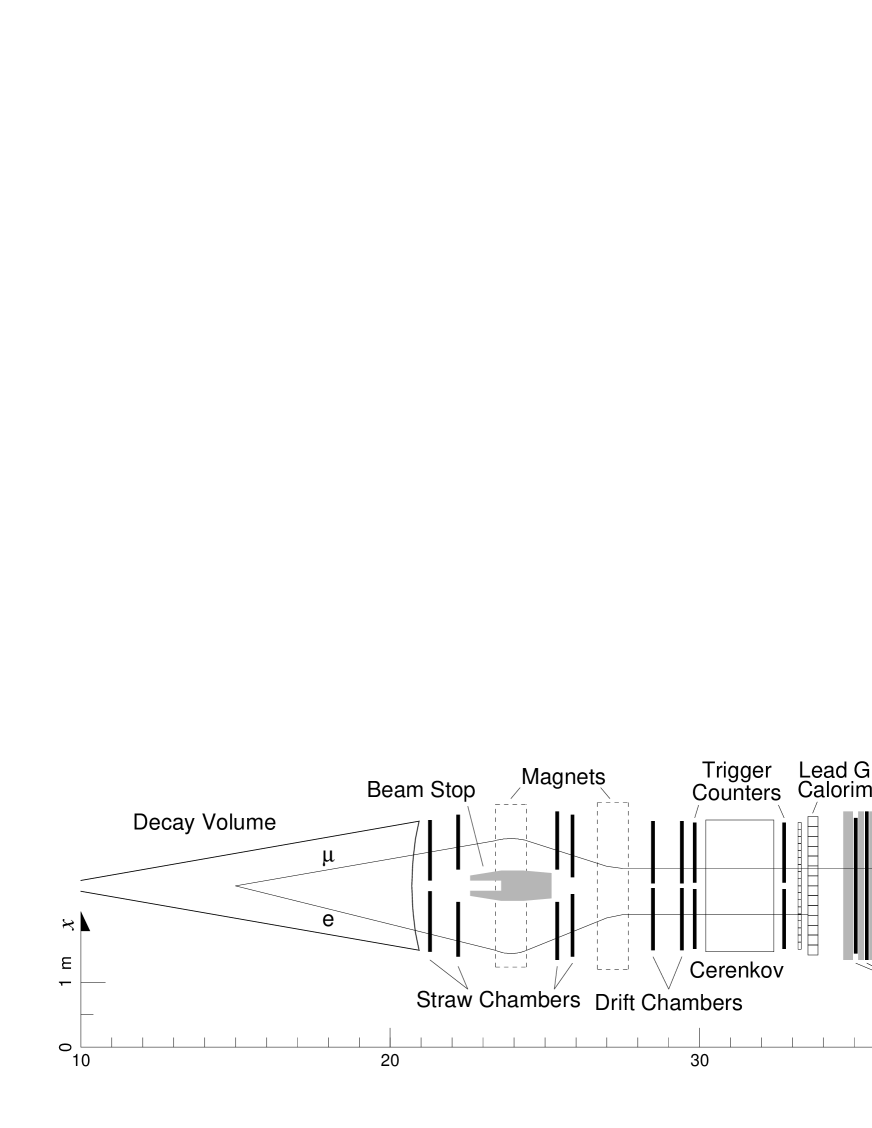
The experimental apparatus, illustrated in Fig. 1, has been described previously [14]. Accordingly, we describe here only the most important features, emphasizing characteristics of the detector most germane to this search. A magnetic spectrometer consisting of six pairs of tracking chambers and two magnets was used to measure kinematic parameters of charged decay products. A beam stop [15] was placed in the first magnet to absorb the neutral beam. The spectrometer was followed by scintillation hodoscopes (TSC) at two longitudinal positions, used to select events with two charged particles and define the event time. Both hodoscopes contained one (horizontal) measuring plane on either side of the detector. The downstream module contained an additional plane on either side providing measurements in the (vertical) view. A segmented threshold erenkov detector (CER) and lead glass calorimeter (PBG) were used to identify electrons. A 30.5 cm thick iron filter followed the PBG. Muons were identified by scintillation hodoscopes (MHO) and a range finder (MRG) downstream of it. Six MHO planes at five different locations provided position and timing information. The MRG consisted of 26 vertical and 26 horizontal planes of proportional tube hodoscopes, located between absorbers of steel, marble, and aluminum. The amount of material between successive planes increased with depth and corresponded to 5% increments of muon range.
The lowest level trigger (L0) required a coincidence of signals in all six TSC planes, providing two and one measurements on each side of the detector. Further, a parallelism condition was imposed: each pair of view signals was required to be consistent with a particle trajectory with mrad. This requirement maintained good acceptance for two-body decays while reducing the acceptance for the dominant three-body modes. The typical L0 trigger rate was approximately 70 kHz.
The next trigger level (L1) was designed to accept all dilepton decay modes; it was formed from a coincidence of an L0 trigger and signals from particle identification (PID) detectors. The muon signal was taken from the MHO plane located at a position corresponding to an energy loss of 1 GeV. The electron signal was provided by the erenkov detector. Spatial correlation between TSC and PID signals was required. In addition to the dilepton modes, one of every 1000 L0 trigger events was selected to form the “minimum bias” sample. It was used for detector calibration and for flux determination, based on the number of events in that sample. The L1 trigger rate averaged about 7 kHz.
Events satisfying the L1 trigger were digitized and transferred to a set of eight processors in which a software trigger (L3) was implemented. It did fast event reconstruction using hits in the TSC and all tracking detectors. At least one track on each side of the spectrometer and a decay vertex within the neutral beam were required. In addition, a two-body invariant mass exceeding 460 MeV/c2 and two-body transverse momentum less than 60 MeV/c were required for the trigger. Charged particle mass assignments were determined by the triggering PID detector. An event with more than one L1 dilepton hypothesis was accepted if any of the triggered modes satisfied the L3 criteria. The L3 trigger algorithm was run on minimum bias events but no selection on kinematic quantities was made. All events passing the L3 trigger were written to tape for off-line processing.
The off-line pattern recognition software used a similar but more thorough algorithm for pattern recognition. More rigorous selection criteria were applied to geometric and kinematic quantities. Events were selected if exceeded 470 MeV/c2 and if either of the requirements MeV/c or mrad was satisfied, where is the angle between the kaon direction (determined from the target and vertex position) and the direction of the momentum sum vector of the two charged particles.
The candidate sample was selected from events satisfying these criteria and having a L1 hypothesis. Projected track positions were required to be spatially consistent with signals in the PID detectors. A particle was identified as an electron if it had appropriate signals in the CER and PBG, the track time determined from the tracking spectrometer was consistent with the CER time, and the momentum was consistent with the energy deposited in the PBG. A particle was identified as a muon if it projected to hits in the MHO and MRG, the track time was consistent with the MHO signal times, and the energy inferred from the MRG exceeded 80% of the momentum. Also, any PBG signal associated with a muon candidate was required to be inconsistent with that of an electron.
The best estimates of kinematic parameters of all events satisfying the above criteria were determined using two independent algorithms that had different sensitivities to errors in pattern recognition. One algorithm (FT) minimized a for a kinematic fit to all hits in the tracking detectors, appropriately accounting for detector resolution and multiple scattering using an error matrix. The second algorithm (QT) did separate calculations of kinematic quantities for the front and back halves of the spectrometer and used the two measurements to form a single momentum and a measure of the track quality. The FT algorithm had a better mass resolution (1.13 versus 1.26 MeV/c2 for QT for events) and was used to determine the event kinematics. It was required that and determined by the fitters be consistent.
Events were required to be consistent with originating from a single kaon decay. The times of the two particles as measured by the spectrometer were required to be consistent within measurement uncertainty and their trajectories were required to project to a common vertex with m and transverse coordinates within the neutral beam.
Events were selected on the basis of the quality of the kinematic fit in order to reject those with tracking mismeasurement or with pion decay or large angle scattering within the spectrometer. In particular, the measurements of front and back momenta were required to be consistent, and events with poor tracking were rejected. High momentum particles were particularly susceptible to errors in track reconstruction, and a maximum momentum of 8 GeV/c was imposed. This requirement also ensured that muons were contained in the range-finder and that erenkov signals were not caused by pions. Events were rejected if particle trajectories projected to any material in the spectrometer volume other than the relevant detectors.
To ensure that event selection criteria were free of bias from knowledge of potential signal events, they were chosen by studying candidates with MeV/c2 and (MeV/c)2, but excluding a region, MeV/c2 and (MeV/c)2, larger than the potential signal region. This exclusion region corresponded to a interval in mass and a 3 interval in .
The primary source of background is in which a pion decays upstream of the muon filter (about 4% of all decays). Misidentification of the pion as a muon results in a maximum value for of 489.3 MeV/c2 if track momenta and directions are correctly measured and the pion is assigned a muon mass. The resolution in inferred from the measured mass resolution was 1.38 MeV/c2; hence, background arising from Gaussian tails in the mass measurement is negligible, but non-Gaussian effects could be important. One source of non-Gaussian errors is elastic scattering in the vacuum window or in the first tracking detector (0.12% and 0.23% radiation lengths, respectively), referred to as upstream scatters. Scattering and decay in the plane normal to (the decay plane) may increase the opening angle and hence the value of , while scattering or decay out of the plane cannot increase significantly. Monte Carlo simulations showed that the dominant background occurs when a low energy electron elastically scatters upstream and the pion decays upstream of the spectrometer.
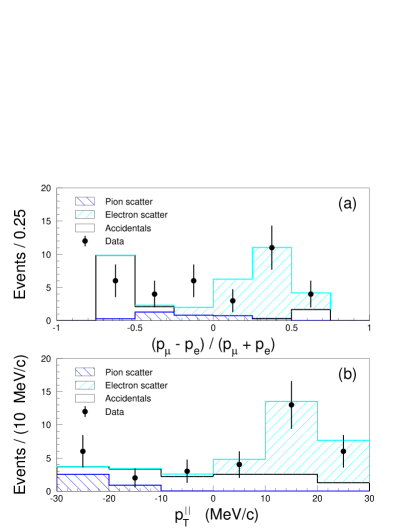
To study this background in detail we imposed the requirement GeV/c and examined the remaining high mass events outside of the exclusion region. The momentum asymmetry and the component of the transverse momentum in the decay plane (denoted by ) are shown in Fig. 2 together with the Monte Carlo predictions. The sign of is taken to be positive if it lies on the electron side of the spectrometer. The upstream scatter events are characterized by large momentum asymmetry and more importantly by large . Without additional selection criteria, our expected background in an appropriate signal region would be about one event. We imposed the requirement that and that be small [16], which reduced this background significantly.
A second potential source of background is accidental coincidences of and decays. Because the muon and electron originate from independent decays, they can reconstruct with a value of . Monte Carlo simulations were done to study this background. In many of these events at least one of the pion trajectories is fully contained in the spectrometer, and the background results when the and view tracks on the pion side are mispaired. Rejecting events with three or more fully reconstructed tracks in the spectrometer reduced this background by an order of magnitude.
The selection criteria, including choice of the signal region, were determined by simultaneously varying values of relevant event selection parameters to maximize the sensitivity to signal while suppressing the expected contribution from the dominant source of background to 0.1 event. The calculated background after application of all selection criteria except those on and is compared to the data in Fig. 3. For MeV/c2, the background is dominated by correctly measured decays. For MeV/c2, events passing the selection criteria are dominated by large upstream scatters, with a lesser contribution from accidentals. Reducing the background by an additional factor of 10 would require tighter selection criteria which would result in a 50% acceptance loss.
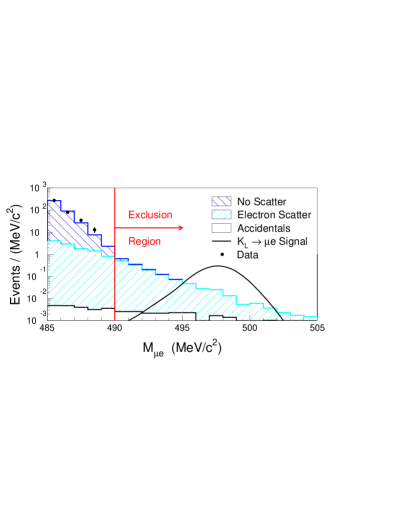
For , the signal region was defined by the ellipse MeV/c MeV/c, where . For , the signal region was defined by MeV/c2 and . The background is larger in the region ; hence different shapes were chosen for the signal region below and above as a compromise between acceptance and background rejection. After all selection criteria (including the choice of the signal region) were determined, all data (including those in the exclusion region) were reanalyzed. Figure 4 shows the final distribution in versus . There are no events in the signal region.

The sensitivity is determined from the number of decays in the minimum bias sample. These events were required to satisfy an appropriate subset of the final selection criteria discussed above, and were required to have no PBG signals consistent with those of an electron. A fit in the versus plane was done to subtract residual background and to determine the number of events. Small differences in geometric acceptance and cut efficiencies were determined by Monte Carlo simulation.
In the absence of any signal events, the 90% confidence level upper limit on the branching fraction is given by
where [17] is the branching fraction, is the prescale (a hardware factor of 1000 times a software factor of 20), is the number of events in the prescaled minimum bias sample (including a 0.05% correction for interference), is a factor to account for loss of events due to hadronic interactions in the spectrometer, and are the mode dependent acceptances (including geometric acceptance and selection criteria efficiency), and are the efficiencies of the L1 and L3 triggers, and and are the efficiencies of the particle identification. The geometric acceptance for () decays with m and kaon momentum GeV/c was 2.36% (2.63%). The parallelism requirement reduced this to 1.97% (2.21%). Event selection criteria further reduced the acceptance to 1.14% (1.62%). Table 1 summarizes the factors entering into the upper limit calculation.
| 0.002067 | 0.000035 | 1.14% | 0.006% | ||
| 0.959 | 0.0058 | 0.974 | 0.0046 | ||
| 0.936 | 0.0071 | ||||
| 79,089 | 379 | 0.978 | 0.0024 | ||
| 1.62% | 0.007% | 0.928 | 0.0045 | ||
The resulting 90% confidence level upper limit on the branching fraction is . This represents the most sensitive search for to date.
We acknowledge the support of the BNL staff, particularly H. Brown, R. Brown, R. Callister, A. Esper, F. Kobasiuk, W. Leonhardt, M. Howard, J. Negrin, and J. Scaduto. R. Atmur, K. M. Ecklund, M. Hamela, S. Kettell, D. Ouimette, B. Ware, and S. Worm played key roles in the design and fabrication of important parts of the experiment. C. Allen, G. Bowden, P. deCecco, P. Coffey, M. Diwan, M. Marcin, C. Nguyen, A. Schwartz, and E. Wolin made important contributions during the early phases of the experiment. We thank V. Abadjev, P. Gill, N. Mar, J. Meo, M. Roehrig, and M. Witkowski for valuable technical assistance. We also thank the SLAC Computing Division and the BNL CCD for assistance with data processing. This work was supported in part by the U.S. Department of Energy, the National Science Foundation, the Robert A. Welch Foundation, and Research Corporation.
References
- [1] P. Langacker, S. U. Sankar, and K. Schilcher, Phys. Rev. D 38, 2841 (1988).
- [2] K. Arisaka et al., Phys. Rev. Lett. 70, 1049 (1993).
- [3] T. Akagi et al., Phys. Rev. D 51, 2061 (1995).
- [4] K. Arisaka et al., Phys. Lett. B 432, 230 (1998).
- [5] A. Lee et al., Phys. Rev. Lett. 64, 165 (1990).
- [6] R. Bolton et al., Phys. Rev. D 38, 2077 (1988).
- [7] U. Bellgardt et al., Nucl. Phys. B299, 1 (1988).
- [8] C. Dohmen et al., Phys. Lett. B 317, 631 (1993).
- [9] R. N. Cahn and H. Harari, Nucl. Phys. B176, 135 (1980).
- [10] Z. Gagyi-Palffy, A. Pilaftsis, and K. Schilcher, Nucl. Phys. B513, 517 (1998).
- [11] S. Dimopoulous and J. Ellis, Nucl. Phys. B182, 505 (1981).
- [12] J. Pati and H. Stremnitzer, Phys. Lett. B 172, 441 (1986).
- [13] B. Mukhopadhyaya and A. Raychaudhuri, Phys. Rev. D 42, 3215 (1990).
- [14] D. Ambrose et al., Phys. Rev. Lett. 81, 4309 (1998).
- [15] J. Belz et al., submitted to Nucl. Instrum. Meth., hep-ex/9808037.
- [16] A correlated cut between and was made: , where and are in GeV/c.
- [17] C. Caso et al., Eur. Phys. J. C 3, 1 (1998).