HEAVY QUARK PRODUCTION AND DECAY: , , AND ONIA∗
This paper summarizes a variety of recent results on heavy quark production and decay. Considerable progress has been made by CDF and DØ in measuring top quark production and decay properties. The top quark mass been measured with an uncertainty that is less than 3%, a relative precision that is better than has been achieved for other quarks. Measurements of the top production and decay properties are consistent with the Standard Model predictions, but are generally limited in precision by the small number of top quark events in the present data samples. ALEPH and CLEO have measured the branching ratio for the flavor changing neutral current decay and find good agreement with the Standard Model. Measurements of -quark production cross sections in collisions by CDF and DØ and in collisions by H1 continue to show discrepancies between theory and experiment. CDF and DELPHI have measured the -quark fragmentation fractions with better accuracy than previous measurements. Finally, measurements of charmonium production by DØ, E771, and L3 are consistent with predictions of the color octet model.
1 Introduction
The topic of heavy quark production and decay covers quite a wide range of material, exploring many different aspects of the Standard Model.000 ∗Plenary talk given at the XXIX International Conference on High Energy Physics, Vancouver, Canada. To reduce the broad scope of the topic to a more manageable subset, this paper focuses on top quark properties and the subset of bottom and charm topics that were presented in the corresponding parallel session of the conference. Thus, the sections that follow describe the properties of the top quark, measurements of the branching ratio for , -quark production in and collisions, -quark fragmentation fractions, and measurements of charmonium production.
2 Top Quark Properties
In the three years that have elapsed since the discovery of the top quark by CDF and DØ, a new field of inquiry has developed. The goals of this field include making precise measurements of top quark properties, probing features of the Standard Model that are unique to the top quark, and searching for deviations from Standard Model predictions that would indicate new physics.
To date, the greatest progress has been made in the measurement of the top quark mass, which is interesting on a number of grounds. As a fundamental parameter of the Standard Model, its value contributes to the very definition of the Standard Model. Once the top quark mass is fixed, the remaining top quark production and decay properties can be predicted. The top quark makes large contributions to various loop diagrams, contributing to the boson propagator and the FCNC decay . Thus, measurement of the top quark mass, in conjunction with measurements of the boson mass and electroweak parameters, allows the mass of the Standard Model Higgs boson to be constrained and the rate for to be predicted. There may also be connections between the top quark mass and electroweak symmetry breaking. For example, in supergravity inspired SUSY models, radiative corrections provide a natural explanation for the “Mexican Hat” shape of the Higgs potential provided the top quark mass lies in the range 150–200 GeV/. The very fact that the top quark is so much heavier than the other fermions in the Standard Model would seem to require an explanation that can only come from new physics beyond the Standard Model. The vastly different mass scales among the fundamental fermions has been dramatically illustrated at the conference, where the observation of neutrino oscillations by Super-Kamiokande appear to indicate that .
The large top quark mass is also responsible for many of the unique features encountered in top quark physics:
-
•
Since , real bosons are produced in top decay and can be reconstructed from the decay products.
-
•
The Standard Model predicts , allowing the study of a “free” quark that decays before it can hadronize.
-
•
The large top quark mass opens the possibility that new particles not predicted by the Standard Model may be found in top quark decays.
While the top quark offers exciting opportunities to study new aspects of the Standard Model, it will be difficult to shed new light on many of the traditional topics in heavy quark physics. For example, past discoveries of a new quark flavor have provided new opportunities to improve our understanding of the CKM mixing matrix. This is unlikely to be the case for the top quark discovery. For a unitary CKM matrix, the CKM elements related to top quark decay are tightly constrained by other measurements:
| (1) |
Given the difficulty in distinguishing or decays from the dominant decay mode, it is hard to see how studies of top quark decays could further improve our understanding of the CKM matrix within the context of the Standard Model. We can, however, test the Standard Model by measuring the single top production cross section, which directly measures . A non-unitary CKM matrix or a fourth generation of quarks with substantial off-diagonal CKM elements would cause to deviate from the value given in Eq. (1).
In the sections below, the characteristics of top quark production, measurements of the top quark mass, and various tests of Standard Model predictions for top quark are described.
2.1 Top Quark Production at the Tevatron
At the Tevatron collider, top quark pair production occurs mostly through annihilation (90%), with a small contribution from diagrams (10%). The top quarks are expected to decay almost exclusively via , so the final state will contain two -quarks and the boson decay products.
The top quark decay channels are classified according to the boson decays. The dilepton channel has both bosons decaying leptonically to or ; it has a small (5%) branching ratio but relatively little background. The lepton + jets channel has one boson decaying leptonically and the other hadronically; it has a large branching ratio (30%) and a substantial background from + jets production. The all-jets channel has both bosons decaying hadronically; it has the largest branching ratio (44%) and a very large QCD multijet background. The channels have one or both bosons decaying to ; they have a large aggregate branching ratio (21%), but are difficult to identify with the present detectors.
The lepton + jets channel is further divided according to the method used to reduce the + jets background:
-
•
The SVX -tag mode requires a displaced vertex in the CDF silicon vertex detector consistent with -quark decay.
-
•
The Lepton -tag mode requires a non-isolated lepton consistent with semileptonic -quark decay.
-
•
The Topological mode places cuts on the kinematic variables and Aplanarity.
Table 1 shows that CDF and DØ observe a clear excess of events over the expected background in the dilepton, lepton + jets, and all-jets channels. The two experiments have followed somewhat different strategies in defining their event samples, with CDF taking advantage of their silicon vertex detector to identify -quarks, while DØ makes greater use of kinematic variables to reduce backgrounds. Despite considerable effort in optimizing these analyses, the present sample of top candidates is small and most of the measurements described below are dominated by statistical errors.
| DØ | CDF | |||
| Channel | Evts | BG | Evts | BG |
| Dilepton | 5 | 9 | ||
| Lepton + Jets | - | - | 34 | |
| (SVX -tag) | ||||
| Lepton + Jets | 11 | 40 | ||
| (Lepton -tag) | ||||
| Lepton + Jets | 19 | - | - | |
| (Topological) | ||||
| All-jets | 41 | 187 | ||
| , | - | - | 4 | |
| 4 | - | - | ||
2.2 Measurement of the Top Quark Mass
Measurements of the top quark mass have now been made in all of the Standard Model decay channels: lepton + jets, dilepton, and all-jets. These measurements are described in the sections below, followed by a discussion of the mass results.
Lepton + Jets Channel
The most accurate measurement of the top quark mass is obtained in the lepton + jets channel, where one of the top quarks decays semileptonically (e.g., ) and the other hadronically (e.g., ).
In principle, the top quark mass can be measured directly by calculating the invariant mass of the decay products from the hadronically decaying top quark. However, it is not easy to identify these decay products. Initial State Radiation (ISR) introduces additional partons that are not associated with top decay, while Final State Radiation (FSR) introduces additional partons that should be included among the top decay products. Both CDF and DØ use the four highest jets in reconstructing the top event, which Monte Carlo studies indicate correctly identifies the partons from top decay 50% of the time.
Even when the top quark decay products are correctly identified, there are 12 different permutations for assigning jets to partons for events with no -tag, 6 permutations for events with a single -tag, and 2 permutations when both -quarks are tagged. To improve the probability of picking the correct jet permutation, a two constraint (2C) kinematic fit is performed that constrains the decay products to have the mass and forces . The jet permutation with the lowest is selected; Monte Carlo studies indicate that correct jet permutation is chosen 40% of the time when the partons are correctly identified in the largely untagged DØ sample.
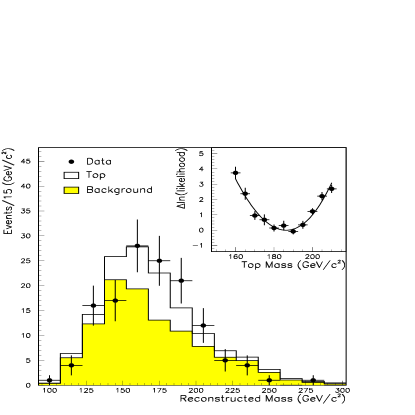
The main effect of ISR, FSR, and jet combinatorics is to widen the reconstructed mass distribution, as shown in Fig. 1. Even when the wrong jet assignment is made, the reconstructed mass distribution remains strongly correlated with the top quark mass.

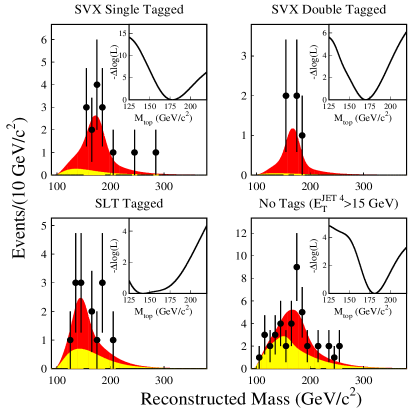
The presence of non-top backgrounds also degrades the mass sensitivity, and both experiments take steps to mitigate the effect of backgrounds. The CDF lepton + jets mass analysis divides the event sample into four sub-samples: SVX single -tag, SVX double -tag, Lepton -tag, and untagged events (see Fig. 2). The SVX -tag samples are particularly clean, with little background expected. The SVX double -tag sample also benefits from having only two possible jet permutations, giving rise to a noticeably narrower signal resolution. A mass-dependent likelihood is calculated for each sub-sample and the product of the likelihoods is used to determine the top quark mass.
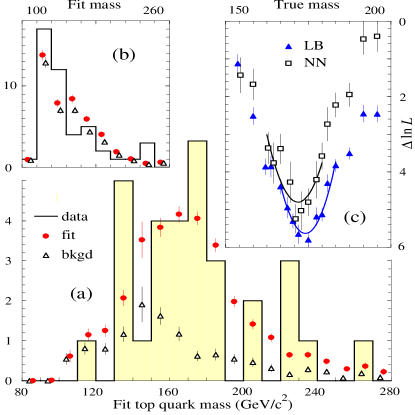
The DØ lepton + jets mass analysis focuses on using kinematic variables to separate the top signal from the background processes. By choosing variables that are minimally correlated with the reconstructed mass, the precision of the mass measurement is enhanced. Two different multivariate discriminants are formed from four kinematic variables: a weighted likelihood that minimizes correlation with the reconstructed mass (LB or “Low Bias”) and a Neural Network output (NN). The data are binned according to the discriminant value to create signal-rich and background-rich sub-samples. These sub-samples are simultaneously fit to obtain the top quark mass (see Fig. 3). Consistent results are obtained from both discriminants and the results are combined, taking into account the expected correlation.
The CDF and DØ top quark mass measurements in the lepton + jets channel are given in Table 2 below.
Dilepton Channel
The dilepton channel requires a different approach than is used in the lepton + jets channel. With two neutrinos in the final state, the event kinematics are under-constrained (-1C) and it is not possible to solve for the top quark mass. Nevertheless, it is possible to measure the top quark mass in the dilepton channel with an accuracy that would be comparable to the lepton + jets channel if the branching ratios were the same.
Any quantity that is correlated with the top quark mass can, in principle, be used to measure it. CDF has previously measured GeV/ in the dilepton channel by fitting the distributions of , the -quark energy, and , the invariant mass between the lepton and -quark. This result has been superceded by a new CDF dilepton mass measurement with a significantly smaller error that uses the Neutrino Phase Space technique developed by DØ.
The CDF and DØ dilepton mass analyses proceed by hypothesizing a top quark mass and determining an event weight for that hypothesis. Two different weighting schemes have been studied:
-
•
Neutrino Phase Space weighting calculates the neutrino phase space volume consistent with the event kinematics (CDF and DØ).
-
•
Matrix Element weighting solves the event kinematics, obtaining 0–4 physical solutions. These solutions are then weighted by the parton distribution functions and the matrix element for boson decay (DØ).
For both weighting schemes, the weights are summed for each jet permutation considered (two for CDF; up to six for DØ, which includes ISR and FSR hypotheses). An integration over the detector resolution is performed by repeatedly calculating the weight with the observed event variables smeared randomly in accord with the detector resolutions.
The result of this procedure is a weight function for each dilepton event. Figures 4–5 show the weight functions for the CDF and DØ dilepton events, respectively.

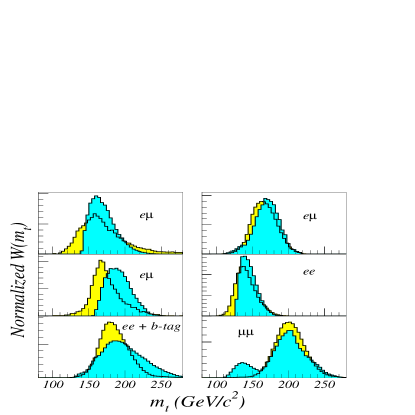
The weight functions show a strong dependence on the hypothesized top quark mass. Two different methods are used to extract the top quark mass from the weight functions. CDF assigns each event a mass calculated by averaging the two masses where the weight function drops by a factor of two from its peak. Figure 6 shows the distribution of these masses and the result of fitting this distribution. DØ accounts for the shape of the weight function by integrating the weights in five equally spaced mass bins and forming a four-dimensional vector from the normalized weights. The top quark mass is extracted by comparing the distribution of observed events in this four-dimensional vector space with the predicted densities for top signal and background. The results of these fits are shown in Figs. 7–8.


The CDF and DØ top quark mass measurements in the dilepton channel are given in Table 2 below.
All-jets Channel
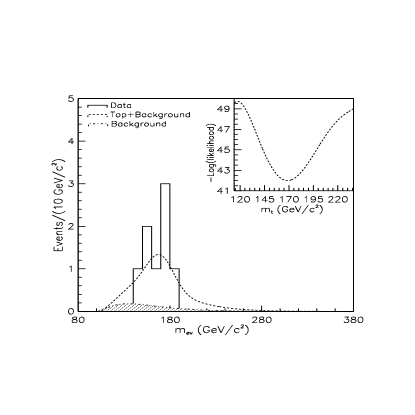
The all-jets channel has a large branching fraction and, with no final state neutrinos, can be fully measured in the detector. CDF has performed a mass analysis in the all-jets channel that incorporates many features of the lepton + jets mass analyses. The large QCD multijet background is reduced by requiring at least one SVX -tag and imposing cuts on the kinematic variables and Aplanarity. Due to the large number of jets in the final state (six), there are 30 possible jet permutations for events with a single -tag. A three constraint (3C) kinematic fit is performed for each jet permutation and the one with the lowest is selected. The reconstructed mass distribution is then fit to a combination of top signal and QCD multijet background (see Fig. 9).
The CDF top quark mass measurement in the all-jets channel is given in Table 2 below.
| Channel | DØ | CDF |
|---|---|---|
| Lepton + Jets | ||
| Dilepton | ||
| All-jets | - | |
| Combined | ||
| Tevatron | ||
Discussion of Top Quark Mass Results
Consistent values of the top quark mass are measured in all of the Standard Model decay channels: dilepton, lepton + jets, and all-jets (see Table 2). The most precise measurement of the top quark mass is obtained by combining these measurements, taking into account the various correlations that are present. A joint CDF–DØ working group has developed a procedure for combining measurements and produced an “official” combined top quark mass, GeV/, that was presented at the conference and used in the electroweak fits described below. CDF has recently revised the systematic errors for the lepton + jets and all-jets channels; these new results are incorporated in the “un-official” Tevatron average shown in Table 2.
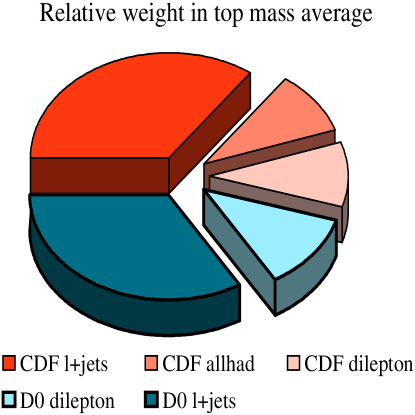
The good agreement among the measurements is reflected by a probability of 75% for the mass average. Figure 10 shows the relative weight of each measurement in the “un-official” average. The largest weights are for the CDF and DØ lepton + jets channels; the dilepton and all-jets channels contribute with considerably smaller weight due to their larger statistical errors.
Combining the statistical and systematic errors in quadrature, we find GeV/. Despite the low statistics in the present data samples, the top quark is now the best measured quark mass, with a relative precision that is under 3%.
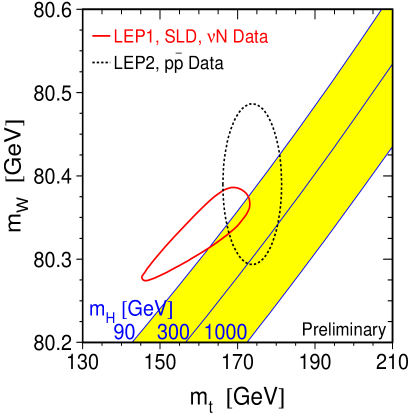
The precise measurement of the top quark mass constrains the electroweak radiative corrections for the boson mass. Figure 11 shows the present direct measurements of the top quark and boson masses, along with indirect constraints from LEP, SLD, and deep inelastic neutrino scattering. The direct and indirect measurements overlap and have a slight preference for a light Higgs mass. A Standard Model fit of the electroweak parameters and the top quark mass yields a Higgs mass of GeV/.
During the upcoming Tevatron Run 2, the number of produced top quarks is expected to increase by a factor of 30. With the increased capabilities of the upgraded CDF and DØ detectors, it should be possible to significantly improve the precision of the top quark mass measurement. A statistical uncertainty in of GeV/ is obtained by scaling the present results. The dominant systematic errors are expected to be the uncertainties in modeling gluon radiation and determining the jet energy scale of the detectors. The study of these uncertainties will certainly be helped by the greatly increased data sample for Run 2, but only time will tell if the ingenuity and hard work of those involved leads to a comparable reduction in the systematic uncertainty on the top quark mass.
2.3 Testing Standard Model Predictions
Once the top quark mass is determined, the remaining properties of the top quark are predicted by the Standard Model, opening the door for many new tests of the Standard Model in a new regime. At present, the small statistics in the CDF and DØ top samples limits the precision of these tests. The increased statistics expected for Run 2 (and Run 3?) will allow much more precise tests of the Standard Model predictions. The sections below describe the observation of , the top pair production cross section, polarization in top decays, and further tests of the Standard Model.
Observation of
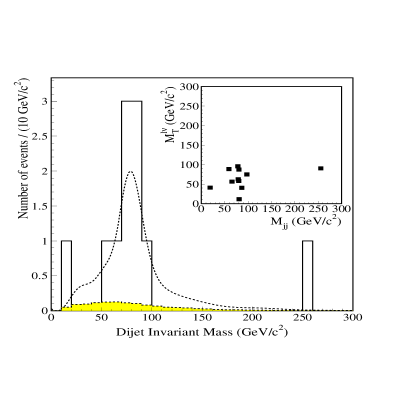
The Standard Model predicts that top quarks will decay almost 100% of the time via , producing final states of for top pair production. CDF has observed this final state in lepton + jet events that have two -quarks identified. Figure 12 shows the invariant mass of the two highest jets that are not tagged. A clear peak is observed in the mass distribution; fitting the peak yields GeV/, which is in good agreement with the boson mass. The transverse mass of the system in these events is also consistent with decay. Thus, the final state has been fully reconstructed and the existence of the Standard Model decay mode is firmly established.
The above results are confirmed by CDF measurements of , which is expected to be close to unity,
| (2) |
and the top quark semileptonic branching ratio for a single lepton species (either or )
| (3) |
which is expected to be 0.11 if the leptons originate from decay.
Top Pair Production Cross Section
Measuring the top pair production cross section tests the Standard Model in several ways:
-
•
New physics can enhance the top cross section compared to the Standard Model predictions.
-
•
Top decays involving new particles can reduce the measured top cross section that is based on Standard Model top branching ratios.
-
•
“Backgrounds” from new physics processes can appear in the top sample and increase the measured top cross section.
It is also important to measure the top cross section in as many channels as possible. Deviations from the Standard Model predictions may be most apparent in a subset of the top decay channels, in which case accurate measurements of the top branching ratios provide a sensitive test. The branching ratio measurements also have the advantage that they don’t rely on the predicted top cross section and are insensitive to some experimental uncertainties (for example, the luminosity error).
A new measurement of the top cross section in the all-jets channel has been reported by DØ. This measurement is unique in its use of jet widths to help discriminate between top signal and QCD multijet background. Also of interest is the method of extracting the cross section by fitting a neural network output distribution to a mixture of signal and background.
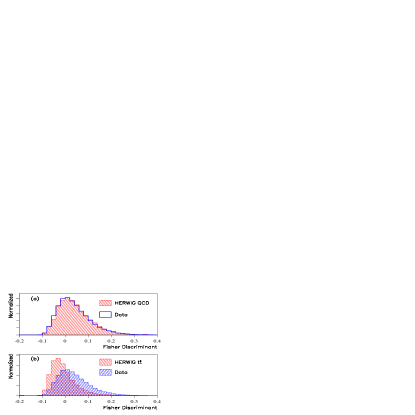
The final state in the all-jets channel contains at least six quark jets, while the QCD multijet background tends to have a large number of gluon jets. Since quark jets are, on average, narrower than gluon jets, the jet widths can be used to help separate the top signal from the QCD background. Discrimination between signal and background is achieved using a Fisher discriminant constructed from the four narrowest jets in the event. Figure 13 shows that the distribution of the Fisher discriminant for HERWIG QCD Monte Carlo events is in good agreement with the data, which is dominated by QCD multijet production. However, when the comparison is made between HERWIG top Monte Carlo events and the multijet data, the top events tend to have lower values of the Fisher discriminant.
A neural network is used to combine the Fisher discriminant with 12 other kinematic variables that also provide discrimination between the top signal and QCD multijet background. The distribution of the neural network output for events with a Lepton -tag is shown in Fig. 14. The background, which is obtained from untagged events, is strongly peaked at low values of the neural network output, while the top signal is peaked at large values of the output. The neural network output distribution is fit to extract the DØ top cross section in the all-jets channel.

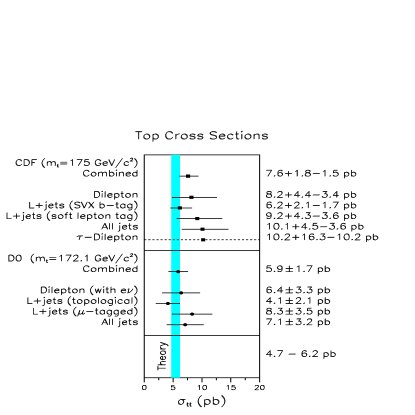
Figure 15 shows a comparison of the CDF and DØ top cross section measurements in the dilepton, lepton + jets, all-jets, and dilepton channels. Also shown in Fig. 15 is the range in theoretical predictions of the top cross section; these calculations are made at NLO with different approaches to estimating the contributions from higher order diagrams. DØ measures a cross section that is in good agreement with the theoretical predictions, while the CDF measurement is slightly (1 s.d.) higher than predicted. While the present measurements are entirely consistent with Standard Model predictions, the rather large experimental errors do not allow a very sensitive test at the present time. The increased statistics expected during Run 2 of the Tevatron collider should greatly improve the sensitivity of the cross section measurements to new physics.
Polarization in Top Decays
The top quark weak interaction coupling can be probed by measuring the polarization in top decays. The Standard Model predicts that both left-handed and longitudinal bosons are produced in top decay, with the fraction that are longitudinal given by
| (4) |
CDF has performed a preliminary analysis of the polarization based on fitting the distribution of transverse momenta () of leptons in the lepton + jets and dilepton channels. The distribution is expected to be softer for left-handed bosons since the lepton decay angular distribution is peaked in the direction opposite the boost.
Figure 16 shows the result of fitting the lepton distributions. Given that is constrained by definition to lie in the range 0–1, the present CDF result is not sufficiently precise to test the Standard Model prediction. What is noteworthy about this result is that the systematic error is sufficiently small that it should be possible to make an interesting measurement in Run 2. Furthermore, there exist other methods for determining the polarization, such as measuring the decay angle of the lepton in the rest frame, that may prove useful in making a precise measurement of .

Further Tests of the Standard Model
Many other tests of the Standard Model are possible in addition to those described above. They include:
-
•
Measurement of the single top production cross section, which can be used to extract and test the expectation that the CKM matrix is a unitary matrix.
-
•
Measurement of spin correlations, which tests the prediction that top will decay before hadronizing.
-
•
Measurement of kinematic distributions that are sensitive to new physics. For example, a topcolor has a large branching ratio to and would appear as a peak in the distribution. CDF and DØ have studied the distributions of several kinematic variables for the top candidates in the lepton + jets channel and find no significant deviations from the Standard Model predictions with the present statistics.
-
•
Search for new particles in top quark decays. For example, a charged Higgs that is lighter than the top quark could be seen in decays. Another possibility is the production of the stop squark in decays. CDF has published the results of a direct search for the charged Higgs in the decay channel. More stringent limits will come from indirect searches that exclude regions of the parameter space where the branching ratio is larger than can be accommodated given the measured top cross sections. Earlier indirect searches by CDF and DØ did not take into account the decay and are being revised; no new results were presented at the conference.
-
•
Search for top decays into final states other than . For example, CDF has set limits on two FCNC decay modes: and (95% CL).
All of the above tests will benefit from the increased statistics expected in the next run.
3 Measurement of the Branching Ratio
The measurement of the branching ratio for is the first of several topics related to the production and decay of the “lighter” heavy quarks, bottom and charm.
Loop diagrams, such as the one shown in Fig. 17, can give rise to FCNC decays of the meson. Since the particles appearing in the loop are not limited to those already discovered, such decays are sensitive to new physics beyond the Standard Model. For example, the boson in Fig. 17 could be replaced by a charged Higgs, possibly leading to a deviation between the measured branching ratio and the Standard Model prediction. While such a deviation would be evidence for new physics beyond the Standard Model, the converse is not necessarily true. In SUSY models, for example, there can be cancelations between the charged Higgs loop and loops involving supersymmetric particles. Thus, limits on new physics inferred from the measured branching ratio are necessarily model dependant.

The signature for decays is a photon with in the -hadron rest frame. The photon energy spectrum is broadened by the Fermi motion of the -quark within the -hadron and by the boost of the -hadron with respect to the lab frame.
The branching ratio has previously been measured by CLEO (see Table 3 below). Two new measurements of this branching ratio were presented at the conference: an updated CLEO measurement with a 60% larger data sample and a lower photon energy threshold, and a new ALEPH measurement using decays. A new calculation of the Standard Model branching ratio was also presented.
The updated CLEO analysis takes two approaches to suppressing the continuum background. The first approach is to feed eight event-shape variables into a neural network and to weight events by the expected signal fraction for the value of the neural network output. The second approach is to attempt reconstruction of the decay and is used for events with a plausible reconstructed final state. The final states considered have either a or a decay and 1–4 ’s with at most 1 . A second neural network combines the output of the event-shape neural network with two measures of the consistency of the reconstructed final state with . The output of this second neural network is then used to calculate event weights as before.
Figure 18 shows the weighted photon energy spectrum. The signal is seen as an excess of event weights over the continuum and backgrounds. CLEO uses the number of events with photon energies in the 2.1–2.7 GeV range to determine the branching ratio (see Table 3 below). The previous CLEO analysis used a more restricted photon energy range (2.2–2.7 GeV); the increased range in photon energy is largely responsible for the larger branching ratio in the updated result.

ALEPH selects boson decays that have a high energy photon candidate and event kinematics that are consistent with decay of a -hadron (, , or ). An inclusive reconstruction algorithm is used to identify the decay products of the -hadron and calculate , the photon energy in the -hadron rest frame. ALEPH then divides its data into eight sub-samples based on three criteria: the electromagnetic cluster is “-like” or “-like”, the jet containing the photon has high or low jet energy, and the hemisphere opposite the -hadron has high or low “-purity.” The signal and background normalizations are determined by a simultaneous fit to the distributions for the eight sub-samples. The fits for the -like sub-samples are shown in Fig. 19. The signal is most clearly seen in sub-sample 4, which has the highest efficiency for decays (see Fig. 20). The ALEPH measurement of the branching ratio is given in Table 3 below.


A new theoretical calculation of the Standard Model branching ratio for was presented that is in good agreement with the CLEO and ALEPH measurements. A precise measurement of the photon energy spectrum would help reduce the theoretical uncertainty in the branching ratio measurements and also provides a way to probe the momentum distribution of -quarks inside mesons. To illustrate the importance of determining the photon energy spectrum, note that both CLEO and ALEPH see small “statistical fluctuations” in the photon energy bin at GeV; if confirmed with higher statistics this would indicate a broader photon energy distribution than is presently being modeled and increase the measured branching ratios.
| Experiment | BR() |
|---|---|
| CLEO (old) | |
| CLEO (new) | |
| ALEPH | |
| Standard Model |
4 -Quark Production in and Collisions
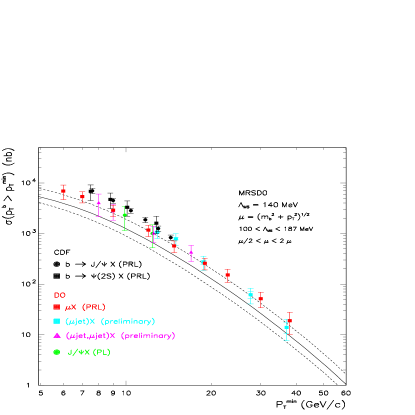
The inclusive central -quark production cross section has been measured in collisions by CDF and DØ (see Fig. 21). The measured cross section has the same dependence as the NLO QCD calculation but is a factor of 2–3 higher than expected for and GeV/. A variety of new results on -quark production were presented at the conference.
DØ has observed -quark production in the forward region by identifying muons in its small angle muon spectrometer. The expected contribution from in-flight decay is subtracted and a NLO QCD Monte Carlo is used to determine the fraction of detected muons that originate from -quark decay (as opposed to -quark decay). Figure 22 shows the spectrum for muons in the rapidity interval . The NLO QCD prediction is consistently smaller than the data and falls somewhat more steeply with than the data.

The DØ forward measurements are combined with the DØ central measurements () to show the rapidity dependence of the cross section for muons from -quark decay for two different ranges (see Fig. 23). For GeV/, the data/theory ratio is in the central region and increases to in the forward region. For GeV/, the data/theory ratio is in the central region and increases to in the forward region. (The uncertainties in the above ratios only reflect the experimental errors.)

The first observation of -quark production in collisions at HERA was reported at the conference. The production of -quarks at HERA is predominately through the photon–gluon fusion process, . H1 selects -quark candidates by requiring a muon be detected within a jet. The -quark production cross section is determined by fitting the distribution, where is the transverse momentum of the muon with respect to the jet axis (see Fig. 24). For the kinematic region GeV2, , GeV/, and , H1 measures
| (5) |
A leading order Monte Carlo (AROMA 2.2) predicts this cross section to be 0.19 nb, approximately a factor of five lower than is observed.

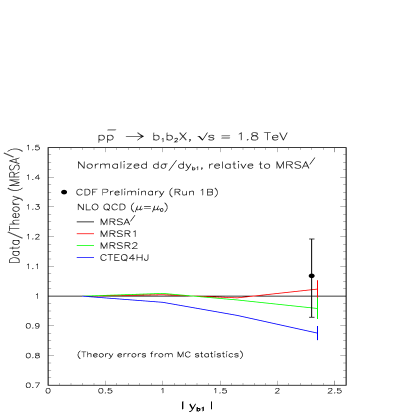
Another way to test NLO QCD predictions for -quark production is to study correlations. Previous CDF and DØ studies of correlations examined the correlations in azimuthal angle. New CDF results on rapidity correlations were presented at the conference. The measurement of rapidity correlations where one is central and the other is forward probes the gluon pdf at large (, ). CDF requires that one -quark be identified by having a muon near a jet consistent with semileptonic -quark decay and a second -quark be identified by having a SVX -tag. The signal is extracted by fitting the muon and the SVX pseudo- distributions for the cases where lies in either the central or forward regions (see Fig. 25).
The rapidity correlation is measured by taking the ratio of the cross sections for in the forward and central regions:
| (6) |
For the kinematic region GeV/, , and , CDF finds:
| (7) |
in good agreement with the NLO QCD prediction using the MRSA′ pdf:
| (8) |
At the present time, the rapidity correlation is not measured with sufficient precision to distinguish between various pdf choices due to the large statistical error (see Fig. 26).
To summarize the -production results, we note that there continue to be discrepancies between the measured -quark production cross section and the NLO QCD prediction in collisions at the Tevatron. A new measurement of forward production shows that the discrepancy is larger in the forward region and the measured spectrum falls more slowly than the NLO QCD prediction in this region. Proposed explanations for these discrepancies include a new theoretical calculation based on a variable flavor number scheme and a harder -quark fragmentation function. The first measurement of the -quark production cross section by H1 at HERA indicates that a similar discrepancy may be present in collisions. One area of agreement between data and NLO QCD is in the rapidity correlations for -quark jets.
5 -Quark Fragmentation Fractions
The -quark fragmentation fractions are used to describe the non-perturbative fragmentation of a -quark to a weakly decaying -hadron. They are an important ingredient in constructing accurate models of -quark production in high energy collisions and must be determined experimentally.
The fragmentation fractions , , , and are defined as the fraction of -quarks that fragment to , , , and -baryon, respectively. The fraction of -quarks that fragment to is expected to be small. New CDF and DELPHI measurements of the -quark fragmentation fractions were presented at the conference and are described below.
CDF has reconstructed the inclusive semileptonic decay channels associated with the weakly decaying -hadrons:
| (9) |
The relative rates for these decay channels can be used to determine ratios of the fragmentation fractions. To illustrate the technique, consider the decay . Reconstructing a uniquely identifies the weakly decaying -hadron to be a . Figure 27 shows the mass distribution for events consistent with the decay hypothesis , . A clear peak is seen in this channel; the rate is then determined by fitting the peak with the expected line shape.

The extraction of -quark fragmentation fractions is complicated by cross contamination among the channels. For example, with contaminates the channel. By accounting for cross contamination and applying the constraint , the -quark fragmentation fractions are obtained. Subsequent to the conference, CDF completed revisions to this analysis and the new results are given in Table 4. The ratio is consistent with the expectation .
DELPHI has used inclusive properties of -quark jets to determine the fragmentation fractions. Two different techniques are used: correlations in the particles produced in association with the -hadron and the charge of the -hadron decay products.
To conserve flavor, a () meson must be produced in association with an -quark, which is likely to result in a () meson that is correlated with the -quark direction. By contrast, a () hadron must be produced in association with a quark, which is likely to result in either a non-strange particle or a () meson that is correlated with the -quark direction.
The fraction of -quarks that fragment to a or one of its excitations is determined by fitting the joint distribution of two variables that identify flavor correlations. The first variable is the rapidity with respect to the thrust axis; it is sensitive to where the meson was produced in the fragmentation chain (see Fig. 28). The second variable is the product of the charge and a variable that is sensitive to whether a -quark or -quark was produced; it is a measure of the flavor correlation described above (see Fig. 29). The fragmentation fraction is determined by correcting for decays that do not give rise to a weakly decaying meson.


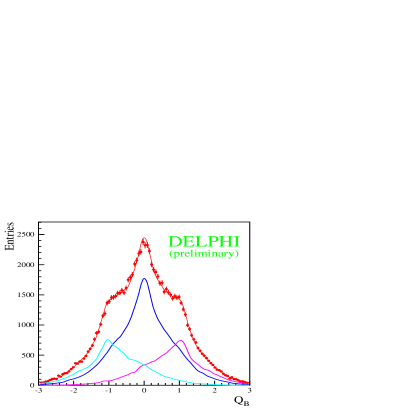
The fragmentation fractions , can be extracted from the net charge of particles associated with the secondary vertex. A net charge of 0 is obtained from , , and neutral -baryons, while a net charge of is obtained from and charged -baryons. Delphi has determined and by fitting the vertex charge distribution (Fig. 30) and estimating the contributions from () and -baryons ( of which 7% are charged, 93% neutral). Alternatively, the data are fit assuming and is allowed to vary.
The -quark fragmentation function results are summarized in Table 4. In addition to the new results described above, the particle data group averages and a published ALEPH measurement of not included in the particle data group average are given. The new results are in good agreement with the particle data group averages and substantially reduce the uncertainties in the -quark fragmentation fractions.
| Source | Quantity | Measurement |
|---|---|---|
| CDF | ||
| DELPHI | ||
| CDF | ||
| DELPHI | ||
| PDG (1998) | ||
| CDF | ||
| DELPHI | ||
| PDG (1998) | ||
| CDF | ||
| DELPHI | ||
| PDG (1998) | ||
| ALEPH | ||
| CDF | ||
| DELPHI |
6 Charmonium Production
Charmonium production in high energy collisions probes the evolution of an initial state consisting of one or more gluons to a color singlet final state. In the color singlet model, the color singlet final state is produced directly, as in or , and the dominant source of production expected to be from -hadron and decay. However, CDF and DØ have measured production cross sections significantly larger than predicted by the color singlet model with a large fraction of the produced directly and not originating in feeddown from or -hadron decay. Furthermore, CDF has measured the production cross section to be a factor of larger than predicted by the color singlet model.
An alternative way to produce a color singlet final state is described by the color octet model, where a color octet state is produced in the hard collision. The color octet state then evolves to a color singlet state through the emission of soft gluons, as in or . New measurements that test the octet model predictions were presented at the conference and are described below.
The non-perturbative matrix elements for production in the color octet model were obtained by fitting the CDF spectrum in the central region (). Given these matrix elements, the cross section in other kinematic regions is predicted by the color octet model. DØ has studied production in the forward region () using its small angle muon spectrometer. The dependence of the forward cross section on and is shown in Figs. 31–32. The color octet model is reasonably successful in predicting the behavior of the forward cross section with no further tuning of parameters.


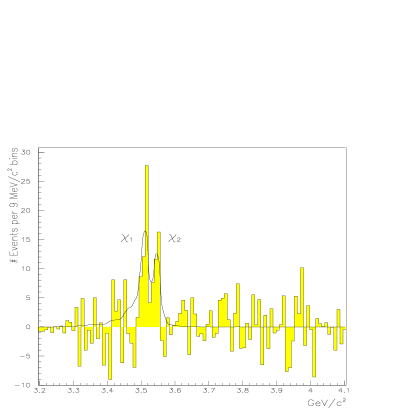
The production of mesons in proton–silicon collisions has been studied by E771 at Fermilab. Photon conversions are used to reconstruct decays (see Fig. 33). The and states are resolved and the ratio of their production cross sections was measured to be
| (10) |
When combined with other measurements of in proton–nucleon collisions, is obtained, in good agreement with the color octet prediction of .
The color octet model can also be tested by measuring the rate for prompt production in boson decays. The dominant production mechanism is expected to be gluon fragmentation followed by soft gluon emission to reach a color singlet state: , . New results were presented at the conference on the observation of prompt mesons by L3 in boson decays.
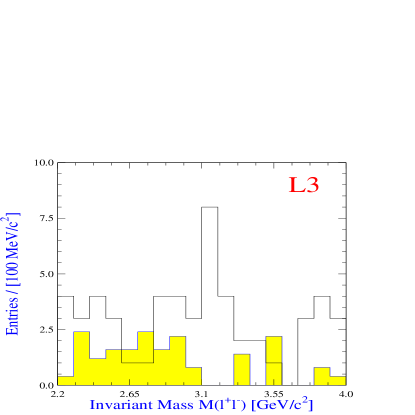
The decay of -hadrons to is the dominant source of mesons observed in boson decay. The signature for prompt decay is that the is isolated and not associated with a jet. Two different isolation criteria are used: minimal additional energy in a 30∘ cone about the direction (see Fig. 34) and no jets within 40∘ of the (see Fig. 35). The fraction of decays from prompt production is calculated for both isolation criteria and is found to be consistent. Combining the results for the two criteria, the prompt branching ratio is found to be
| (11) |
where the first error is statistical, the second error is systematic, and the third error is theoretical. The measurement is in good agreement with the color octet prediction of .

One discrepancy between data and the color octet model has been the photoproduction cross section near . However, it is argued that the NLO calculation breaks down in this region and requires resummation of higher order logarithmic terms. Further tests of the color octet model can be performed by measuring the polarization of high mesons in hadron collider experiments and leptoproduction of mesons at large .
Acknowledgements
The author is grateful for the help and assistance provided by the parallel session speakers: Emanuela Barberis, Mary Anne Cummings, Ugo Gasparini, Andre Hoang, Rick Jesik, Johann Kuehn, Alan Litke, Tom Mehen, Lynne Orr, Matthias Neubert, Tomasz Skwarnicki, Frédéric Stichelbaut, Kirsten Tollefson, Yorgos Tsipolitis, and Weiming Yao. The author would also like to thank Roy Briere, Bob Clare, Karla Hagan, and Rob Roser, and Wendy Taylor for their assistance in providing material. This work is supported in part by the U.S. Department of Energy Grant DE-FG02-91ER40688.
References
References
- [1] F. Abe et al., Phys. Rev. Lett. 74, 2626 (1995).
- [2] S. Abachi et al., Phys. Rev. Lett. 74, 2632 (1995).
- [3] M. Takita, these proceedings.
- [4] Derived from 90% CL intervals for CKM elements in C. Caso et al., Eur. Phys. J. C 3, p. 103 (1998).
- [5] F. Abe et al., Phys. Rev. Lett. 80, 2773 (1998).
- [6] F. Abe et al., Phys. Rev. Lett. 79, 3585 (1997).
- [7] S. Abachi et al., Phys. Rev. Lett. 79, 1203 (1997).
- [8] B. Abbott et al., submitted to Phys. Rev. D, Fermilab-Pub-98/130-E (hep-ex/9808034).
- [9] S. Abachi et al., Phys. Rev. Lett. 79, 1197 (1997); B. Abbott et al., Phys. Rev. D 58, 052001 (1998).
- [10] F. Abe et al., Phys. Rev. Lett. 80, 2767 (1998).
- [11] F. Abe et al., Phys. Rev. Lett. 80, 2779 (1998).
- [12] F. Abe et al., submitted to Phys. Rev. Lett., Fermilab-Pub-98/319-E (hep-ex/9810029).
- [13] W. Yao, these proceedings.
- [14] B. Abbott et al., Phys. Rev. Lett. 80, 2063 (1998); B. Abbott et al., submitted to Phys. Rev. D, Fermilab-Pub-98/261-E (hep-ex/9808029).
- [15] K. Kondo, J. Phys. Soc. Jpn. 57, 4126 (1998); 60, 836 (1991); R.H. Dalitz and G.R. Goldstein, Phys. Rev. D 45, 1531 (1992); Phys. Lett. B 287, 225 (1992).
- [16] F. Abe et al., Phys. Rev. Lett. 79, 1992 (1997).
- [17] E. Barberis, these proceedings.
- [18] M. Grünewald, these proceedings.
- [19] L. Orr, these proceedings.
- [20] F. Abe et al., Phys. Rev. Lett. 80, 5720 (1998).
- [21] K. Tollefson, these proceedings.
- [22] M.A.C. Cummings, these proceedings.
- [23] Y.K. Kim et al., Phys. Rev. Lett. 63, 1772 (1989); G. Alexander et al., Phys. Lett. B 265, 462 (1991); G. Alexander et al., Z. Phys. C 68, 17 (195).
- [24] E. Laenen, J. Smith, and W. van Neervan, Phys. Lett. B 321, 254 (1994); E. Berger and H. Contopanagos, Phys. Rev. D 54, 3085 (1996); S. Catani, M.L. Mangano, P. Nason, and L. Trentadue, Phys. Lett. B 378, 329 (1996).
- [25] C.T. Hill, Phys. Lett. B 266, 419 (1991).
- [26] F. Abe et al., submitted to Phys. Rev. D, Fermilab-Pub-98/327-E.
- [27] F. Abe et al., Phys. Rev. Lett. 79, 357 (1997).
- [28] F. Abe et al., Phys. Rev. Lett. 80, 2525 (1998).
- [29] M.S. Alam et al., Phys. Rev. Lett. 74, 2885 (1995).
- [30] T. Skwarnicki, these proceedings.
- [31] R. Barate et al., Phys. Lett. B 429, 169 (1998).
- [32] A. Litke, these proceedings.
- [33] M. Neubert, these proceedings.
- [34] F. Abe et al., Phys. Rev. Lett. 71, 500, 2396, 2537 (1993); 75, 1451 (1995); 79, 572 (1997).
- [35] S. Abachi et al., Phys. Rev. Lett. 74, 3548 (1995); Phys. Lett. B 370 239 (1996).
- [36] M. Mangano, P. Nason, and G. Ridolfi, Nucl. Phys. B373, 295 (1992).
- [37] F. Stichelbaut, these proceedings.
- [38] Y. Tsipolitis, these proceedings.
- [39] F. Abe et al., Phys. Rev. D 53, 1051 (1996).
- [40] D. Fein, Nucl. Phys. Proc. Suppl. 55A, 165 (1997).
- [41] F.I. Olness, R.J. Scalise, and W.-K. Tung, Fermilab-Pub-97/428-T (hep-ph/9712494).
- [42] M.L. Mangano, CERN-TH-97-328 (hep-ph/9711337).
- [43] M. Lusignoli, M. Masetti, and S. Petrarca, Phys. Lett. B 266, 142 (1991).
- [44] U. Gasparini, these proceedings.
- [45] W. Taylor, private communication.
- [46] DELPHI Collaboration, contributed paper #232 to the conference.
- [47] C. Caso et al., Eur. Phys. J. C 3, 1 (1998).
- [48] R. Barate et al., Eur. Phys. J. C 5, 205 (1998).
- [49] R. Baier and R. Ruckl, Z. Phys. C 19, 251 (1993).
- [50] F. Abe et al., Phys. Rev. Lett. 69, 3704 (1992); 79, 572 (1997); 79, 578 (1997).
- [51] S. Abachi et al., Phys. Lett. B 346, 129 (1995).
- [52] E. Braaten and S. Fleming, Phys. Rev. Lett. 74, 3327 (1995); P. Cho and M. Wise, Phys. Lett. B 346, 129 (1995); M. Cacciari, M. Greco, M.L. Mangano, and A. Petrelli, Phys. Lett. B 356, 553 (1995); P. Cho and A.K. Leibovich, Phys. Rev. D 53, 150 (1996); P. Cho and A.K. Leibovich, Phys. Rev. D 53, 6203 (1996).
- [53] R. Jesik, these proceedings.
- [54] B. Abbott et al., submitted to Phys. Rev. Lett., Fermilab-Pub-98/237-E (hep-ex/9807029).
- [55] K. Hagan, private communication.
- [56] M. Beneke, in The Strong Interaction, From Hadrons to Protons, edited by J. Chan, L. DePorcel, and L. Dixon (Stanford, CA, 1996), p. 549.
- [57] P. Cho, Phys. Lett. B 368, 171 (1996).
- [58] K. Cheung, W.-Y. Keung, and T.C. Yuan, Phys. Rev. Lett. 76, 877 (1996).
- [59] L3 Collaboration, contributed paper #559 to the conference.
- [60] S. Aid et al., Nucl. Phys. B472, 3 (1996).
- [61] M. Cacciari and M. Krämer, Phys. Rev. Lett. 76, 4128 (1996); P. Ko, J. Lee, and H.S. Song, Phys. Rev. D 54, 4312 (1996).
- [62] T. Mehen, these proceedings.