Ultra Bright LED Light Injection Calibration System for MINOS
Abstract
We describe here a proposal for a light injection calibration system for the MINOS detectors based on ultra bright blue LEDs as the light source. We have shown that these LEDs are bright enough to span over two orders of magnitude in light intensity, commensurate with that expected in a single scintillator strip in the MINOS neutrino detectors.
1 Introduction
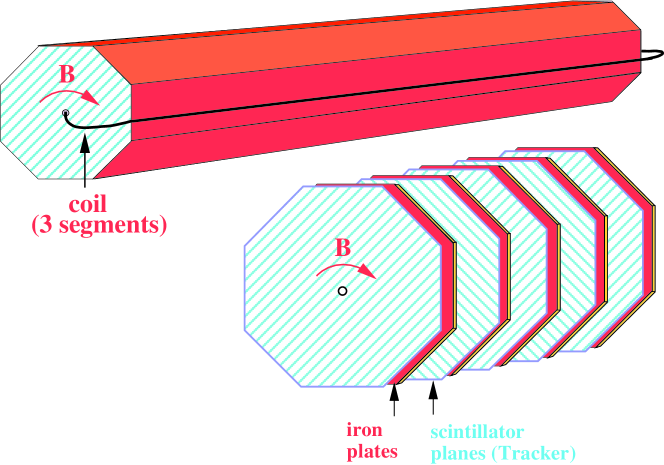
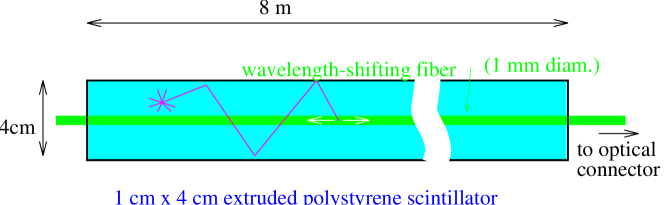
The MINOS experiment consists of two similar detectors, calorimeters made of planes of 1 inch thick steel and 1cm x 4cm cross-section plastic scintillator strips. The detectors will be octagonal in shape and toroidally magnetised by a coil threaded through a hole in the center of the toroid. A picture of the far detector is shown in Figure 1. The plastic scintillator strips will be read out via wavelength shifting (WLS) fibres by photomultipliers as shown in Figure 2.
Such a detector requires calibration using a combination of frequent light injection to give the time dependent response curve of the photodetectors together with some form of test beam data or cosmic rays to provide an anchor point on the response curve to give a relationship between the amount of energy deposited in a single scintillator strip and the amount of light detected by the photodetector. In general this necessitates an extrapolation over two orders of magnitude in light/energy, usually achieved by light injection using a powerful laser. Recently available generic ultra bright LEDs provide an interesting and potentially cheaper, modular and controllable light source as an alternative to the laser system.
Intra-strip uniformity is not particularly of concern in this application. We expect strip to strip differences of up to 30% from the imperfections in the fibre optic connections but the stability of these differences is important. We have optimised our design of the calibration system to maximise the amount of light absorbed by the WLS fibre. A schematic diagram of the light injection setup is shown in Figure 4.
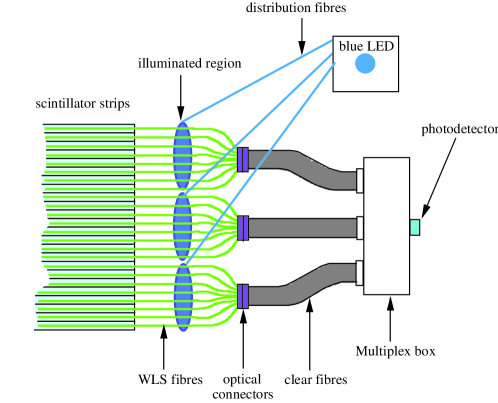

The light from the LED must be efficiently picked up by the clear fibres: the expectation is that one LED will illuminate a bundle of up to 100 clear fibres (taking up an area of 1cm2). This connection will be referred to as the light distribution connector (LDC). Light is injected into the WLS fibres via clear fibres running from the LDC to a light injection module (LIM). In these tests the length of the clear fibres was 1m and the WLS fibres were also of about 1m length.
2 Experimental Setup
The LEDs were driven by a nominal 30nsec square pulse from a standard variable width pulser with a voltage output of between 2.7V and 9.5V. This produces an LED pulse of about 45nsec duration as measured with the photodetector. A schematic of the relative timing of the signals with respect to the gate is shown in Figure 4 for the pulse generator.
The photodetector we have used is a Hamamatsu Photonics R5900-00-M16 [1] [2] [3] which has a 4x4 array of 16mm2 bialkali photocathodes. The M16 is operated at 800V. Data was taken using LeCroy 2249A 12bit ADCs. The LEDs used were generic ultra bright LEDs from RS Components [4] with a peak emission wavelength of 470nm and typical opening angle of 15∘.
3 Spectra Matching
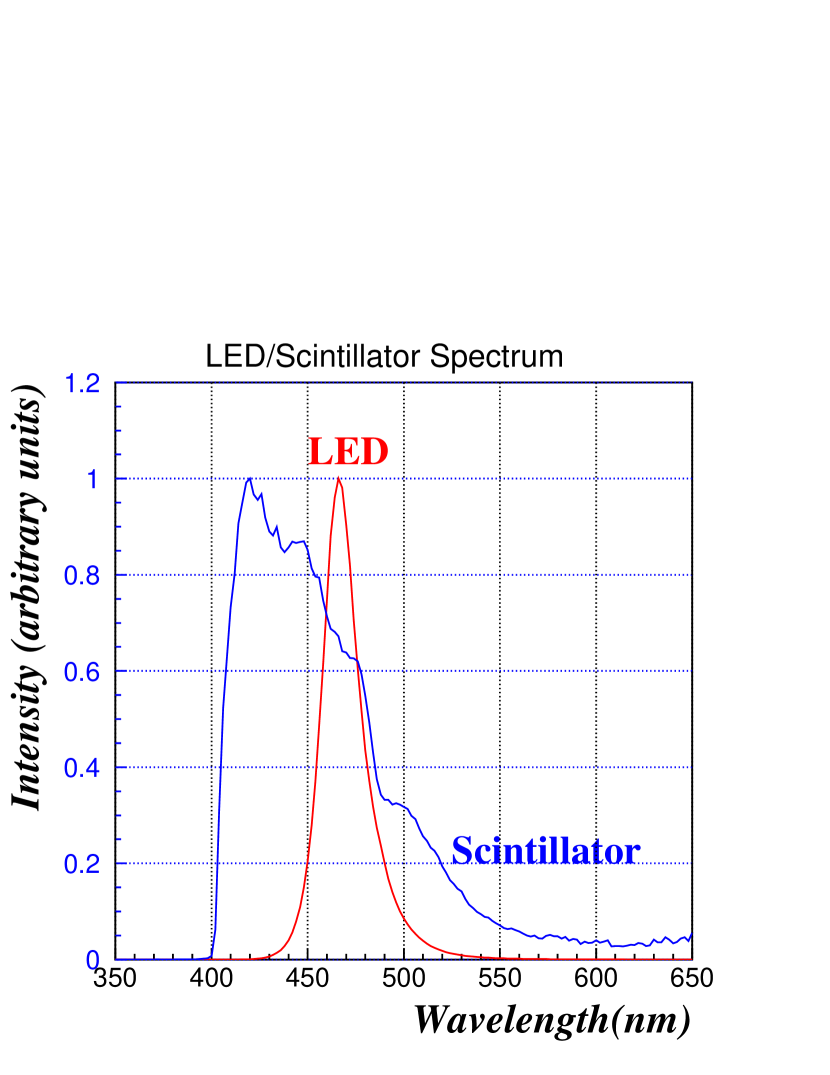
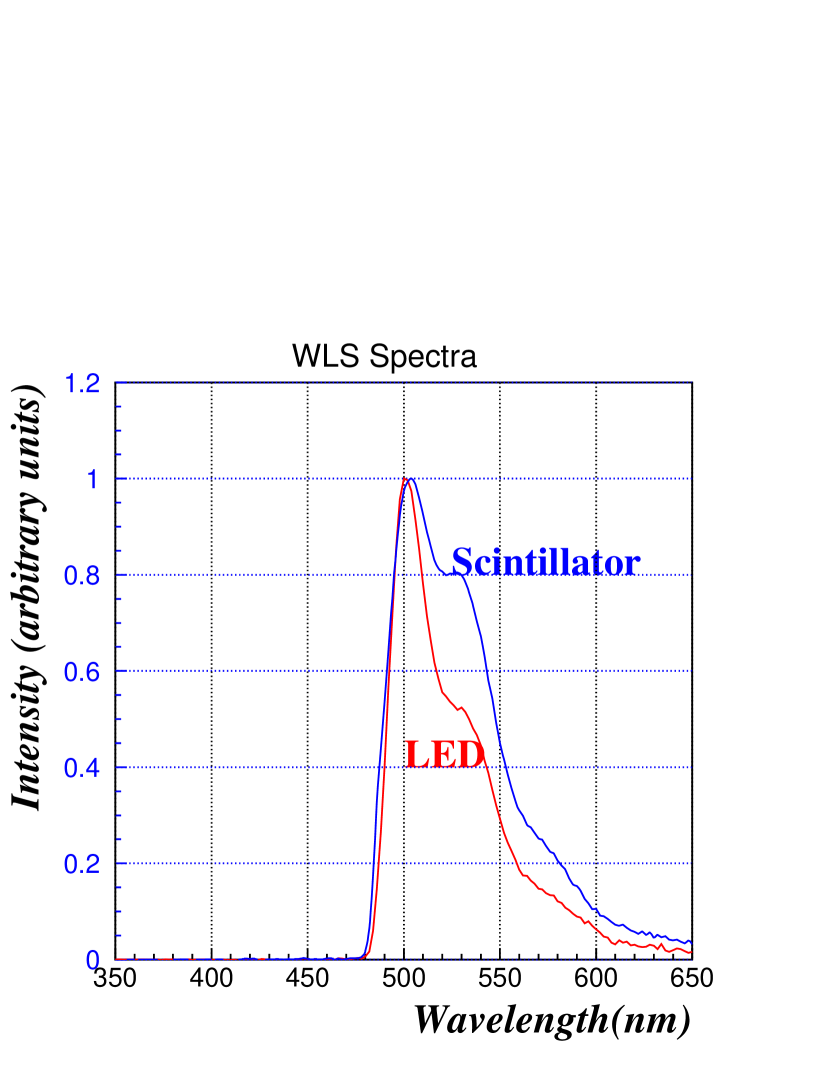
The spectrum of light emitted from the scintillator when excited by a UV laser and for the LED emission is shown in Figure 5(top left). Figure 5(top right) shows the emmision spectrum of the WLS fibre when illuminated by the light from the scintillator and from the LED.
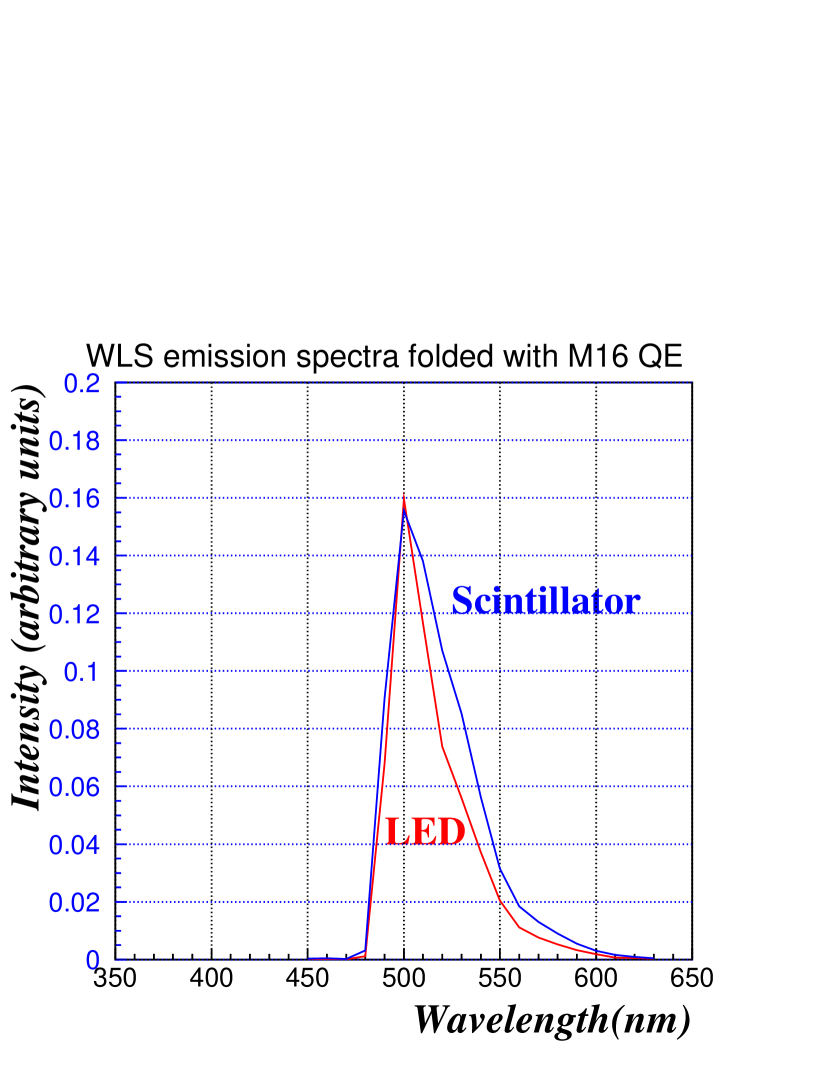
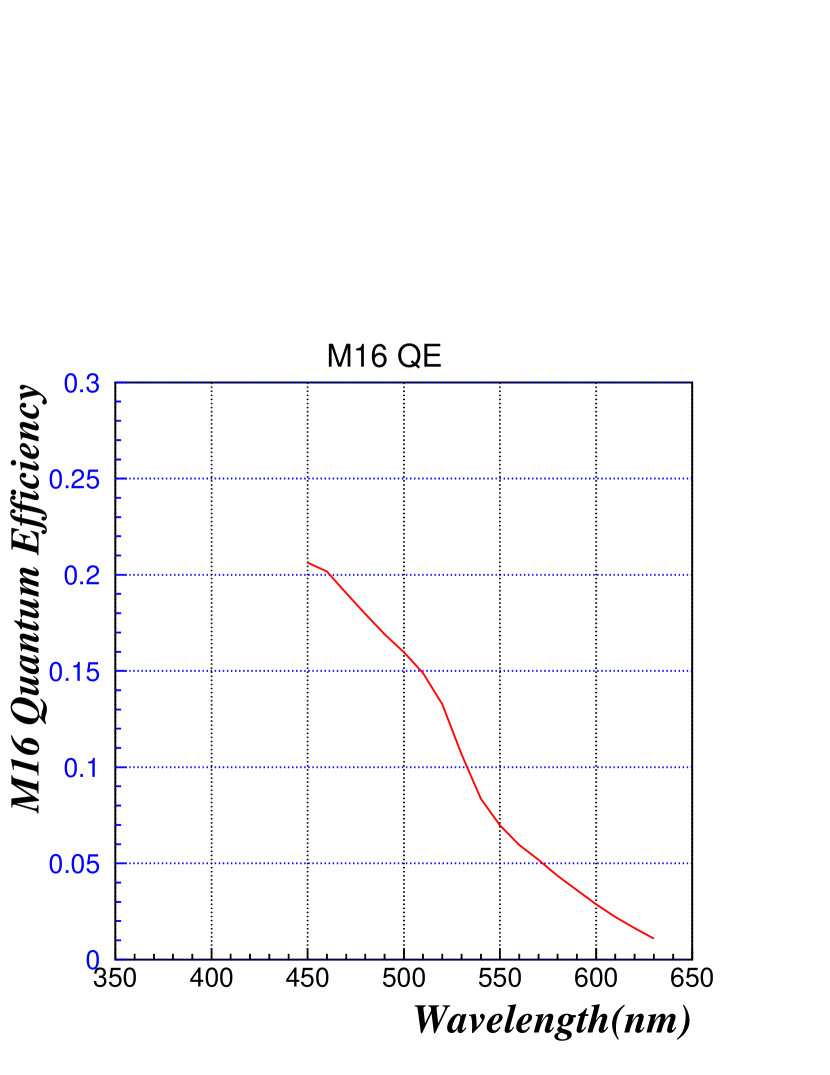
The interesting comparison between the two is after the WLS fibre emission spectra are folded with the quantum efficiency of the bialkali M16 photocathode as shown in Figure 5(bottom left). The form of the quantum efficiency used for this calculation if shown in Figure 5(bottom right).
The agreement at short wavelengths is very good while the difference is not more than 25% over 30% of the operating wavelength. If longer WLS fibres are used, the light coming from the far end of the WLS fibres will be greener leading to the consideration of further optimisation by using LEDs of slightly longer wavelength.
4 Data Analysis
It is assumed that the number of photons and therefore the number of photoelectrons produced at the photocathode by light pulses of fixed size and amplitude has a spread given by Poisson statistics and therefore the number of photoelectrons can be calculated from the width of the ADC distribution.
If the fluctuation of the charge response is dominated by the statistics of the number of photoelectrons, the standard deviation of the charge distribution, should be proportional to the square root of the number of photoelectrons if there is no other contribution to this width such as pulser jitter or electronic noise. The constant of proportionality, is then related to the gain of the photo-tube, the charge of the electron and the scale of the ADC.
The estimated number of photoelectrons, can be obtained using the charge distribution from the following relations:
| (1) |
| (2) |
The average number of photoelectrons, and the gain are then given by:
| (3) |
| (4) |
In practice, there will be other contributions to the width of the charge distribution. By ignoring them completely, measured in this way will be underestimated. From a measurement of the pedestals the contribution to the width from the electronics noise can be estimated. This is independent of and could simply be subtracted if it were sizeable. We estimate the jitter from the pulser to be about 5ns. This corresponds to about 10% of the light pulse and so we calculate a systematic underestimate of by 20%. This has not been corrected for in the measurements presented.
5 Light Distribution Connector (LDC)

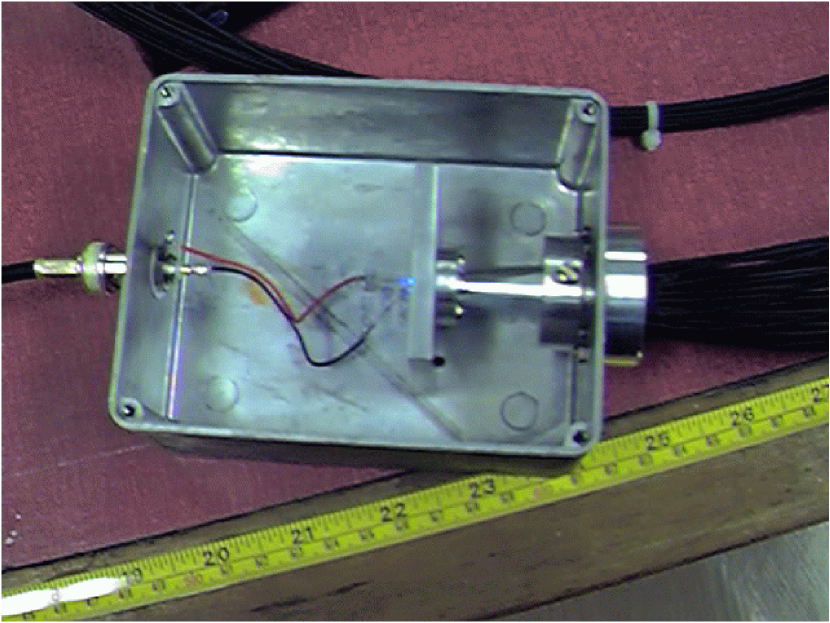
A connector has been designed to distribute light from the LED to 100 clear fibres which will transport the light to the WLS fibre manifolds. An aluminized mylar cone LDC was designed for this purpose as shown in Figure 6.
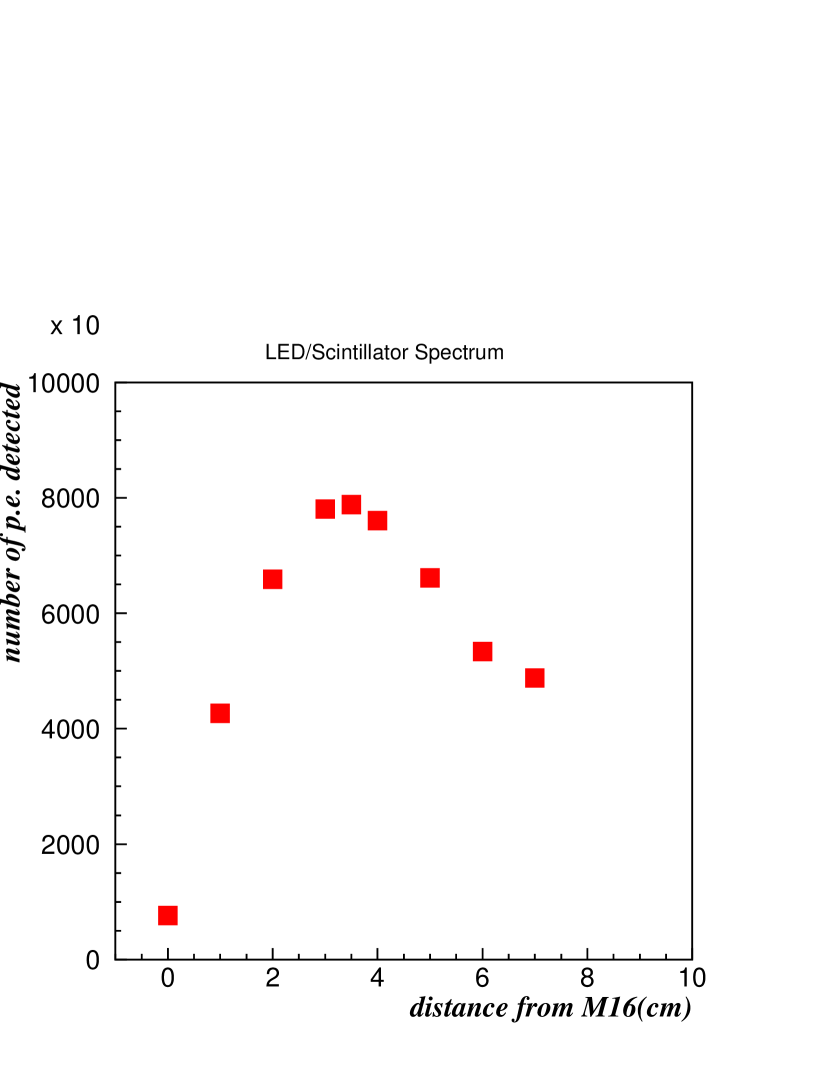

The number of photoelectrons , produced from an LED pulse transmitted through one clear fibre in this setup was measured to be 450,000 (after correction for dead space between pixels) with the standard pulse and PMT operating voltage described above. In order to make this measurement, and avoid saturation of the ADC, the whole face of the M16 was illuminated and the voltage on the LED was reduced to 2.7V. The number of photoelectrons was calculated separately in every channel and then added. from the clear fibre as a function of distance from the M16 is shown in Figure 7(top) summed over all pixels. The distribution of photoelectrons across the face of the M16 at 4cm distance is also shown (bottom). The rapid fall off in number of photoelectrons below 4cm is due to the increasing importance at small distances of the dead space of 1mm between the 4mm wide pixels.
6 Light Injection Module (LIM)
The Light Injection Module (LIM) has upon it the constraint that it be no thicker (in any one dimension) than 1.5cm which is dictated by the thickness of the scintillator manifold where the light will be injected into the WLS fibres. From an engineering point of view, the best geometry would be with the clear fibre entering the LIM parallel to the WLS fibres. The dependence of the absorption of light by WLS fibre as a function of angle of illumination can be studied to ascertain the optimum incident angle.
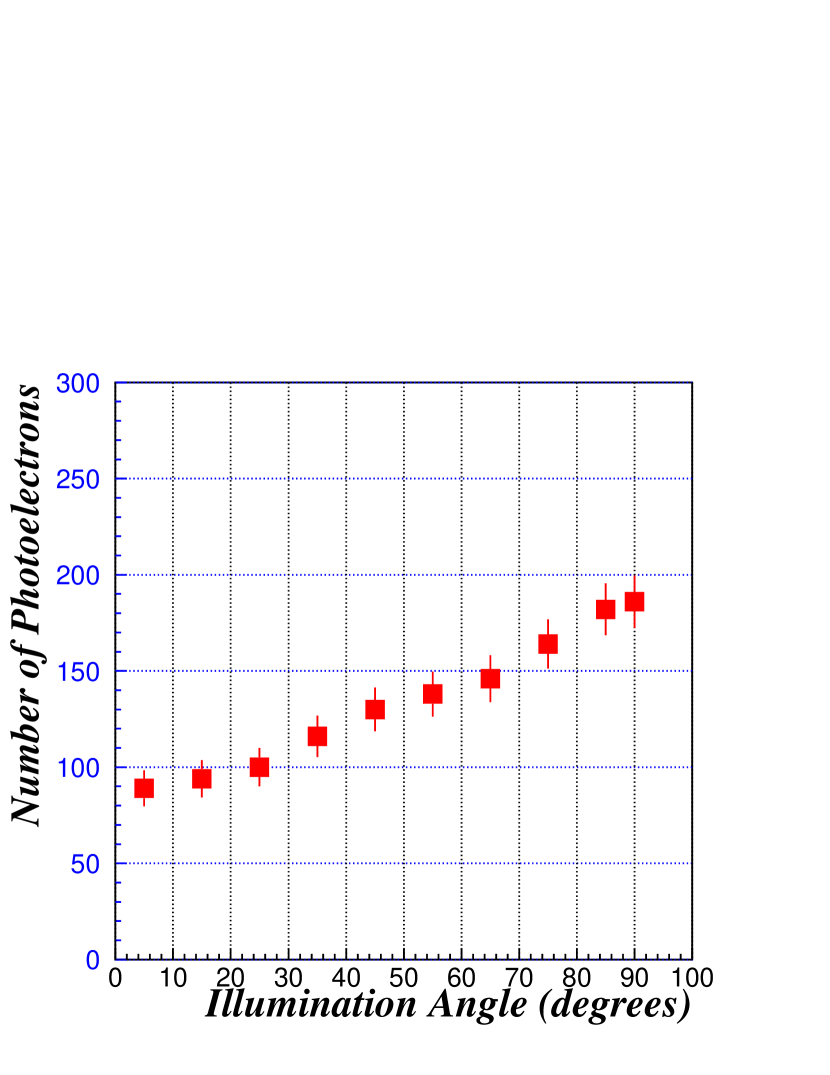
The opening angle of light exiting the clear fibre has a width of 12∘. Each clear fibre must illuminate 8 1mm diameter WLS fibres so in order to maximise brightness over intra-WLS uniformity, the clear fibre should be positioned such that the light projects a circle of maximum 8mm diameter onto the WLS fibres, about 1cm away. The set up as shown in Figure 9 provides the freedom to vary the angle of the light from the clear fibre with respect to the WLS fibres and study the effect on the number of photoelectrons at the PMT. as a function of polar angle is shown in Figure 11. It was found that the amount of light being absorbed by the WLS fibre dropped off as the angle of illumination was reduced, probably due to light reflecting off the surface of the WLS fibre.

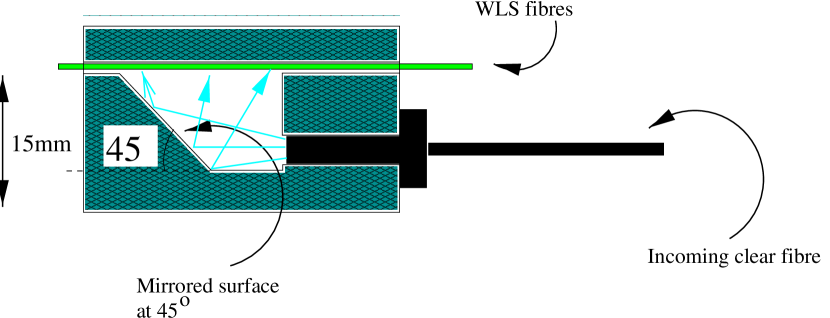
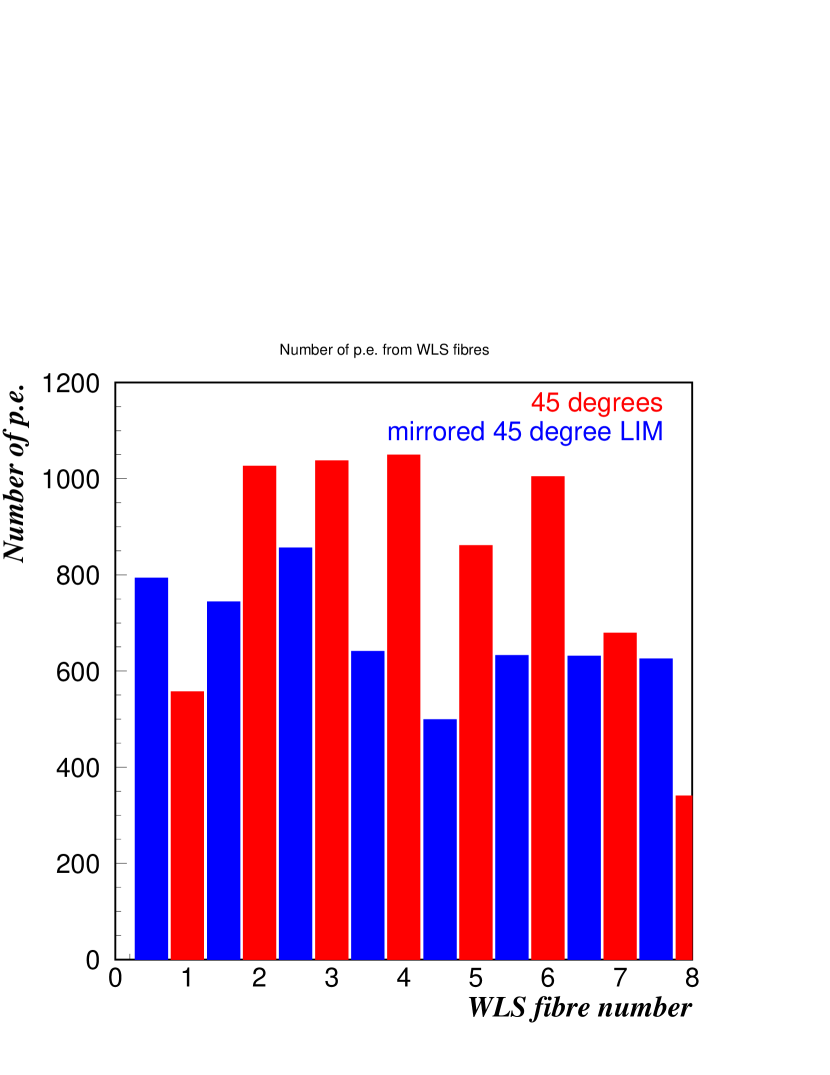
From this measurement, it is clear that the light is better absorbed by the WLS fibre if the angle of incidence is close to 90∘. In order to satisfy this condition and that imposed by the geometry, a mirrored surface at 45∘is used inside the LIM to deflect the light from approximately parallel to approximately perpendicular with respect to the WLS fibres. The LIM is pictured in Figure 9. The number of photoelectrons measured from each of the WLS fibres with this setup is shown in Figure 11. Compared with the direct illumination at 45∘, the reflected light injection is slightly less efficient, but yields better uniformity over the eight WLS fibres.
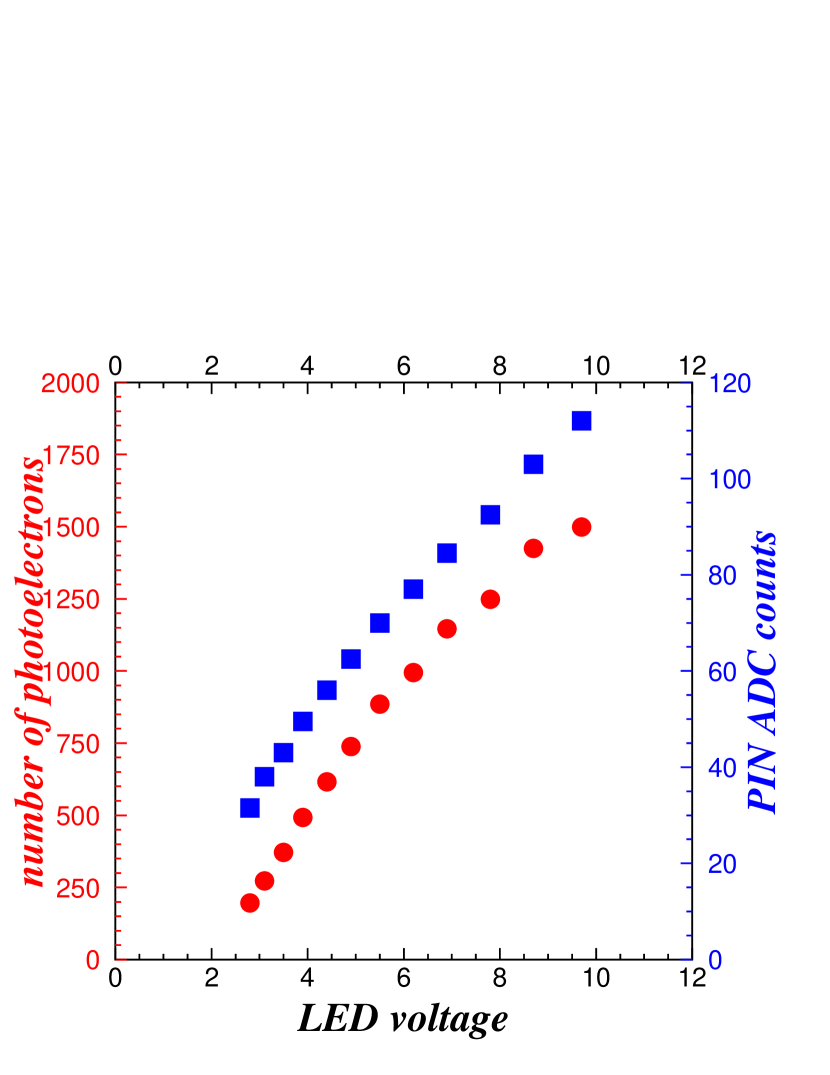
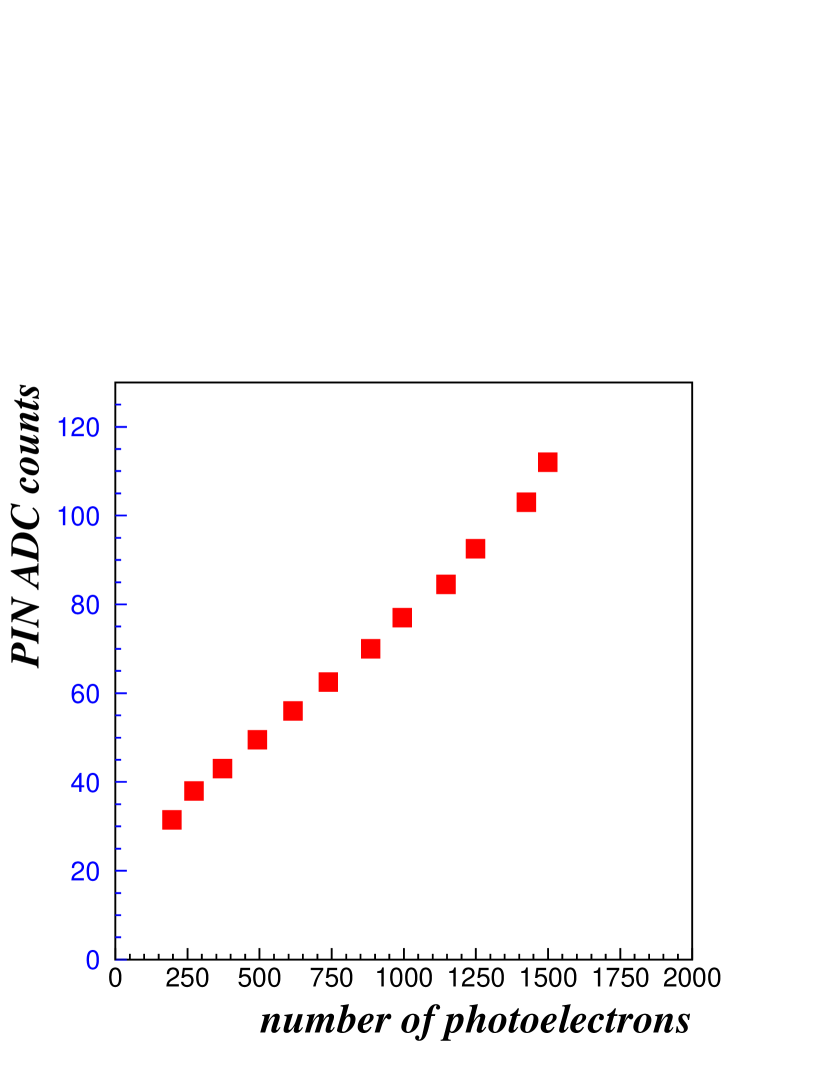
7 LED Voltage Studies
The number of photoelectrons measured with the M16 photomultiplier as a function of voltage applied to the LED via an attenuator is shown in Figure 13. The light from the LED was also measured directly using a S5077 Hamamatsu Silicon PIN photodiode and read out through a LeCroy 2249A ADC with a 1s gate. The relationship between number of photoelectrons and PIN photodiode output is shown in Figure 13 at 12 different LED voltage settings. It is expected that the PIN photodiode has very good stability and will be used to monitor the LED output over time. The absolute level of light from the LED is not so important if cosmic ray muons will be used to give an absolute relationship between light and energy. This can be done in the MINOS detector about once per month and the PIN photodiode will monitor changes in light level inside of a month.
8 Conclusion
Using generic ultra bright LEDs of 470nm wavelength, we have demonstrated a proof of principle for using these devices as a light source for calibration purposes. Using one LED for 800 WLS fibres, enough light is produced to span two orders of magnitude using voltage attenuation. This is sufficient for calibration of the MINOS calorimeter.
References
- [1] Hamamatsu Photonics Multianode Photomultiplier Tube R5900U-00-M16 Series.
- [2] Hamamatsu Photonics K.K., 325-6, Sunayama-cho, Hamamatsu City, 430, Japan, U.S. Main Office: 360 Foothill Road,, P.O. BOX 6910, Bridgewater, NJ 08807-06910.
- [3] M16 papers. Bahr et al. NIM A330 (1993) 103. Apollinari et al. NIM A324 (1993) 475. Bonushkin et al. NIM A381 (1996) 349 Lindgren et al. NIM A387 (1997) 53.
- [4] RS Components Stock Number : 235-9922
| LED | Intensity | View | Peak Wavelength | ||
|---|---|---|---|---|---|
| mA | mA | mcd | Angle | nm | |
| RS Ultra-bright | 20 | 3.6 | 2000 | 15∘ | 470 |