Atmospheric and Astrophysics Neutrinos with MACRO
Abstract
-
† INFN, Sezione di Bari, Via Amendola 173, 70126, Italy
-
Abstract. MACRO can detect three topologies of neutrino induced events, corresponding to different parent neutrino energies. The most numerous sample is made of upward throughgoing muons induced by atmospheric neutrinos of average energy 100 GeV. The ratio of the observed over the expected events is . The observed zenith distribution does not fit the expected one in the no-oscillation hypothesis, giving a maximum probability of 0.1. Considering the oscillation hypothesis the best probability (17) is obtained for maximum mixing and of a few times 10-3 eV2. The other detected samples are due to internally produced events and upward-going stopping muons, corresponding to an average neutrino energy of around 4 GeV. The results concerning these lower energy sample show a deficit and a shape of the angular distributions in agreement with that predicted by the oscillation model suggested by the higher energy sample.
No evidence of a neutrino signal due to dark matter particles in the direction of the core of the Earth and of the Sun has been found among the background due to atmospheric neutrinos and limits have been set. The neutralino hypothesis is investigated and limits on its mass are given.
-
† INFN, Sezione di Bari, Via Amendola 173, 70126, Italy
-
Abstract. MACRO can detect three topologies of neutrino induced events, corresponding to different parent neutrino energies. The most numerous sample is made of upward throughgoing muons induced by atmospheric neutrinos of average energy 100 GeV. The ratio of the observed over the expected events is . The observed zenith distribution does not fit the expected one in the no-oscillation hypothesis, giving a maximum probability of 0.1. Considering the oscillation hypothesis the best probability (17) is obtained for maximum mixing and of a few times 10-3 eV2. The other detected samples are due to internally produced events and upward-going stopping muons, corresponding to an average neutrino energy of around 4 GeV. The results concerning these lower energy sample show a deficit and a shape of the angular distributions in agreement with that predicted by the oscillation model suggested by the higher energy sample.
No evidence of a neutrino signal due to dark matter particles in the direction of the core of the Earth and of the Sun has been found among the background due to atmospheric neutrinos and limits have been set. The neutralino hypothesis is investigated and limits on its mass are given.
1 Introduction
In the past years, the water Cherenkov experiments IMB and Kamiokande have observed around the 60 of the expected double ratio of contained muon neutrino to electron neutrino interactions [1]. More recently, the Soudan 2 experiment has confirmed the anomaly using an iron–based detector [2]. On the other hand, the earlier results from the iron calorimeters NUSEX and Frejus are consistent with the expected number of contained events though with smaller statistics [3].
Here we present the measurement of the high energy muon neutrino flux and its interpretation in terms of neutrino oscillations and the first results concerning the low energy events in MACRO.
2 Neutrino detection with MACRO
The MACRO detector important features for neutrino detection are its large area, fine tracking granularity, symmetric electronics with respect to upgoing versus downgoing particles, good timing and angular resolutions. Moreover, the rock overburden with minimum thickness of 3150 hg/cm2, significantly larger than for other experiments (e.g. Baksan and IMB), reduces the surface muon flux of a factor of around 106, hence providing a shield to possible sources of background induced by downgoing atmospheric muons. These features permit a fully–automated analysis of both downgoing and upgoing muons. The symmetric time measurement provides an important tool to study the detector acceptance and possible sources of background using the huge statistics of downward-going muons.
The MACRO detector, described in Ref. [4] is located in the Hall B of the Gran Sasso Laboratory. It is a large rectangular box of m3, divided longitudinally in six similar supermodules and vertically in a lower part (4.8 m high) and an upper part (4.5 m high), called “attico”. The lower half of the detector is filled with rock absorber between horizontal streamer tube planes, while the attico is empty and contains the electronics racks and work areas. There are 10 horizontal streamer planes in the bottom half of the detector and 4 planes on the top made of 3 cm wire cells and 27∘ stereo strip readouts. Six vertical planes of streamer tubes cover each lateral side of the detector. The scintillator system consists of around 600 tons of liquid scintillator inside 12 m long counters which make three horizontal layers and a vertical layer for each lateral wall. The time (position) resolution for muons along a scintillator box is about 500 ps ( cm).
The schematic plot in Fig. 2 illustrates the three detectable neutrino event topologies: Up Through, Internal Up (IU), Upgoing Stopping s (UGS) and Internal Down (ID) events. The Up Through and Internal Up events are measured using the time–of–flight tecnique as the events cross at least two scintillator layers. The Upgoing Stopping s and Internal Down events cross only one scintillator. The lack of time information prevents to distinguish the two sub-samples. Fig. 2 shows also the parent neutrino energy distributions for the detectable event topologies. The average neutrino energies are 100 GeV for Up Through muons, 4 GeV for Upgoing Stopping s together with Internal Down events and the same for Internal Up events. The Up Through s and the Upgoing Stopping s are externally produced events coming from interactions in the rock surrounding MACRO. In the case of Up Through, the muons cross the detector. The absorber in the lower half of the detector determines an energy threshold of 1 GeV for vertical muons. The Internal Up and Internal Down events come from interactions with vertex inside the bottom half of the apparatus.
If the atmospheric neutrino anomaly is the result of oscillations with eV2 it is expected a reduction in the flux of the upward throughgoing muons and a distortion in the shape of their angular distribution. In fact, the longer pathlength of neutrinos coming from the nadir with respect to that coming from the horizon should cause a stronger reduction of the flux near the vertical than near the horizontal. On the other hand, for lower energy events and with these values of , it is expected a reduction of their flux of about a factor two and no distortion in their angular distribution.
The measurements of the three topologies corresponding to different energy ranges permit the investigation of distinct regions of the oscillation parameter space. Moreover, measuring two topologies with energy spectra in the same energy range, will allow MACRO to evaluate a double ratio, with consequent cancellation of most of the theoretical errors.
2.1 Upward Throughgoing muons
The signature for muon neutrino induced events is the versus of flight of muons: neutrinos can cross amounts of matter from 10 to 104 km (the diameter of the Earth) and can be detected through their charged current interactions in the surrounding rock as upward-going muons. On the other hand, the neutrino induced downward-going muons cannot be discriminated among the atmospheric muons of many orders of magnitude more numerous.
The data have been collected during three periods with different detector configurations: in the first two periods (March 1989 – November 1991 and December 1992 – June 1993) only lower parts of MACRO were into acquisition; during the last period (April 1994 – November 1997) MACRO was put into acquisition in its final configuration including the attico. The analysis of the first two samples of data is described in Ref. [5]. Around 3 years of data have been analyzed with the final configuration [6].
In Fig. 4(a) the distribution is shown ( is proportional to the measured time–of–flight). Muons downward-going through the detector are expected to have , while muons moving upward are expected to have . This distribution is obtained by imposing several cuts to remove the background caused by radioactivity in narrow coincidence with muons, showering events and multiple muons which may result in bad time reconstruction. The most important requirement is that the position along the scintillator counter measured using the streamer tubes has to differ from the one from the times measured at the two ends of the counter by less than cm ( cm for nearly horizontal tracks). When a muon crosses three scintillator layers (almost 50 of the tracks), there is redundancy in the time measurement and is calculated by a linear fit of the times as a function of the pathlength. Tracks with poor fits are rejected. Other minor cuts are applied for tracks which intercept only two scintillator layers. The achieved rejection factor of upward throughgoing muons with respect to atmospheric muons is .
The requirement that throughgoing muons should cross at least 200 g/cm2 has been applied to reduce at the percent level the background due to an undetected downward-going muon which interacts in the rock surrounding the detector and produces a detected upgoing particle (in most of the cases a pion) [7]. Finally, we have observed that a large number of nearly horizontal upgoing muons () come from the azimuth angle region between , which corresponds to a cliff in the direction of Teramo. We exclude this angular region due to the unsufficient rock coverage.
The total number of upward throughgoing muons with in the interval is 479. Based on events outside the upward-going muon peak, we estimate a background of events due to incorrect measurement (such as in the case of more tracks crossing the same scintillator counter) and that there are events resulting from upward-going charged particles produced by downward-going muons in the rock. Finally, it is estimated that events are the result of interactions in the bottom scintillator layer which satisfy the upward-going muon analysis requirements. Hence, removing the backgrounds and the internally produced estimated events, the total number of measured upward throughgoing muons is 451.
The expected upward-going muon flux is obtained using the Bartol flux [8], the Morfin and Tung parton distributions set [9] for the calculation of the CC cross-sections (chosen because of the good agreement of the total cross section with the world average at GeV). The propagation of muons to the detector has been done using the energy loss calculation by Lohmann et al [10]. The total theoretical uncertainty in the calculation of the upward-going muon flux, obtained summing in quadrature the errors is . This error concerns the normalization of the flux, not the shape which does not vary changing the inputs of the calculation and it is known at the level of few percents [11]. The total number of expected events is 612, giving a ratio of the observed to the expected events of . Fig. 4(b) shows the zenith distribution of the measured flux of upward throughgoing muons with GeV compared to the expected one. The dashed line represents the flux obtained in the hypothesis of oscillation with maximum mixing and eV2.


Figure 2: On the left: different topologies induced by interactions in or around MACRO: Up Through, Internal Up (IU), Upgoing Stopping (UGS) s and Internal Down (ID). On the right: distributions of the parent energy giving rise to the 3 different event topologies computed by Monte Carlo using the same cuts applied to real data and normalizing to 1 yr of data taking. The average neutrino energies of the samples are: GeV for Up Through, GeV for IU and GeV for UGS s and ID. The test applied to the angular distribution gives for 8 d.o.f. (probability of 0.1 for a shape at least this different from the expectation) for the no-oscillation hypothesis excluding the last bin due to a possible contamination of atmospheric horizontal muons and normalizing the prediction to the data (the main theoretical error concerns the normalization). The best when testing the hypothesis is 15.8 for around 0.0025 eV2 and maximum mixing (if the bound on the meaningful interval of is released the best is found for mixing greater than 1). The independent probabilities for obtaining the observed number of events and the angular shape of the distribution calculated for maximum mixing and varying are shown in Fig. 6 (plot on the left). The region in which the two probabilities have their maximum is similar. In Fig. 6 (plot on the right) the solid lines represent the iso-probability contours in the oscillation parameter space obtained combining the two independent probabilities. The curves correspond to 10 and 1 of the maximum probability of 17 obtained for maximum mixing and eV2. The dashed lines are the contours of the confidence regions at the 90 and c.l. based on the Monte Carlo prescription in Ref. [12]. This prescription assumes that the hypothesis is correct. The sensitivity curve results from the preceding prescription if the data and Monte Carlo happened to be in perfect agreement at the maximum probability point. The allowed regions are smaller than the sensitivity curve due to the fact that the absolute minimum is outside the physical region. The same procedure has been applied considering the hypothesis of muon neutrino oscillations into a sterile neutrino [13] and the maximum probability obtained is 2.

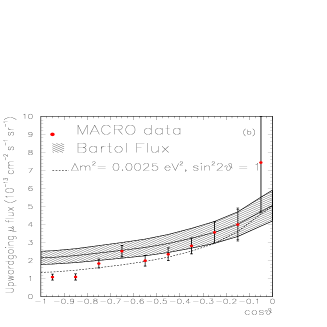
Figure 4: (a) distribution for the full detector data. The downgoing muon peak contains millions of events and the well separated upward throughgoing muon peak contains 398 events. The shaded part of the distribution is for the events which cross 3 scintillator layers. (b) Zenith distribution of the flux of upward throughgoing s with GeV for the data and the Monte Carlo. The solid line shows the expectation for no-oscillations with the 17 theoretical uncertainty (shaded region). The dashed line is the prediction for an oscillated flux with and eV2. 

Figure 6: On the left: probabilities for obtaining the observed MACRO zenith distribution shape and total number of events in the oscillation hypothesis as a function of and for . On the right: probability contours from the combined probabilities in the plot on the left. The best probability is 17 and the iso-probability contours (solid lines) are shown for 10 and 1 of this value. The confidence regions (90 and c.l.) calculated according to Ref. [12] (dashed lines) and the sensitivity curve of the experiment (dotted line) are shown. 
Figure 8: Comparison between measured and expected low energy event distributions vs . The dashed line is obtained assuming oscillations with parameters coming from the Up Through sample. 2.2 Low energy events
The data sample for the analyses of low energy events has been collected in yr of data with the full detector. The analysis of the Internal Up events is similar to the Up Through analysis, with the additional requirement that the interaction vertex lies inside the apparatus. From a full Monte Carlo using the Bartol neutrino flux [8], the cross-sections in Ref. [14] and the Lohmann et al muon energy loss [10], it is found that about 87 of the events are due to CC interactions. The simulation has been performed in a large volume of rock (170 Kton) around the apparatus (5.3 Kton). The theoretical uncertainty estimated for the calculation is about 25. The preliminary estimated systematic error on the acceptance and analysis requirements is . After background subtraction (3 events) 85 events are selected as Internal Up events.
The Internal Down events and the Upgoing Stopping s are selected through topological cuts: the main requirement is the presence of a track crossing the bottom scintillator layer at least 1 m from the detector walls. To reject ambiguous and/or wrongly reconstructed tracks which survived the software cuts, real and simulated events were randomly merged and visually scanned. Three different samples have been selected according to the choice of the minimum number of streamer plane hits. In Fig 8 we show the angular distribution of the 120 events (after the background subtraction of 5 events) which cross at least 3 streamer planes (corresponding to g/cm2) and the angular distribution of the Internal Up events.
In Tab. 2 the total number of measured and expected events (no-oscillation and hypothesis) are summarized for the two topologies. The low energy events show a uniform (as a function of ) deficit of roughly a factor of 2 with respect to the expected ones in the no-oscillation hypothesis. This result is in agreement with the prediction based on the oscillation hypothesis coming from the Up Through sample.
Table 2: Low energy event summary. The predictions with oscillations are for and eV2. Topology Data MC (no-oscillation) MC() Up Through 451 Internal Up 85 Int. Down + UGS 120 3 The search for dark matter
The existence of non-baryonic dark matter has been suggested due to many evidences indicating that the density of matter in the universe, (in units of the critical density), is greater than 0.3. Theoretical prejudices for a flat universe require the density of the universe to be . These indications and hypotheses together with the upper limits on luminous matter () [15] and on baryonic mass from primordial baryonic nucleosynthesis (i.e. at 95 c.l. for [16]) explain the need for non-baryonic dark matter. It is a striking coincidence that if a weakly interacting massive dark matter particle (WIMP) exists its abundance would correspond today nearly to the critical density due to the fact that the thermally averaged annihilation cross-section would be comparable to the typical weak interaction cross-section [17].
If R-parity is conserved, supersymmetric (SUSY) theories would provide one of the most plausible candidate, the Lightest Supersymmetric Particle (LSP), which in most theories is the neutralino , the lightest linear superposition of gaugino and higgsino eigenstates. In Minimal Supersymmetric extensions of the Standard Model (MSSM) including the GUT relation , with the Weinberg angle, the neutralino mass depends on the gaugino mass parameters , on the higgsino mass parameter and on the ratio of the Higgs doublet vacuum expectation values . Some other parameters must be determined in order to define the processes induced by neutralinos, such as , the mass of the pseudoscalar Higgs boson, the squark and slepton common mass and the trilinear parameters of the family with common value .
The supersymmetric parameter space is constrained by collider searches [18] and lower limits on the neutralino mass are around 20-30 GeV. These limits are model dependent and correlated to chargino limits. In this framework, “direct” and “indirect” methods for detecting galactic halo WIMPs performed with underground detectors can probe complementary regions of the parameter space with respect to collider searches. Direct methods employ low-background detectors (e.g. superconductors or scintillators) to measure the energy deposited when a WIMP elastically scatters from a nucleus; indirect methods measure neutrinos resulting from the annihilation of WIMP pairs.
WIMPs in the halo can lose energy through elastic scattering in the celestial bodies which they intercept and become gravitationally trapped inside their core when their velocity falls below the escape velocity. As their density increases inside the core of the body, their annihilation rate increases until equilibrium is achieved between capture and annihilation rate. High energy s are eventually produced via the hadronization and/or decay of the annihilation products (mostly fermion-antifermion pairs, weak and Higgs bosons). Possible “traps” for WIMPs could be the Sun or the Earth. Many calculations concerning the flux of neutrino induced upward-going muons from neutralino annihilation in the Sun and the core of the Earth have been made [17, 19, 20]. Data on upward muons have been presented by several experiments [21, 22, 23].
3.1 WIMP search with MACRO
The aim of the search is to set flux limits (in absence of an evidence for a signal) on the upward-going muon flux from the core of the Earth and of the Sun. Muon flux limits are evaluated (90 c.l.) as the ratio of the poissonian upper limit for the number of measured events and of expected background events due to atmospheric s inside the search cone around the direction of the celestial body over the exposure (live time times area seen by the source times detection efficiency).
For the search of WIMPs in the core of the Earth a larger sample of 517 (collected up to March ’98) upward throughgoing muons with respect to the analysis in section 2.1 has been used. After background subtraction the total resulting number of events is while the expected events are . As the background for this measurement overcomes the signal in the region around the vertical of the apparatus, we set conservative flux limits for WIMPs in the Earth assuming that the number of measured events equals the expected one [18]. The expected distribution has been normalized by a factor 0.85 (the ratio of measured to expected events with , which is outside the region interesting for the signal). The reason for this normalization is that calculations on atmospheric s are mainly affected by a normalization theoretical uncertainty. The zenith angular distribution of measured and expected events is shown in Fig. 10(a) and the 90 c.l. muon flux limits for an average exposure of 2620 m2 yr (the area decreases of about 37 m2 from 3∘ to 30∘) are plotted in Fig. 10(c) in search cones increasing from to . Considering the results in Ref. [6] (see section 2.1), the hypothesis of with and eV2 has been considered (dotted lines in Fig. 10(a) and (c)).
As for moving sources the background is less relevant than for steady sources, in the case of the Sun we have used 762 events including Internal Up events and events which cross less than 200 g/cm2 through the absorber. The expectation has been obtained using the local coordinates of the measured upward-going events and randomly chosen detection times of downward-going muons measured during the data taking (times are needed in order to evaluate equatorial coordinates). This procedure takes into account the drifts of detection efficiency in time. Fig. 10(b) shows the distribution of the 762 events as a function of their angular separation with respect to the Sun direction. In this distribution events detected during night fall towards -1. In Fig. 10(d) the muon flux limits are shown as a function of 10 arbitrary search cones around the direction of the Sun for an exposure of m2 yr. Some of the limits are summarized in Tab. 4. The minimum muon energies have been chosen where the acceptance of the detector becomes independent on energy. It has an higher value for the Sun because tracks from the Sun direction are more slanted than the ones at the vertical of the detector.
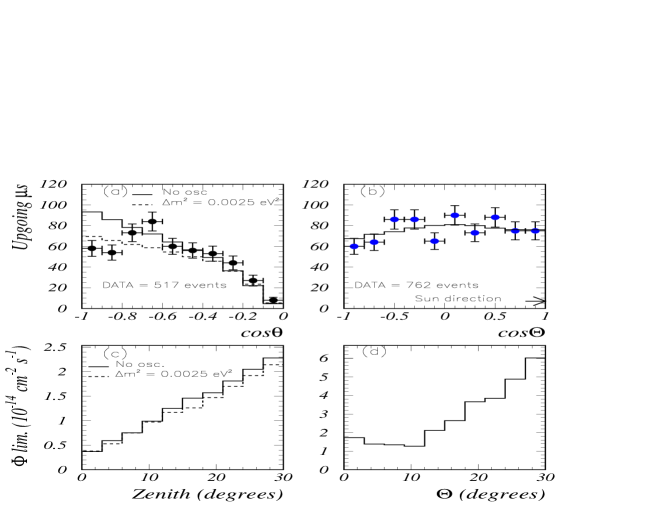
Figure 10: (a) Zenith distribution of measured (circles) and expected (solid line) Up Through . The expectation is normalized to the ratio data/MC for equal to 0.85. (b) Distribution of measured (circles) and expected (solid line) upward-going s vs the cosine of the angular separation from the Sun direction. (c) Muon flux limits (90 c.l.) vs the zenith angle. In (a) and (c) the dotted line is for in the oscillation hypothesis for the background of atmospheric s with and eV2. In this case the normalization factor is 1.19. (d) Muon flux limits (90 c.l.) vs search angle around the direction of the Sun. Table 4: Selected and expected events and c.l. muon flux limits for some of the 10 half-cones chosen around the core of the Earth (exposure 2620 m2 yr, GeV) and the Sun (exposure 890 m2 yr, GeV) direction. EARTH SUN Cone Data Backgr. Flux Limit Data Backgr. Flux Limit (cm-2 s-1) (cm-2 s-1) 76 123.6 2.28 56 51.1 6.02 52 81.2 1.81 33 33.0 3.85 24 32.5 1.25 11 13.0 2.12 10 11.9 7.54 3 4.6 1.35 0 1.3 3.72 2 0.5 1.73 3.2 Upper limits for neutralinos
In the previous section flux limits have been calculated in arbitrary search cones, so that any WIMP model can be constrained by MACRO data. Here we assume that WIMPs are neutralinos and hence we calculate flux limits in the search cones which collect 90 of the signal from neutralino annihilation. The muons from annihilation are distributed around the neutrino direction because of the angle due to the CC interaction in the Earth and to the multiple scattering of muons along the path from the interaction point to the detector. The angle distribution depends on the energy spectrum and hence in principle on the details of the final states of the annihilation process. However, the relevant parameter is . The branching ratios into the final states depend on the supersymmetric model. We estimate that the higher variation of the width of the angle is of the order of 17 when an extreme model (in which only one channel is allowed) is used instead of a more plausible model (as the one used here).
The shapes of the upward-going muon signal has been calculated using fluxes from neutralino annihilation in the Sun and in the Earth given by Bottino et al [19], the CC cross sections in Ref. [14], the muon propagation in Ref. [10] and taking into account the angular resolution of the detector. We have considered the distribution in the core of the Earth [19].


Figure 12: (a) Nadir angle distribution of s from neutralino annihilation inside the Earth for different masses. (b) angle distribution for neutralino annihilation in the Sun and different masses. In (a) and (b) the angular ranges including 90 of the signal are indicated. The 90 c.l. flux limits have been calculated in neutralino mass dependent cones which collect 90 of the signal shown in Fig. 12 for the Earth and the Sun for GeV. In Fig. 14 the experimental limits are superimposed to the fluxes of upward-going muons from Bottino et al [19] calculation as a function of for a muon minimum energy of 1 GeV (the dependence on the energy of MACRO acceptance has been taken into account in the low energy region). The fluxes are calculated varying the model parameters (each model is represented by a dot in Fig. 14) in experimentally allowed ranges: GeV, GeV, , GeV, GeV, , where is the mass of the pseudoscalar Higgs, is the common soft mass of all the sfermions and squarks, is the common value of the trilinear coupling in the superpotential for the third family, with central values of allowed interval for cosmological parameters (rms velocity of in the halo = 270 km s-1, escape velocity in the halo = 650 km s-1, velocity of the Sun around the galactic center = 232 km s-1, local dark matter density GeV cm-3 and minimal value for rescaling the neutralino relic abundance = 0.03). In fact, Bottino et al. assume:
(3) where = 0.03. The fluxes lying above the experimental limit are ruled out as possible SUSY models by this measurement. Fig. 14 indicates that indirect search can have good prospects particularly at high masses.
4 Conclusions
The upward throughgoing muon MACRO data set is in favor of a hypothesis with eV2 and maximum mixing with maximum probability of 17 against the 0.1 probability obtained for the no-oscillation hypothesis. These oscillation parameters are very close to the ones preferred by the SuperKamiokande experiment [25]. The hypothesis found is in agreement with the first results concerning the MACRO low energy neutrino events. However, the study of the shape of the upward throughgoing muon angular distribution gives a maximum probability of only 4.6. This could be due to a statistical fluctuation or to some hidden physics. Having performed numerous systematic checks, we exclude any effect on the anomalous zenith distribution due to the detector.
A search for a WIMP signal has been performed using throughgoing upward s coming from the Earth core and from the Sun. At this time we have observed no signal for this signature and we have calculated upper limits for the flux of upward s from WIMPs. These flux limits have been compared with predictions of SUSY models. Our data have begun to rule out significant portions of the parameter space for WIMPs annihilating in the Earth and in the Sun and currently limits for the Earth are the most stringent limits of all those from “indirect” experiments [21, 22].
References
- [1] Becker–Szendy R et al (IMB Collabor.) 1992 Phys. Rev. D46 3720; Hirata K S et al (Kamiokande Collabor.) 1992 Phys. Lett. B280 146
- [2] Allison W W M et al (Soudan Collabor.) 1997 Phys. Lett. B391 491
- [3] Aglietta M et al (NUSEX Collabor.) 1989 Eurphys. Lett. 8 611; Daum K et al (Frejus Collabor.) 1995 Z. Phys. C66 417
- [4] Ahlen S et al (MACRO Collabor.) 1993 Nucl. Instrum. Methods A324 337
- [5] Ahlen S et al (MACRO Collabor.) 1995 Phys. Lett. B357 481
- [6] Ambrosio M et al (MACRO Collabor.) 1998 HEP-EX/9807005
- [7] Ambrosio M et al (MACRO Collabor.) 1998 Astrop. Phys. 9 105
- [8] Agrawal V, Gaisser T K, Lipari P and Stanev T 1996 Phys. Rev. D53 1314; Gaisser T K , Stanev T and Barr G 1988 Phys. Rev. D38 85
- [9] Morfin J G and Tung W K 1991 Z. Phys. C52 13
- [10] Lohmann W et al 1985 CERN–EP/85–03
- [11] Lipari P and Lusignoli M 1998 Phys. Rev. D57 3842
- [12] Feldman G and Cousins R 1998 Phys. Rev. D57 3873
- [13] Liu Q Y and Smirnov A Y 1998 Nucl. Phys. B524 505
- [14] Lipari P, Lusignoli M and Sartogo F 1995 Phys. Rev. Lett. 74 4384
- [15] Persic M, Salucci P and Stel F 1996 Mon. Not. Roy. Astron. Soc. 281 27
- [16] Olive K A 1997 (Proc. of DARK96, Heidelberg, Germany, ed. by Klapdor–Kleingrothaus H V and Ramachers Y)
- [17] Jungman G, Kamionkowski M and Griest K 1996 Phys. Rep. 267 195
- [18] Caso C et al 1998 Review of Particle Physics Eur. Phys. J. C 1
- [19] Bottino A, Fornengo N, Donato F and Scopel S private communication; Bottino A et al 1995 Astrop. Phys. 3 65
- [20] Bergström L, Edsjö J and Gondolo P, 1997 Phys. Rev. D55 1765
- [21] Boliev M M et al (Baksan Collabor.) 1997 (Proc. of DARK96, Heidelberg, Germany, ed. by Klapdor–Kleingrothaus H V and Ramachers Y)
- [22] Mori M et al (Kamiokande Collabor.) 1993 Phys. Rev. D48 5505
- [23] Losecco J M et al (IMB Collabor.) 1987 Phys. Lett. B188 388
- [24] Bernabei R et al 1996 Phys. Lett. B389 757
- [25] Fukuda Y et al (SuperKamiokande Collabor.) 1998 Phys. Rev. Lett. 81 1562

