Atmospheric neutrino induced muons in the MACRO detector
Abstract
A measurement of the flux of neutrino-induced muons using the MACRO detector is presented. Different event topologies, corresponding to different neutrino parent energies can be detected. The upward throughgoing muon sample is the larger event sample. For this sample, produced by neutrinos having an average energy around 100 GeV, the ratio of the number of observed to expected events integrated over all zenith angles is . We have investigated whether the observed number of events and the shape of the zenith distribution can be explained by an hypothesis of oscillation. The best probability (17%) is obtained for and of a few times eV2, while the probability for the no oscillation hypothesis is 0.1 %. The other samples are due to the internally produced events and to upward-going stopping muons; the average parent neutrino energy is of the order of 4 GeV. The low energy data sets show a deficit of observed events similar to the one predicted by the oscillation model with maximum mixing suggested from the upward throughgoing muon sample.
1 Introduction
The interest in precise measurements of the flux of neutrinos produced in cosmic ray cascades in the atmosphere has been growing over the last years due to the anomaly in the ratio of contained muon neutrino to electron neutrino interactions. The observations of Kamiokande, IMB and Soudan 2 are now confirmed by those of SuperKamiokande with larger statistics and the anomaly finds explanation in the scenario of oscillations [1].
The effects of neutrino oscillations have to appear also in higher energy ranges. The flux of muon neutrinos in the energy region from a few GeV up to a few TeV can be inferred from measurements of upward throughgoing muons [2]. As a consequence of oscillations, the flux of upward throughgoing muons should be affected both in the absolute number of events and in the shape of the zenith angle distribution, with relatively fewer observed events near the vertical than near the horizontal due to the longer path length of neutrinos from production to observation.
Here the measurement about the high energy muon neutrino flux is presented, together with the first results on low-energy neutrino events in MACRO. 111 The MACRO Collaboration : M. Ambrosio, R. Antolini, C. Aramo, G. Auriemma, A. Baldini, G. C. Barbarino, B. C. Barish, G. Battistoni, R. Bellotti, C. Bemporad, P. Bernardini, H. Bilokon, V. Bisi, C. Bloise, C. Bower, S. Bussino, F. Cafagna, M. Calicchio, D.Campana, M. Carboni, M. Castellano, S. Cecchini, F. Cei, V. Chiarella, B. C. Choudhary, S. Coutu, L. De Benedictis, G. De Cataldo, H. Dekhissi, C. De Marzo, I. De Mitri, J. Derkaoui, M. De Vincenzi, A. Di Credico, O. Erriquez, C. Favuzzi, C. Forti, P. Fusco, G. Giacomelli, G. Giannini, N. Giglietto, M. Giorgini, M. Grassi, L. Gray , A. Grillo, F. Guarino , P. Guarnaccia, C. Gustavino, A. Habig, K. Hanson, A. Hawthorne, R. Heinz, Y. Huang, E. Iarocci, E. Katsavounidis, I. Katsavounidis, E. Kearns, H. Kim, S. Kyriazopoulou, E. Lamanna, C. Lane, D. S. Levin, P. Lipari, N. P. Longley, M. J. Longo, F. Maaroufi, G. Mancarella, G. Mandrioli, S. Manzoor, A. Margiotta Neri, A. Marini, D. Martello , A. Marzari-Chiesa, M. N. Mazziotta, C. Mazzotta, D. G. Michael, S. Mikheyev, L. Miller, P. Monacelli, T. Montaruli, M. Monteno, S. Mufson, J. Musser, D. Nicoló, R. Nolty, C. Okada, C. Orth, G. Osteria, M. Ouchrif, O. Palamara, V. Patera, L. Patrizii, R. Pazzi, C. W. Peck, S. Petrera, P. Pistilli, V. Popa, V. Pugliese, A. Rainó, J. Reynoldson, F. Ronga, U. Rubizzo, A. Sanzgiri, C. Satriano, L. Satta, E. Scapparone, K. Scholberg, A. Sciubba, P. Serra-Lugaresi, M. Severi, M. Sioli, M. Sitta , P. Spinelli, M. Spinetti, M. Spurio, R. Steinberg, J. L. Stone, L. R. Sulak, A. Surdo, G. Tarlé, V. Togo, D. Ugolotti, M. Vakili, C. W. Walter and R. Webb.
2 MACRO as a neutrino detector
The MACRO detector provides an excellent tool for the study of upgoing muons. Its large area, fine tracking granularity, symmetric electronics with respect to upgoing versus downgoing muons and fully-automated analysis permit detailed studies of the detector acceptance and possible sources of backgrounds to the upgoing muon measurement. In addition, the overburden of the Gran Sasso Laboratory is significantly larger than that surrounding other experiments (Baksan and IMB), hence providing additional shielding against possible sources of background induced by down-going muons. In our first measurement of upgoing muons [2], we reported on a deficit in the total number of observed upgoing muons with respect to the expectation and also on an anomalous zenith angle distribution. In particular, too few muons were observed near the nadir. Here, we report on a much larger data set [3] which retains the same basic features as reported previously but with larger statistics.
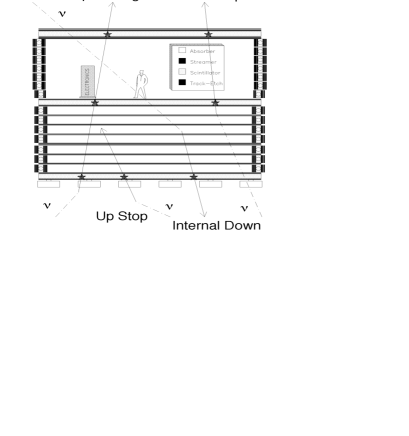
The MACRO detector is located in Hall B of the Gran Sasso Laboratory, with a minimum rock overburden of 3150 hg/cm2. It is a large rectangular box, 76.6 m 12 m 9.3 m, divided longitudinally in six similar supermodules and vertically in a lower part (4.8 m high) and an upper part (4.5 m high). The active detection elements are planes of streamer tubes for tracking and of liquid scintillation counters for fast timing. The lower half of the detector is filled with trays of crushed rock absorbers alternating with streamer tube planes, while the upper part is open and contains the electronics racks and work areas. There are 10 horizontal planes in the bottom half of the detector, and 4 planes on the top, made of wires and 27∘ stereo strip readouts. Six vertical planes of streamer tracking cover each side of the detector.
The scintillator system consists of three layers of horizontal boxes, with vertical boxes along the sides of the detector. The time (position) resolution for muons in a scintillator box in this analysis is about 500 ps ( cm).
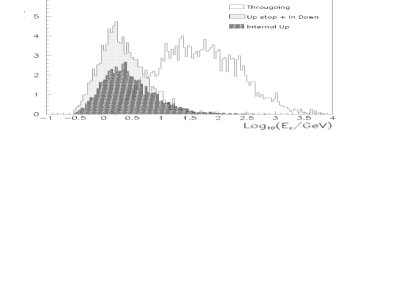
Figure 1 shows a schematic plot of the three different topologies of neutrino events analyzed up to now: events, events and together with events. Figure 2 shows the parent neutrino energy distribution for the three event topologies. The requirement of a reconstructed track selects events having a muon.
The tracks come from interactions in the rock below MACRO. The muon crosses the whole detector ( GeV). The time information provided by scintillator counters permits one to know the flight direction (time-of-flight method). Almost 50% of the tracks intercept 3 scintillator counters. The average neutrino energy for this kind of events is around 100 GeV. The data have been collected in three periods, with different detector configurations. In the first two periods (March 1989 - November 1991, December 1992 - June 1993) only the lower parts of MACRO were working. In the last period (April 1994 - November 1997) also the upper part of MACRO was in acquisition.
The events come from interactions inside the apparatus. Since two scintillator layers are intercepted, the time-of-flight method is applied to identify the upward going events. The average neutrino energy for this kind of events is around 4 GeV. If the atmospheric neutrino anomalies are the results of oscillations with maximum mixing and between and eV2 it is expected a reduction in the flux of this kind of events of about a factor of two, without any distortion in the shape of the angular distribution. Only the data collected with the full MACRO (live-time around 3 years) have been used in this analysis.
The and the events are due to external interactions with upward-going tracks stopping in the detector ( ) and to neutrino induced downgoing tracks with vertex in lower part of MACRO ( ). These events are identified by means of topological criteria. The lack of time information prevents distinguishing the two sub samples. The data set used for this analysis is the same used for the search. An almost equal number of and is expected if neutrinos do not oscillate. The average neutrino energy for this kind of events is around 4 GeV. In case of oscillations we expect a reduction in the flux of the events similar to the one expected for the events, while we do not expect any reduction of the events (having path lengths of the order of 20 km).
3 Upward throughgoing muons ( )
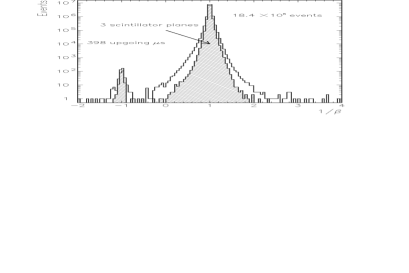
The direction that muons travel through MACRO is determined by the time-of-flight between two different layers of scintillator counters. The measured muon velocity is calculated with the convention that muons going down through the detector are expected to have 1/ near +1 while muons going up through the detector are expected to have 1/ near -1.
Several cuts are imposed to remove backgrounds caused by radioactivity in near coincidence with muons and showering events which may result in bad time reconstruction. The most important cut requires that the position of a muon hit in each scintillator as determined from the timing within the scintillator counter agrees within 70 cm with the position indicated by the streamer tube track.
When a muon hits 3 scintillator layers, there is redundancy in the time measurement and 1/ is calculated from a linear fit of the times as a function of the pathlength. Tracks with a poor fit are rejected. Other minor cuts are applied for the tracks with only two layers of scintillator hit.
It has been observed that downgoing muons which pass near or through MACRO may produce low-energy, upgoing particles. These could appear to be neutrino-induced upward throughgoing muons if the down-going muon misses the detector [4]. In order to reduce this background, we impose a cut requiring that each upgoing muon must cross at least 200 g/cm2 of material in the bottom half of the detector. Finally, a large number of nearly horizontal (), but upgoing muons have been observed coming from azimuth angles (in local coordinates) from -30∘ to 120∘. This direction contains a cliff in the mountain where the overburden is insufficient to remove nearly horizontal, downgoing muons which have scattered in the mountain and appear as upgoing. We exclude this region from both our observation and Monte-Carlo calculation of the upgoing events.
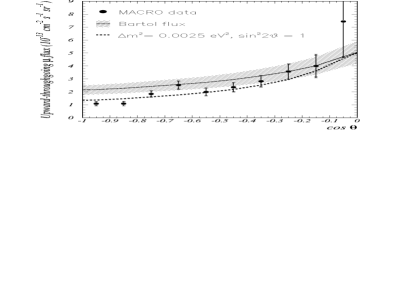
Figure 3 shows the distribution for the up-throughgoing data from the full detector running. A clear peak of upgoing muons is evident centered on . There are 398 events in the range which we define as upgoing muons for this data set. We combine these data with the previously published data [2] (with 4 additional events due to an updated analysis) for a total of 479 upgoing events. Based on events outside the upgoing muon peak, we estimate there are background events in the total data set. In addition to these events, we estimate that there are events which result from upgoing charged particles produced by downgoing muons in the rock near MACRO. Finally, it is estimated that events are the result of interactions of neutrinos in the very bottom layer of MACRO scintillators. Hence, removing the backgrounds, the observed number of upgoing throughgoing muons integrated over all zenith angles is 451.
In the upgoing muon simulation we have used the neutrino flux computed by the Bartol group [6]. The cross-sections for the neutrino interactions have been calculated using the Morfin and Tung parton distributions set S1 [7]. These parton distributions were chosen based on the good agreement of the resulting compared to the world average at GeV. The propagation of muons to the detector has been done using the energy loss calculation by Lohmann et al. [9] for standard rock. The total systematic uncertainty on the expected flux of muons adding the errors from neutrino flux, cross-section and muon propagation in quadrature is . This theoretical error in the prediction is mainly a scale error that doesn’t change the shape of the angular distribution. The number of events expected integrated over all zenith angles is 612, giving a ratio of the observed number of events to the expectation of 0.74 (stat) (systematic) (theoretical).
Figure 4 shows the zenith angle distribution of the measured flux of upgoing muons with energy greater than 1 GeV for all MACRO data compared to the Monte Carlo expectation for no oscillations and with a oscillated flux with and eV2 (dashed line).
The shape of the angular distribution has been tested with the hypothesis of no oscillation excluding the last bin near the horizontal and normalizing data and predictions. The is , for 8 degrees of freedom (probability of 0.1% for a shape at least this different from the expectation). We have considered also oscillations . The best in the physical region of the oscillations parameters is 15.8 for around and maximum mixing (the best is outside the physical region for mixing ).
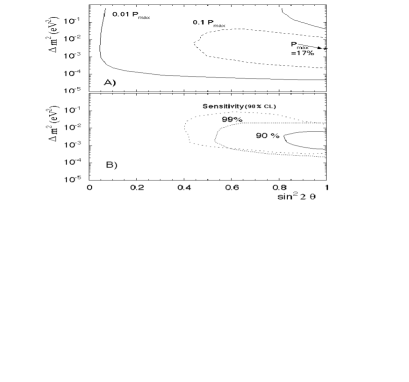
To test oscillation hypothesis, we calculate the independent probability for obtaining the number of events observed and the angular distribution for various oscillation parameters. It is notable that the value of suggested from the shape of the angular distribution is similar to the value necessary in order to obtain the observed reduction in the total number of events in the hypothesis of maximum mixing. Figure 5 A) shows probability contours for oscillation parameters using the combination of probability for the number of events and of the angular distribution. The maximum of the probability is 17%. The probability for no oscillation is 0.1%. Figure 5 B) shows the confidence regions at the 90% and 99% confidence levels based on application of the Monte Carlo prescription of reference [5]. We plot also the sensitivity of the experiment. The sensitivity is the 90% contour which would result from the preceding prescription if the data and Monte Carlo happened to be in perfect agreement at the best-fit point. The allowed regions are smaller than the one you could expect form the sensitivity of the experiment. This is because the best probabil ity is outside the physical region.
The same procedure applied for sterile neutrino [10] gives 2% as maximum probability.
| Events detected | Predictions (Bartol neutrino flux) | ||
|---|---|---|---|
| No Oscillations | With oscillations | ||
| + | 120 | ||
4 The Low Energy Events
The analysis of the events is similar to the analysis of the . The main difference is due to the requirement that the interaction vertex should be inside the apparatus. About 87% of events are estimated to be interactions. The preliminary uncertainty due to the acceptance and analysis cuts is 10%. After the background subtraction (3 events) 85 events are classified as events
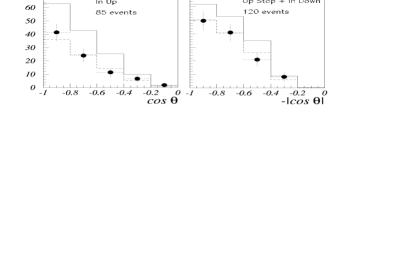
The and the events are identified via topological constraints. The main requirement is the presence of a reconstructed track crossing the bottom scintillator layer. All the track hits must be at least 1 m from the detector’s edges. The criteria used to verify that the event vertex (or stop point) is inside the detector are similar to those used for the search. To reject ambiguous and/or wrongly tracked events which survived automated analysis cuts, real and simulated events were randomly merged and directly scanned with the MACRO Event Display. Three different events subsamples are considered according to the minimum number of streamer tube hits. We present here the sample with at least 3 streamer hits (corresponding roughly to 100 ). About 90% of the events are estimated to be CC interactions. The main background for this search are the low energy particles produced by donwn-going muons [4]. After background subtraction (5 events) 120 events are classified as and events.
The Montecarlo simulation for the low energy events uses the Bartol neutrino flux [6] and the neutrino low energy cross sections reported in [8]. The simulation is performed in a large volume of rock (170 kton) around the MACRO detector (5.3 kton). The uncertainty on the expected muon flux is about 25%. The total number of events and the angular distributions are compared with the predictions in Table 1 and in Figure 6. The low energy samples show an uniform deficit of the measured number of events over the whole angular distribution with respect to the predictions, while there is a good agreement with the predictions based on neutrino oscillations.
5 Conclusions
The upgoing throughgoing muon data set is in favor of oscillation with parameters similar to the those observed by Superkamiokande with a probability of 17% against the 0.1% for the no oscillation hypothesis. However the shape of the zenith distribution gives a maximum probability of only 4.6%. This could be due to a statistical fluctuation or to some hidden physics. We exclude effects due to the detector.
This oscillation hypothesis is also consistent with the MACRO low energy data. A combined statistical analysis of the three data samples will be performed in the future when more statistics will be available.
References
- [1] Y. Fukuda et al. (SuperKamiokande collaboration): 1998, hep-ex/9807003 and T.Kajita in these proceedings. K. S. Hirata et al. (Kamiokande collaboration) Phys. Lett. B280 (1992) 146 and Y. Fukuda et al. Phys. Lett. B335 (1994) 237. R. Becker-Szendy et al (IMB collaboration): Phys. Rev.Lett. 66 (1991) 2561. W.W.M. Allison et al (Soudan 2 Collaboration): Phys. Lett. B391,(1997) 491 and E. Peterson in these proceedings
- [2] S. Ahlen et al. (MACRO collabor.), Phys. Lett. B 357 (1995) 481.
- [3] M. Ambrosio et al.(MACRO collabor.) hep-ex/9807005 to be published on Phys Lett. B.
- [4] M. Ambrosio., et al. (MACRO collabor.) Astroparticle Physics 9 (1998) 105.
- [5] G. Feldman and R. Cousins, Phys. Rev. D57 (1998) 3873.
- [6] V. Agrawal, T.K. Gaisser, P. Lipari and T. Stanev, Phys. Rev. D53 (1996) 1314.
- [7] J. G. Morfin and W. K. Tung , Z. Phys. C52 (1991) 13.
- [8] P. Lipari, M. Lusignoli and F. Sartogo, Phys. Rev. Lett. 74 (1995) 4384.
- [9] W. Lohmann et al., CERN-EP/85-03 (1985).
- [10] Q.Y. Liu and A.Yu. Smirnov Nucl.Phys. B524 (1998) 505.