Performance of the Electromagnetic Calorimeter of the HERMES Experiment
Abstract
The performance of the electromagnetic calorimeter of the HERMES experiment is described. The calorimeter consists of 840 radiation resistant F101 lead-glass counters. The response to positrons up to 27.5 GeV, the comparison between the measured energy and the momentum reconstructed from tracking, long-term stability, hadron rejection and neutral meson invariant mass reconstruction are shown.
∗ Corresponding author: e-mail Alessandra.Fantoni@lnf.infn.it
1 Introduction
HERMES (HERA MEasurement of Spin) is an experiment which is comprehensively studying the spin structure of the nucleon by deep inelastic scattering (DIS) of polarised positrons from polarised protons and neutrons [1]. Both inclusive and semi-inclusive spin dependent scattering are simultaneously measured with good particle identification.
By measuring the longitudinal polarization asymmetry of the cross section, HERMES determines the nucleon spin structure functions in a wide range of and (0.02 0.8, 0.2 20), to more precisely test fundamental sum rules such as those of Bjørken and Ellis-Jaffe. A central aspect of the physics program is ‘flavor-tagging’ the struck quark via detection of the leading hadron in semi-inclusive channels, which enables HERMES to disentangle the spin contributions of different quark flavors and of gluons, in an effort to solve the nucleon spin puzzle [2].
The HERMES spectrometer [3] is installed in the East Hall of the HERA storage ring at DESY. It consists of two identical halves above and below the positron ring plane. This provides two independent measurements of spin observables and thus a cross check on systematic uncertainties. The spectrometer is configured around a large dipole magnet with a bending strength of 1.3 Tm and scattering angle acceptance 40 – 220 mrad, a tracking system with chambers before, in and behind the magnet, and a particle identification detector (PID) system. The PID system consists of four detectors: a lead-glass calorimeter, two plastic scintillator hodoscopes, a transition radiation detector, and a threshold Čerenkov detector. The hodoscope immediately in front of the calorimeter is preceded by two radiation lengths of lead and acts as a pre-shower detector. A more detailed description of the spectrometer and of its performances is given in Refs. [3, 4].
The HERMES spectrometer has been in operation for about three years, for measurements on polarised and unpolarised targets of 1H, 2H, 3He and N. This paper reports on the performance of the HERMES calorimeter during this running period.
2 Description of the calorimeter
2.1 Detector assembly
The electromagnetic calorimeter is one of the four detectors of the HERMES PID system. Its function is: i) to provide a first-level trigger for scattered positrons, based on energy deposition in a localized spatial region; ii) to separate positrons from pions with a rejection factor of more than 10 at the first-level trigger and an additional factor of more than 100 in event reconstruction analysis; iii) to provide a measurement of the energy of DIS positrons; iv) to measure the energy of photons from radiative processes or from and decays and v) to give a coarse position measurement of scattered electrons and photons.
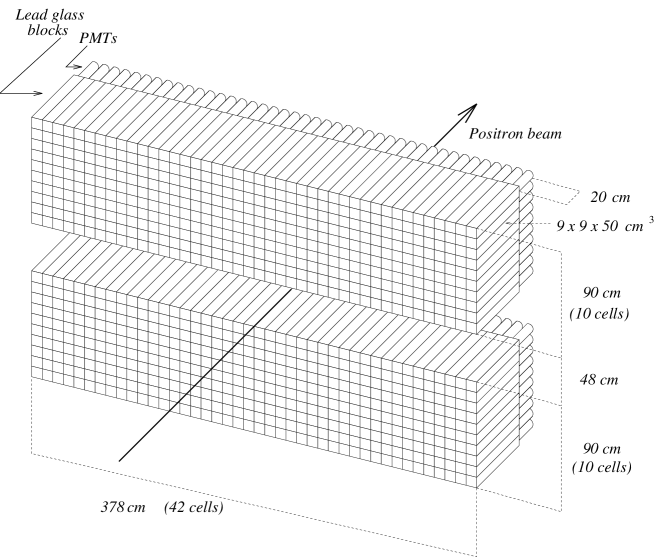
The solution chosen to meet these requirements consists of 840 radiation resistant F101 lead-glass (LG) blocks [5] arranged in a configuration with one wall above and one below the beam, and with photomultipliers (PMTs) viewing from the rear, as shown in Fig. 1. Each wall is composed of 420 identical lead-glass blocks, stacked in a 4210 array. Each block has an area 99 cm2 and a length of 50 cm (about 18 radiation lengths). This cell size meets the requirement that 90 of the shower is contained in the cell for an axially-incident positron. The blocks were polished, wrapped with 50 m thick aluminized mylar foil and covered with a 125 m thick tedlar foil to provide light isolation. Each block is coupled to a 7.5 cm photomultiplier Philips XP3461 with a silicone glue (SILGARD 184) with refraction index 1.41. A -metal magnetic shield of 1.5 mm thickness surrounds the PMT. The light seal is provided by an aluminium enclosure, which is mounted on a flange that is glued to the surface of the lead-glass. This flange is made of titanium to match the thermal expansion coefficient of F101. It carries the light fiber for monitoring of the counter response.
2.2 Equalisation of the counters
Before the installation in the HERA East Hall, all lead-glass counters were equalised at DESY with a 3 GeV electron beam. An array of forty-two blocks at a time was placed on a platform that could be moved in both the horizontal and vertical directions to vary the impact point of the beam on the counters. The response equalisation procedure consisted in adjusting the PMT high voltages so that the mean charge measured by the ADC was (pC) = 22.22 (GeV), where is the mean energy deposition in the cell.
Figs. 2 and 2 show the distributions of the means and variances (in ADC values) of the spectra of the 840 blocks in response to a 3 GeV electron beam incident at the center of the block. The mean ADC channels M of all F101 counters were adjusted to be between 580 and 620. The resulting distribution of the means has a average value 601 and width () 6. This means an overall equalisation within 1%. The standard deviations of the responses of the 840 lead-glass blocks are distributed around a central value 62 with =3: this implies a uniformity of the single-block resolutions to within 5%.


2.3 Energy calibration
The block size was chosen in order to provide containment in a 3x3 matrix of more than 99 of electromagnetic showers up to 30 GeV energy. Hence shower leakage has negligible influence on the energy resolution. On the other hand, the length of the lead-glass module does not lead to excessive absorption of Čerenkov light.
Measurements with 1–30 GeV electron beams have been performed at CERN and DESY with a 3x3 array of counters: all data, apart from that at 1 GeV, are reproduced to better than 1 by a linear fit [7].
In the off-line analysis of HERMES data, the comparison of the energy to the independently measured momentum determined by tracking [8] provides a good identification of scattered positrons over the whole energy range which constitutes a powerful tool for calibration. In fact, after correction for radiative effects in front of the calorimeter, the ratio is expected to be close to unity, independently of the positron energy. Fig. 3 shows the calorimeter response for scattered positrons in comparison to the reconstructed momentum. Good linearity is observed over the full energy range.
During the data taking period (1995-1997) the distribution for scattered positrons was regularly observed for each individual counter. Fig. 4 shows a distribution of the means of such spectra, measured over about a one-year running period. The ratio is distributed around the central value 1.00 with a width () 0.01, demonstrating a uniformity of response of the counters around .


3 Calorimeter performance
3.1 Energy resolution
Electromagnetic showers typically spread their energy over the eight modules surrounding the hit counter. Such a group of nine modules is called in the following a cluster. While the energy distribution over the single blocks of the cluster strongly depends on the hit position relative to the module boundaries and on the angle of incidence, the cluster energy is found to be independent of them to better than 1% [7].
The energy resolution for scattered positrons obtained during normal operation is shown in Fig. 5. The data are well described by the following parameterization:
which is slightly degraded compared to the test beam results () [7]. This because of pre-showering of the positrons in the material before the calorimeter, which improves the discrimination between positrons and hadrons, but produces the term, and of imperfections in the gain matching among modules, which slightly enhances the constant term. Note that these values are similar to those obtained for other large lead-glass calorimeters [9-15] in spite of the use here of a less transparent material.

3.2 Position resolution
The segmentation of the calorimeter allows to obtain the hit position from the energy distribution inside a cluster with an accuracy better than the cell size. The hit position is calculated by using the following energy-weighted average position of the nine blocks of a cluster:
and
where and are the central horizontal and vertical coordinates of the -module and is the corresponding measured amplitude. Fig. 6 shows the distribution of the differences between the estimated hit positions of scattered positrons in the calorimeter , and the extrapolations of the charged particle tracks, [16]. It is seen that the resolution of the reconstructed hit position amounts to:
and is significantly better than the cell size. These resolutions, which are the same for the and directions, were found to be almost independent of the energy of the incident positron.

3.3 Trigger
The energy of the electromagnetic shower measured as the sum of two adjacent calorimeter columns is used to provide the first-level trigger for positrons in a deep inelastic process. During the 1995 data taking period the trigger consisted of a coincidence of both hodoscopes and the calorimeter. The trigger threshold was set to a deposited energy of 3.5 GeV in 1995 and of 1.5 GeV in late 1996 and 1997. This already provided a suppression of hadronic background of about one order of magnitude. A forward trigger scintillator system was introduced in 1996 in front of the HERMES spectrometer magnet. It reduced the trigger rate from background generated by the HERA proton beam by distinguishing forward and backward going particles by using the time of flight between forward and rear scintillators.
4 Long-term stability
4.1 Gain Monitoring System
A gain monitoring system (GMS) is used to monitor the possible gain variations of the photomultipliers during normal running. The system is based on a dye laser light source at 500 nm, which sends light pulses of varied intensities through glass fibers to every PMT of the calorimeter, and additionally to a reference counter photodiode. The different intensities are achieved by a rotating wheel with several attenuation plates. The light is split in several stages and fed into glass fibers [3]. The ratios of multiplier signals to that of the reference photodiode can be used to monitor relative gain changes in the multipliers.
The long-term stability of the calorimeter has been evaluated by observing changes of the pedestal and gain value. These values have been found to be stable within the accuracy of the measurement during the entire time of operation. Fig. 8 shows the values of pedestals observed over a several months running period for two typical modules. From the known conversion gain of 5 MeV/ch, it can be seen that the data are consistent to about 10 MeV.
Fig. 8 shows the relative gain variations of two typical counters as a function of accumulated events for several months running period. The values are the ratios between the actual and reference gains. Straight line fits to the data result in slopes of 1.210-3 year-1 and 1.110-2 year-1, confirming the above stated long-term stability of the response to within 1% per year.


The long-term stability of the response can also be monitored by observing the mean value of the distribution, measured for each run. Fig. 9 shows the distribution of the averages over all blocks of their centroids, accumulated over a one year running period. It is seen that the response was stable within 0.5 (corresponding to the of the distribution).

4.2 Radiation damage
Degradation of the optical properties of the lead-glass by radiation is a danger in the HERA environment. The choice of F101 material was motivated by its radiation hardness. In fact, previous measurements on a 45 cm long block with rays [5] and high-energy hadrons [17] have shown that an accumulated dose of more than 102 Gy produces a degradation of F101 transmittance less than over the lead-glass length. After irradiation by 104 Gy the F101 turned visibly rust-brown with a tint of red and did not recover. Thus F101 is expected to be 10–50 times less sensitive to radiation damage than other types of lead-glass, like SF2 [18], depending on wavelength. This is due to the addition of Cerium, which has the disadvantage that it worsens the optical transmission characteristics.
To prevent radiation damage of the lead-glass, both calorimeter walls are vertically displaced away from the beam pipe by 50 cm during beam injection. Therefore, to monitor the potential radiation damage, particular attention was devoted to those blocks positioned at lower scattering angles, which should suffer a stronger gain reduction due to their proximity to the beam. Fig. 10 shows the distributions of the relative gains for a few of these blocks measured during one year of operation. The central values are at 1.003 and 0.9999 for the top and bottom walls, respectively, with a 1. This result is also confirmed by the long-term stability of the response to the GMS pulses shown in Fig. 8.
In conclusion, over three years of operations, there has been no observed degradation of performance that could suggest ageing effects.

Radiation damage to the lead-glass is also monitored by using dedicated TF1 blocks placed behind the calorimeter. This material is about 20 times more sensitive to radiation damage than F101 [5]. Therefore, gain reduction would be seen sooner in these monitor detectors if there had been a large radiation dose incident on the back of the calorimeter caused by showers produced by beam loss in the HERA proton storage ring. Within the reproducibility of the measurements (1%), no variation has yet been observed in their response, indicating that the effect of radiation damage is negligible.
5 Hadron rejection
The HERMES PID system has been designed to provide at least an order of magnitude in hadron suppression at the trigger level to keep data acquisition rates reasonable, and to provide a hadron rejection factor (HRF) of 104 to keep the contamination of the positron sample by hadrons below 1% over the entire kinematic range. The HRF is defined as the ratio of the total number of incident hadrons to the number of hadrons that are misidentified as electrons.
The calorimeter and the hodoscopes are used to select DIS events. This selection is more critical near the energy threshold where the ratio between the fluxes of pions and positrons is high. It is accomplished with a passive radiator composed of 2 radiation lengths of lead sandwiched between two 1.3 mm stainless steel sheets and installed immediately before the second hodoscope. This passive radiator acts like a preshower and initiates electromagnetic showers that deposit significantly more energy in the scintillator than minimum ionizing particles.
Measurements with test beams [7] have shown that such a configuration yields a hadron rejection factor of 5103 in an event reconstruction analysis combining a lead-glass cut retaining 95% electron efficiency with a preshower cut keeping 98%. Specifically, the pion rejection provided by a single lead-glass block is about 100 and this is improved by the preshower by a factor of about 40.
During data acquisition the hadron contamination at the trigger level was suppressed by the calorimeter threshold by a factor 10–100, depending on positron energy and threshold setting.
In Fig. 11 are shown the additional HRF and the efficiency for the combined calorimeter+preshower system obtainable in off-line analysis: the HRF (efficiency) values increase from 50 (0.94) at 4.5 GeV up to 160 (0.98) at 13.5 GeV. It’s worth noticing that in the event reconstruction the responses of the four PID detectors (electromagnetic calorimeter, pre-shower, Čerenkov counter, and transition radiator detector (TRD) [19]) are combined to further improve the hadron rejection to the required value. More detailed studies on the particle identification system can be found in Ref. [20].

6 Invariant mass reconstruction
HERMES provides detailed information on the hadronic final states in semi-inclusive deep inelastic scattering measurements. This yields information on various flavor contributions to the nucleon spin.
The calorimeter plays an essential role in the identification of and , because they mainly decay into two photons (branching ratios: (98.800.03) % and (39.20.3) % respectively [21]), which are identified as pairs of energetic clusters in the calorimeter with no corresponding charged tracks in the spectrometer. From the energy measurement of the two photons and the opening angle between them, it is possible to reconstruct the invariant mass of the corresponding meson. Fig. 12 shows an invariant mass distribution for events with two neutral clusters in the calorimeter in coincidence with a scattered positron. Both the and peaks are clearly visible. Fig. 12 and Fig. 12 show the and invariant masses distributions obtained after applying kinematical cuts and background subtraction. The centroids of the peaks are =0.135 GeV with =0.011 GeV, and =0.549 GeV with =0.030 GeV, which are in good agreement with the Particle Data Group values [21].
The resolution of the estimate for the meson invariant mass can be expressed as follows:
where is the opening angle between the two photons. Using this equation we can examine whether the energy and position resolutions derived from calibration data still apply in the experimental environment. Fig. 13 displays the invariant mass resolution obtained from DIS events, and a Monte Carlo calculation based on the measured energy and position resolutions given in section 3. There is good agreement between the measured and calculated values. At low energies the energy resolution dominates the invariant mass resolution, while at high energies the angular resolution is more important. The decrease of slope for energies 9 GeV is due to a cut on minimum inter-cluster distance related to the cell size.


7 Conclusions
The electromagnetic calorimeter is an important component of the HERMES spectrometer. It provides the DIS trigger of the experiment in conjunction with scintillator hodoscopes and plays a major role in the particle identification. In addition, it is essential for the identification of neutral particles in semi-inclusive measurements. The performance and the stability of the calorimeter response were continuously measured during the past three years of data taking and the data are in good agreement with the design values and expectations. They can be summarized as follows:
-
•
uniformity of the response of all counters within 1;
-
•
linearity of the response to positrons within 1 over the energy range 1–30 GeV;
-
•
resolution
for a 3x3 array of counters and
for the whole calorimeter operating in the spectrometer, including the effect of pre-showering of the positrons in the material before the calorimeter;
-
•
position reconstruction with resolution about 0.7 cm;
-
•
stability in time of the response within 1;
-
•
no observed degradation of performance due to radiation damage, within the accuracy of the measurements;
-
•
a hadron rejection factor exceeding 10 at the trigger level, and a further off-line rejection factor of about 100;
-
•
reconstruction of and masses in agreement with the PDG values.
Acknowledgements
We gratefully acknowledge the Frascati HERMES technical staff M. Albicocco, A. Orlandi, W. Pesci, G. Serafini and A. Viticchié for the continuous and effective assistance. We are also grateful to C. A. Miller for many stimulating discussions. This work was in part supported by the INTAS (contract number 93-1827) and the TMR research network (contract number FMRX-CT96-0008) contributions from the European Community.
References
-
[1]
HERMES Collaboration, Proposal DESY-PRC 90/01 (1990);
K. Ackerstaff et al., Phys. Lett. B404 (1997) 383. - [2] V. Hughes and C. Cavata, Symposium on the internal spin structure of the nucleon - Yale University 1994, World Scientific (1995).
- [3] K. Ackerstaff et al., DESY-HERMES 97-09 (1997), Nucl. Instr. and Meth. submitted; HERMES Collaboration, Technical Design Report, DESY-PRC 93/06 (1993).
- [4] M. Düren, habilitation thesis, DESY-HERMES 95-02 (1995).
- [5] M. Kobayashi et al., KEK internal report 93-178 (1993).
- [6] A. Fantoni, Ph.D. thesis, February 1996, Università degli Studi della Calabria, HERMES internal note 96-015.
- [7] H. Avakian et al., Nucl. Instr. and Meth. A378 (1996) 155.
- [8] W. Wander, Ph.D. thesis, April 1996, Friedrich Alexander University (Erlangen-Nuernberg), HERMES internal note 96-023.
- [9] K. Ogawa et al., Nucl. Instr. and Meth. A243 (1986) 58.
- [10] T. Sumiyoshi et al., Nucl. Instr. and Meth. A271 (1988) 432.
- [11] H. Stroher et al., Nucl. Instr. and Meth. A269 (1988) 568.
- [12] G.T. Bartha et al., Nucl. Instr. and Meth. A275 (1989) 59.
- [13] H. Baumeister et al., Nucl. Instr. and Meth. A292 (1990) 81.
- [14] L. Bartoszek et al., Nucl. Instr. and Meth. A301 (1991) 47.
- [15] W. Brückner et al., Nucl. Instr. and Meth. A313 (1992) 345.
- [16] A. Fantoni et al., Proceeding of CALOR96, Frascati June 1996, Frascati Physics Series, vol. VI, (1997) 659-668, A. Antonelli et al. Eds.
- [17] A.V. Inyakin et al., Nucl. Instr. and Meth. 215 (1983) 103.
- [18] M. Holder et al., Nucl. Instr. and Meth. 108 (1973) 541.
- [19] R. Kaiser, Ph.D. thesis, April 1997, Simon Fraser University, Burnaby, HERMES internal note 97-017.
- [20] R. Kaiser, HERMES internal note 97-025.
- [21] Particle Data Group, Review of Particle Physics, Phys. Rev. D54 (1996).