Atmospheric neutrino results from Super-Kamiokande and Kamiokande
Evidence for oscillations
Abstract
New atmospheric neutrino results from Super-Kamiokande are presented. Results from Kamiokande on upward going muons are also presented. All these data, together with the Kamiokande atmospheric neutrino data give evidence for neutrino oscillations. Two flavor oscillations, with large sin and m2 in the region of 10-3 to 10eV2, explain all these data.
1 Introduction
Cosmic ray interactions in the atmosphere produce neutrinos. The prediction of the absolute flux has an uncertainty of 20%. However, the flavor ratio of the atmospheric neutrino flux, , has been calculated to an accuracy of better than 5% in a broad energy range from 0.1 GeV to higher than 10 GeV. The calculated flux ratio has a value of about 2 for energies 1GeV and increases with increasing neutrino energy. For neutrino energies higher than a few GeV, the fluxes of upward and downward going neutrinos are expected to be nearly equal; the geomagnetic field effects on atmospheric neutrinos in this energy range are expected to be small because the primary cosmic rays that produce these neutrinos have rigidities exceeding the geomagnetic cutoff rigidity ().
The ratio has been measured in deep underground experiments by observing final-state leptons produced by charged-current interactions of neutrinos on nuclei, . The measurements are reported as , where and are the number of muon-like (-like) and electron-like (-like) events observed in the detector for both data and Monte Carlo (MC) simulation. This ratio largely cancels experimental and theoretical uncertainties, especially the uncertainty in the absolute flux. The observed values of by Kamiokande [1], [2] were significantly smaller than unity for both below and above 1 GeV energy ranges. Consistent results were obtained by IMB-3(1.5GeV) [3] and Soudan-2 [4].
Neutrino oscillations have been suggested to explain the small values of . For a two-neutrino oscillation hypothesis, the probability for a neutrino produced in a flavor state to be observed in a flavor state after traveling a distance through a vacuum is:
| (1) |
where is the neutrino energy, is the mixing angle between the flavor eigenstates and the mass eigenstates, and is the mass-squared difference of the neutrino mass eigenstates. For detectors near the surface of the Earth, the neutrino flight distance, and thus the oscillation probability, is a function of the zenith angle of the neutrino direction. Vertically downward-going neutrinos travel about 15 km while vertically upward-going neutrinos travel about 13,000 km before interacting in the detector. The broad energy spectrum from a few hundred MeV to about 100 GeV and this range of neutrino flight distances makes measurements of atmospheric neutrinos sensitive to neutrino oscillations with down to eV2.
The zenith angle dependence of measured by the Kamiokande experiment[2] at high energies, together with the small values, has been cited as evidence for neutrino oscillations. Based on these measurements, Kamiokande obtained the allowed parameter regions of neutrino oscillations. Because of the relatively small statistics, both and oscillations were allowed.
Recently, a long baseline reactor experiment, CHOOZ [5], excluded the solution of the atmospheric neutrino problem.
The upward-going muons observed in underground detectors are the products of neutrino interactions in the rock. The mean neutrino energy of these events are of the order of 100(10) GeV for through-going(stopping) events. These events are used for the independent check of the neutrino oscillation analysis of the lower energy atmospheric neutrino data.
We present the analyses of atmospheric neutrino events from Super-Kamiokande. In addition to the events whose vertex positions are in the fiducial volume of the detector, we present the upward-going muon results from Kamiokande and Super-Kamiokande. We observed small values of and a zenith angle dependent deficit of -like events. While no combination of known uncertainties in the experimental measurement or prediction of atmospheric neutrino fluxes is able to explain the data, a two-neutrino oscillation model of , where may be or a new, non-interacting “sterile” neutrino, is consistent with the observed values and zenith angle distributions. These data and the neutrino oscillation interpretation were further supported by a small (upward stopping muons)/(upward through-going muons) ratio and zenith-angle dependent deficit of upward through-going muon flux. From these measurements, we conclude that the atmospheric neutrino data give evidence for neutrino oscillations.
2 Super-Kamiokande detector
Super-Kamiokande is a cylindrical 50 kton water Cherenkov detector located at a depth of 2700 meters water equivalent in the Kamioka Observatory in Japan. The detector consists of an inner detector surrounded by an outer detector on all sides. The inner and outer detectors are optically separated by a pair of opaque sheets. 11146 50 cm photomultiplier tubes (PMTs), instrumented in all surfaces of the inner detector, detect Cherenkov photons radiated by relativistic charged particles. 1885 20 cm PMTs are instrumented in the outer detector. The outer detector is useful for identifying entering cosmic-ray muons and measuring exiting particles produced by neutrino interactions occurring in the inner detector. Pulse height and timing information from each PMT are recorded and used in the data analysis. The trigger threshold for electrons is 5.7 MeV/ at 50% efficiency.
For a description of the Kamiokande detector, see Ref.[6].
3 Fully and partially contained events
Super-Kamiokande observed a total of 4353 fully-contained (FC) events and 301 partially-contained (PC) events in a 33.0 kiloton-year exposure. FC events deposit all of their Cherenkov light in the inner detector while PC events have exiting tracks which deposit some Cherenkov light in the outer detector. For the present analyses, the neutrino interaction vertex was required to have been reconstructed within the 22.5 kiloton fiducial volume, defined to be m from the PMT wall. The number of FC+PC events observed so far in Super-Kamiokande was about 4 times larger than that in Kamiokande.
FC events were separated into those with a single visible Cherenkov ring and those with multiple Cherenkov rings. For the analysis of FC events, only single-ring events were used. Single-ring events were identified as -like or -like based on a likelihood analysis of light detected around the Cherenkov cone. The FC events were separated into “sub-GeV” ( MeV) and “multi-GeV” ( MeV) samples, where is defined to be the energy of an electron that would produce the observed amount of Cherenkov light. MeV corresponds to 1400 MeV for muons.
In a full-detector Monte Carlo simulation, 88% (96%) of the sub-GeV -like (-like) events were () charged-current (CC) interactions and 84% (99%) of the multi-GeV -like (-like) events were () CC interactions. PC events were estimated to be 98% CC interactions; hence, all PC events were classified as -like, and no single-ring and particle identification requirements were made. Table 1 summarizes the number of observed events for both data and Monte Carlo as well as the values for the sub-GeV and multi-GeV samples. Further details of the detector, data selection and event reconstruction used in this analysis are given in Ref.[7, 8].
| Data | Monte Carlo | ||
|---|---|---|---|
| sub-GeV | |||
| single-ring | 2389 | 2622.6 | |
| -like | 1231 | 1049.1 | |
| -like | 1158 | 1573.6 | |
| multi-ring | 911 | 980.7 | |
| total | 3300 | 3603.3 | |
| multi-GeV | |||
| FC events | |||
| single-ring | 520 | 531.7 | |
| -like | 290 | 236.0 | |
| -like | 230 | 295.7 | |
| multi-ring | 533 | 560.1 | |
| total | 1053 | 1091.8 | |
| PC events | |||
| total(=like) | 301 | 371.6 | |
Flavor ratio
measured significantly small values of in both the sub-GeV and multi-GeV samples. Several sources of systematic uncertainties in these measurements were considered[7, 8]. For the sub-GeV sample, they were: 5% from uncertainty in the predicted flux ratio, 3.5% from the CC neutrino interaction cross sections and nuclear effects in the H2O target, 3% from the neutral current cross sections, 2% from particle identification, 1% from the absolute energy calibration, 0.6% from the vertex fit and fiducial volume cut, less than 0.5% from non-neutrino background events and 1.5% from statistical uncertainty in the Monte Carlo. Adding these errors in quadrature, the total systematic uncertainty was 8%. The systematic uncertainty of for the multi-GeV sample, obtained in a similar way, was 12%. Table 1 summarizes the measured values in Super-Kamiokande. These results are consistent with the Kamiokande values, which were for the sub-GeV data and for the multi-GeV data[2].
The Super-Kamiokande data have been analyzed independently by two groups, making the possibility of significant biases in data selection or event reconstruction algorithms remote[7, 8]. Given the statistical error in especially for the sub-GeV sample, statistical fluctuation can no longer explain the deviation of from unity. Assuming that the systematic error has the gaussian form, we estimate the probability that the observed ratios could be due to statistical fluctuation is less than 0.001% and less than 1% for sub- and multi-GeV samples, respectively.
| Super-Kamiokande | Kamiokande | ||||
|---|---|---|---|---|---|
| MC | Data | Data | |||
| -like | |||||
| Sub-GeV, 400MeV/c | 1.000.040.03 | 1.20 | 1.29 | ||
| Sub-GeV, 400MeV/c | 1.020.040.03 | 1.10 | 0.76 | ||
| Multi-GeV | 1.010.060.03 | 0.93 | 1.38 | ||
| -like | |||||
| Sub-GeV, 400MeV/c | 1.050.030.02 | 1.03 | 1.18 | ||
| Sub-GeV, 400MeV/c | 1.000.030.02 | 0.65 | 1.09 | ||
| Multi-GeV (FC+PC) | 0.980.030.02 | 0.54 | 0.58 | ||

Zenith angle distribution
The -like data from Super-Kamiokande exhibit a strong up-down asymmetry in zenith angle () while no significant asymmetry is observed in the -like data, see Figure 1. For further analyses, we define up-down ratio where is the number of upward-going events () and is the number of downward-going events (). The ratio is expected to be near unity independent of flux model for GeV, above which effects due to the Earth’s magnetic field on cosmic rays are small. Based on a comparison of results from our Monte Carlo simulation using different flux models[10, 9] as inputs, treatment of geomagnetic effects results in an uncertainty of roughly in the expected values for -like and -like sub-GeV events and less than for multi-GeV events. These two flux calculations do not assume the existence of 1 km mountain over the Super-Kamiokande detector. The rock reduces the neutrino flux because muons are stopped before they can decay in flight. We estimated the effect of the presence of rock on the flux. changed about 2% for the multi-GeV events. The change was much smaller for the sub-GeV events.
Studies of decay electrons from stopping muons show at most a gain difference, i.e., measured energy difference, between up-going and down-going particles. This gain difference caused 0.9%, and 0.7% uncertainty in for the multi-GeV -like and -like events. This uncertainty is much smaller for the sub-GeV sample. A contamination of non-neutrino background such as down-going cosmic ray muons could have directional correlation. The maximum contribution to the uncertainty in from the contamination was estimated to be 1.0%, 0.1%, 0.5% and 2.0% for the sub-GeV -like, -like, multi-GeV -like and -like events, respectively. From these studies, the total systematic uncertainties in for the data and MC are summarized in Table 2. In the present data, for -like events is consistent with expectations. for high momentum -like events significantly deviates from unity, while for low momentum -like events is consistent with unity. The average angle between the final state lepton direction and the incoming neutrino direction is at MeV/ and at 1.5 GeV/. At the momentum range below 400 MeV/, the possible up-down asymmetry of the neutrino flux is largely washed out. We have found no detector bias differentiating -like and -like events that could explain an asymmetry in -like events but not in -like events [8].
The value for the multi-GeV FC+PC -like events, deviates from unity by more than 6 standard deviations. This value is also consistent with the Kamiokande value for the multi-GeV FC+PC -like events, . These numbers, which are close to 0.5, suggest a near maximal neutrino mixing.
Neutrino oscillation analysis
We have examined the hypotheses of two-flavor and oscillation models using a comparison of the Super-Kamiokande data and Monte Carlo, allowing all important Monte Carlo parameters to vary weighted by their expected uncertainties[11]. The data were binned by particle type, momentum, and . A is defined as:
| (2) | |||||
where the sum is over five bins equally spaced in and seven momentum bins for both -like events and -like plus PC events (70 bins total). The statistical error, , accounts for both data statistics and the weighted Monte Carlo statistics. is the measured number of events in each bin. is the expected number of Monte Carlo events and is a function of , and . are parameters which are related to the systematic uncertainties. The parameters (and their uncertainties) considered in this analysis are: overall normalization (25%, but this was fitted as a free parameter), spectral index (0.05), sub-GeV (8%), multi-GeV (12%), relative normalization of PC to FC (8%), (15%), sub-GeV (2.4%) and multi-GeV (2.7%) up-down ratios. See Ref.[11] for more details.
For , effects of matter on neutrino propagation through the Earth were included following Ref. [12]. Due to the small number of events expected from -production (15 to 20 events were expected in the present FC+PC sample), the effects of appearance and decay were neglected in simulations of . A global scan was made on a grid minimizing with respect to uncertainty parameters, , at each point.
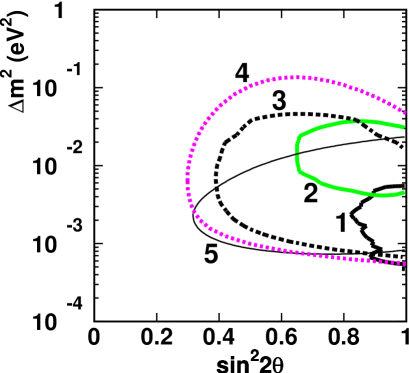
The best-fit to oscillations, , was obtained at eV2) inside the physical region (). The best-fit values of the Monte Carlo uncertainty parameters were all within their expected errors for this point. The global minimum occurred slightly outside the physical region at eV. The 90% C.L. allowed region is located at based on the minimum inside the physical region[13]. The allowed region is shown in Figure 6. In the region near minimum, the distribution is rather flat and has many local minima so that inside the 90% interval the best-fit is not well constrained. The increases rapidly outside of the 90% C.L. region. We obtained , when calculated at , (i.e. assuming no oscillations).
The Kamiokande allowed region[2] obtained by the contained event analysis is also shown in Figure 6. The Super-Kamiokande allowed region favors lower than that of Kamiokande. However, the allowed regions from both experiments have a region of overlap. One of the reasons for the difference in the allowed region is due to the zenith angle distribution of the sub-GeV -like events. The values of the -like events from Kamiokande and Super-Kamiokande are summarized in Table 2. It should be noted that Kamiokande value was consistent with unity for -like events in the momentum range of sub-GeV, 400MeV/c but Super-Kamiokande observed smaller value for the same sample; a 2.5 difference in for this sub-sample. This difference results in a difference in the favored region in these two experiments, since the energy region observing the small is directly related to the determination of ,
For the test of oscillations, the Super-Kamiokande data resulted in a relatively poor fit; , at eV. The expected value of the multi-GeV -like events for the best-fit oscillation hypothesis, 1.52, differs from the measured value, , by 3.4 standard deviations. We conclude that the hypothesis is not favored.
The zenith angle distributions for the sub- and multi-GeV samples are shown in Figure 1. The data are compared to the Monte Carlo expectation (no oscillations, hatched region) and the best-fit expectation for oscillations (dashed line). The oscillated Monte Carlo well reproduces the zenith angle distributions of the data.
In Super-Kamiokande, the oscillation parameters were also estimated by considering the measurement and the zenith angle shape separately. The 90% C.L. allowed regions for each case overlapped at eV2 for .

As another check of the Super-Kamiokande data, we studied events. For oscillations, the number of neutral-current (NC) events should be unchanged by neutrino oscillations. As a NC sample, we selected “”-like events. The selection criteria were: 2 ring events, both rings should be -like, no -decay signal and the invariant mass calculated from the charge and direction of the two rings assuming two ’s should be between 90 and 190MeV/. We observed 210 -like events. See Figure 2, which shows the invariant mass distribution for the two ring events. A clear excess at 140MeV/ is seen. The fraction of NC events in this sample is estimated to be 82%. For oscillations, the number of CC events (-like events) should also be unchanged by neutrino oscillations. Therefore, the () ratio of the data should agree with the same ratio of the Monte Carlo without oscillations for the case. We obtained: . The result is consistent with the interpretation of the data.
4 Upward going muons
Energetic atmospheric ’s passing the Earth interact with rock surrounding the detector and produce muons via CC interactions. Because of the atmospheric muon background, it is difficult to select neutrino induced downward going muons. On the contrary, upward going muons are essentially neutrino origin.
Upward going muons can be categorized into two types. One is “upward through-going muons” which are the events which enter into the detector and exit, and the other is “upward stopping muons” which enter the detector and stop in the detector.
Upward through-going muons
The mean energy of neutrinos which produce upward through-going muons is about 100GeV. Kamiokande observed 372 upward going muons during 2456 detector live days. The selection criteria were; cos and the minimum track length in the inner detector of 7 meters[14]. The minimum (mean) energy loss of these muons in the inner detector is 1.6(3.0)GeV. The average detection efficiency was 97%. With the requirement, cos, the background contamination was negligible. The observed flux of upward going muons was 1.94. The expected flux based on the calculated flux of Ref.[10] was 2.46. Figure 3 shows the zenith angle distribution of the upward through-going muon flux observed in Kamiokande.

In Super-Kamiokande, 617 upward through-going muon events were observed during 537 detector live days[15]. The selection criteria were; cos0, two outer detector cluster corresponding to the muon entrance and exit points and track length of a muon inside the inner detector should be longer than 7 m. The minimum (mean) energy loss of these muons in the inner detector is 1.6 (6) GeV. The average detection efficiency of these events was estimated to be 99%. The validity of this efficiency was tested using the real down-going cosmic-ray muons by assuming the up-down symmetry of the detector.
The number of background events, 4.6, was estimated by extrapolating the zenith-angle distribution of cosmic ray muons with cos00.08. The background events are expected only in the cos bin and are subtracted in further analyses. The observed flux of upward going muons was 1.750.070.09. The expected flux based on the calculated flux of Ref.[9]([10]) was 1.88 (2.01). Figure 4 shows the zenith-angle distribution of the upward through-going muon flux observed in Super-Kamiokande.

Because of the difference in the mean track length of muons, the observed and predicted fluxes are different between the two experiments. However, the observed/predicted flux ratios are consistent between the two experiments within the measurement errors. The measured zenith-angle distributions in these two experiments have similar shape; both experiment observed lower flux near the vertical direction compared with the predicted flux distributions. The values of the comparison of the shape of the zenith angle distributions of the data and predictions are 21.3/9 DOF and 18.7/9 DOF for the Kamiokande and the Super-Kamiokande data, respectively.
Analyses of neutrino oscillations were carried out in these experiments. To test the oscillation hypothesis, a is defined as:
| (3) | |||||
where is the statistical and systematic error in the observed flux () and and are an absolute normalization factor of the expected flux() and its uncertainty, respectively. was taken to be 22% by adding the theoretical uncertainty and correlated experimental errors. The uncertainty in the absolute neutrino flux (20%) was the dominant source of . A minimum was calculated by changing for each (sin, ). Since the contained data prefer oscillations and since the CHOOS experiment[5] excluded the oscillation parameter region relevant to the atmospheric neutrino data, only oscillations were tested.
The Kamiokande data had at (sin eV2) with 1.00. The value was 12.8/8 DOF. for the Super-Kamiokande data occurred at (sin eV2) with 1.12. The value was 7.3/8 DOF. The allowed regions did not change significantly for two assumptions of the neutrino flux[9],[10], suggesting that the zenith angle and energy dependences of the neutrino flux at high energies are understood well. Figure 6 shows the allowed regions obtained from these upward going muon data. The allowed regions are larger than those of contained events. But they overlap the allowed regions obtained by the contained data.
Upward stopping muons
Because of the large detector dimension of Super-Kamiokande, a substantial fraction of upward going muons stop in the detector. The mean neutrino energy of the upward stopping muons is about 10GeV, which is substantially lower than that of upward through-going muons. Therefore, in some neutrino oscillation parameters, it is expected that an observed (stopping/through-going) flux ratio of upward going muons is different from the calculated ratio.
Super-Kamiokande observed 137 upward stopping muons during 537 detector live days[15]. The selection criteria were similar to those of upward through-going muons except for a requirement of one outer detector cluster corresponding to the entrance point. The detection efficiency was estimated to be 99%. The estimated number of cosmic-ray background events was 13.2. It was estimated that these background events were mostly in the cos bin. The background events were subtracted from this bin for further analyses. We then calculated the (stopping/through-going) flux ratio (). The observed value was 0.220.0230.014, while the predicted value was 0.390.05. The observed value was substantially smaller than the prediction. Figure 5 shows the zenith angle distribution of the (stopping/through-going) flux ratio. Also shown in the same figure are the predicted ratios with and without neutrino oscillations. Clearly, the predicted distribution with neutrino oscillations agrees well with the data within the systematic uncertainty (14%).

The 90% C.L. allowed region of the neutrino oscillations was estimated by a test:
| (4) | |||||
where is the experimental (mostly statistical) error in the observed ratio () and and are a uncertainty factor of the expected ratio () and its 1 error, respectively. was taken to be 14% by adding the theoretical uncertainty and correlated experimental systematic errors.
occurred at (sin eV2). The value was 1.3/3 DOF. Figure 6 shows the allowed region obtained from this analysis. Again, the allowed region is larger than those of contained events. But it overlaps the allowed regions obtained by the contained and upward through-going muon data.
5 Conclusions
Both the zenith angle distribution of -like events and the () values observed in Super-Kamiokande were significantly different from the predictions in the absence of neutrino oscillations. While uncertainties in the flux prediction, cross sections, and experimental biases are ruled out as explanations of the observations, the present data are in good agreement with two-flavor , or , oscillations. This conclusion is consistent with the results from Kamiokande on contained data analysis and supported by the upward-going muon results from Super-Kamiokande and Kamiokande. Two experiments, Super-Kamiokande and Kamiokande, give consistent data and various techniques point to a common parameter region of neutrino oscillations: should be in the range around 10-3 10-2 eV2 and 0.8. We conclude that the atmospheric neutrino data, especially from Super-Kamiokande, give evidence for neutrino oscillations.
The Super-Kamiokande experiment is supported by the Japanese Ministry of Education, Science, Sports and Culture and the United Status Department of Energy. The Kamiokande experiment was supported by the Japanese Ministry of Education, Science, Sports and Culture.
References
- [1] K.S.Hirata et al., Phys. Lett. B205 (1988) 416; 280 (1992) 146.
- [2] Y.Fukuda et al., Phys. Lett. B 335 (1994) 237.
- [3] D.Casper et al., Phys. Rev. Lett. 66 (1991) 2561; R.Becker-Szendy et al., Phys. Rev. D 46 (1992) 3720.
- [4] W.W.M.Allison et al., Phys. Lett. B 391 (1997) 491; E.Peterson, for the Soudan-2 collaboration, in these Proceedings.
- [5] M.Apollonio et al., Phys. Lett. B 420 (1998) 397.
- [6] K.Nakamura et al., in “Physics and Astrophysics of Neutrinos”, Eds., M.Fukugita and A.Suzuki, Springer-Verlag (1994) p249.
- [7] Y.Fukuda, et al., Phys. Lett. B 433 (1998) 9.
- [8] Super-Kamiokande Collaboration, Y.Fukuda, et al., Phys. Lett. B (1998), accepted for publication, hep-ex/9805006
- [9] M.Honda et al., Phys. Lett. B248 (1990) 193; M.Honda et al., Phys. Rev. D52 (1995) 4985.
- [10] G.Barr et al., Phys. Rev. D39 (1989) 3532; V.Agrawal, et al., Phys. Rev. D53 (1996) 1313; T.K.Gaisser and T.Stanev, Proc. 24th Int. Cosmic Ray Conf. (Rome) Vol.1 (1995) p694.
- [11] Y.Fukuda, et al., Phys. Rev. Lett. 81 (1998) 1562.
- [12] L.Wolfenstein, Phys. Rev. D17 (1978) 2369; S.P.Mikheyev and A.Yu.Smirnov, Sov. J. Nucl. Phys. 42 (1985) 1441; S.P.Mikheyev and A.Yu.Smirnov, Nuovo Cim. C9 (1986)17.
- [13] Based on a two-dimensional extension of the method in Review of Particle Properties, Section: Error and confidence intervals Bounded physical region: R.M.Barnett et al., Phys. Rev. D54 (1996) 375.
- [14] S.Hatakeyama et al., Phys. Rev. Lett. 81 (1998) 2016.
- [15] The Super-Kamiokande collaboration, drafts in preparation.