A High Statistics Search for Oscillations
Abstract
We present new limits on and oscillations by searching for disappearance in the high-energy wide-band CCFR neutrino beam. Sensitivity to appearance comes from decay modes in which a large fraction of the energy deposited is electromagnetic. The beam is composed primarily of () but this analysis uses the % () component of the beam. Electron neutrino energies range from 30 to 600 GeV and flight lengths vary from 0.9 km to 1.4 km. This limit improves the sensitivity of existing limits for at high and obtains a lowest 90% confidence upper limit in of at .
pacs:
PACS numbers: 14.60.Pq, 13.15.+gNeutrino oscillations occur if neutrinos have non-zero mass and mixing. If recent evidence [1, 2] for neutrino oscillations is confirmed, it will radically alter our understanding of both particle physics and cosmology. Neutrino oscillations may also explain the observed deficit of neutrinos from the sun. In the two-generation mixing formalism, the oscillation probability is given by
| (1) |
where is the mass squared difference of the mass eigenstates in , is the mixing angle, is the incoming neutrino energy in GeV, and is the distance between the point of creation and detection in km.
While the high regions of parameter space for and oscillations have been excluded to very low mixing angles ( for and for ) the high parameter space is much less constrained as a result of the difficulty in producing high energy beams. The CCFR sample of over 20,000 charged-current interactions comprises the largest sample of high energy ’s to date. Previous high-statistics limits were obtained from reactor experiments [3, 4] with much lower beam energies. Accelerator limits were obtained by BEBC [5] and Fermilab E531 [6] which searched for appearance in emulsion.
We previously reported a limit on oscillations by searching for appearance [7] in the charged-current data sample. In this report we present new limits using the same data sample on and oscillations. Both limits use a disappearance test. The limit is also sensitive to appearance through decay modes in which a large fraction of the energy deposited is electromagnetic.
The CCFR detector [8, 9] consists of an 18 m long, 690 ton target calorimeter with a mean density of , followed by an iron toroidal spectrometer. The target consists of 168 steel plates, each , instrumented with liquid scintillator counters placed every two steel plates and drift chambers spaced every four plates. The separation between scintillation counters corresponds to 6 radiation lengths, and the ratio of electromagnetic to hadronic response of the calorimeter is . The toroid spectrometer is not directly used in this analysis which is based on the shower profiles in the target-calorimeter.
The Fermilab Tevatron Quadrupole Triplet neutrino beam is created by decays of pions and kaons produced when GeV protons hit a production target 1.4 km upstream of the neutrino detector. The resulting neutrino energy spectra for , , , and are shown in Figure 1. The % component of the beam used in this analysis is produced mainly from occuring in the 0.5 km decay region just downstream of the production target. The content of the beam is less than .

Neutrino interactions observed in the detector can be divided into three classes depending on the type of incoming neutrino and interaction:
-
1.
( charged-current (CC) events).
-
2.
( neutral- current (NC) events).
-
3.
( CC events).
The majority (97.7%) of events observed in the detector are produced by muon neutrino interactions. The CC events can be identified by the presence of a muon in the final state which penetrates beyond the end of the hadron shower, depositing energy characteristic of a minimum ionizing particle [8] in a large number of consecutive scintillation counters. Conversely, the electron produced in a CC event deposits energy in a few counters immediately downstream of the interaction vertex and is typically much shorter than the hadron shower. The separation of NC from the CC events is accomplished by using the difference in energy deposition pattern within the shower region; the CC events have a larger fraction of their energy deposited near the shower vertex.
In this analysis, the three most important experimental quantities calculated for each event are length, visible energy, and shower energy deposition profile. Event length is determined to be the number of scintillation counters spanned from the event vertex to the last counter with greater than a minimum-ionizing pulse height. The visible energy in the calorimeter, , is obtained by summing the energy deposited in scintillation counters from the interaction vertex to five counters beyond the end of the shower. The shower energy deposition profile is characterized by the ratio of the sum of the energy deposited in the first three scintillation counters to the total visible energy. Accordingly, we define
| (2) |
where is the energy deposited in the scintillation counter downstream of the interaction vertex.
The event length is determined by the end of the hadron shower for NC and CC events but is determined by the muon track for most CC events. To isolate events without a muon track we parameterize the event length as a function of energy for which 99% of hadron showers are contained as
| (3) |
Events which deposit energy over an interval less than counters are classified as “short”, otherwise they are “long”. The long event sample consists almost exclusively of class 1 events, while the short sample is a mixture of class 2, class 3, and class 1 events with a low energy muon.
Events were selected with at least 30 GeV deposited in the target calorimeter to ensure complete trigger efficiency. Additionally, we require the event vertex to be at least five counters from the upstream end and more than counters from the downstream end of the target, and less than cm from the detector center-line. The resulting data sample consists of 632338 long events and 291354 short events.
To directly compare the long and short events a muon track from the data was added to the short events to compensate for the absence of a muon in NC events. The fraction, f, of CC events with a low energy muon contained in the short sample (which will now contain two muon tracks) was determined from a Monte Carlo simulation to be approximately 20%. A simulated sample of such events was obtained by choosing a long event with the appropriate energy distribution from the data and combining it with a second short muon track. The length of the short track and its angular distribution were obtained from a Monte Carlo sample of CC events.
A sample of CC interactions with a muon track added were obtained by convolving an electromagnetic shower generated using GEANT [10] with an event from the long data sample with the appropriate energy. This assumes universality. The energy distribution of ’s and the fractional energy transfer were obtained from Monte Carlo. Because the hadron showers in the long data sample already have a muon track, the CC sample can be compared directly with the short and long events.
The long and short distributions were further corrected by subtracting contamination due to cosmic ray events. The cosmic ray background was estimated from an event sample collected during a beam-off gate using an analysis procedure identical to the one used for the data gates. Additionally, the distribution of short CC events, normalized to the predicted fraction f, was subtracted from the short event sample. The distributions for short, long, and CC events for various energy bins are shown in Figure 2.

We extract the number of CC events in each of 15 bins by fitting the corrected shape of the observed distribution for the short sample to a linear combination of long and CC distributions:
| (4) |
The of the fit in each of the 15 bins ranges from 33 to 78 for 41 degrees of freedom (DoF) with a mean value of 48.
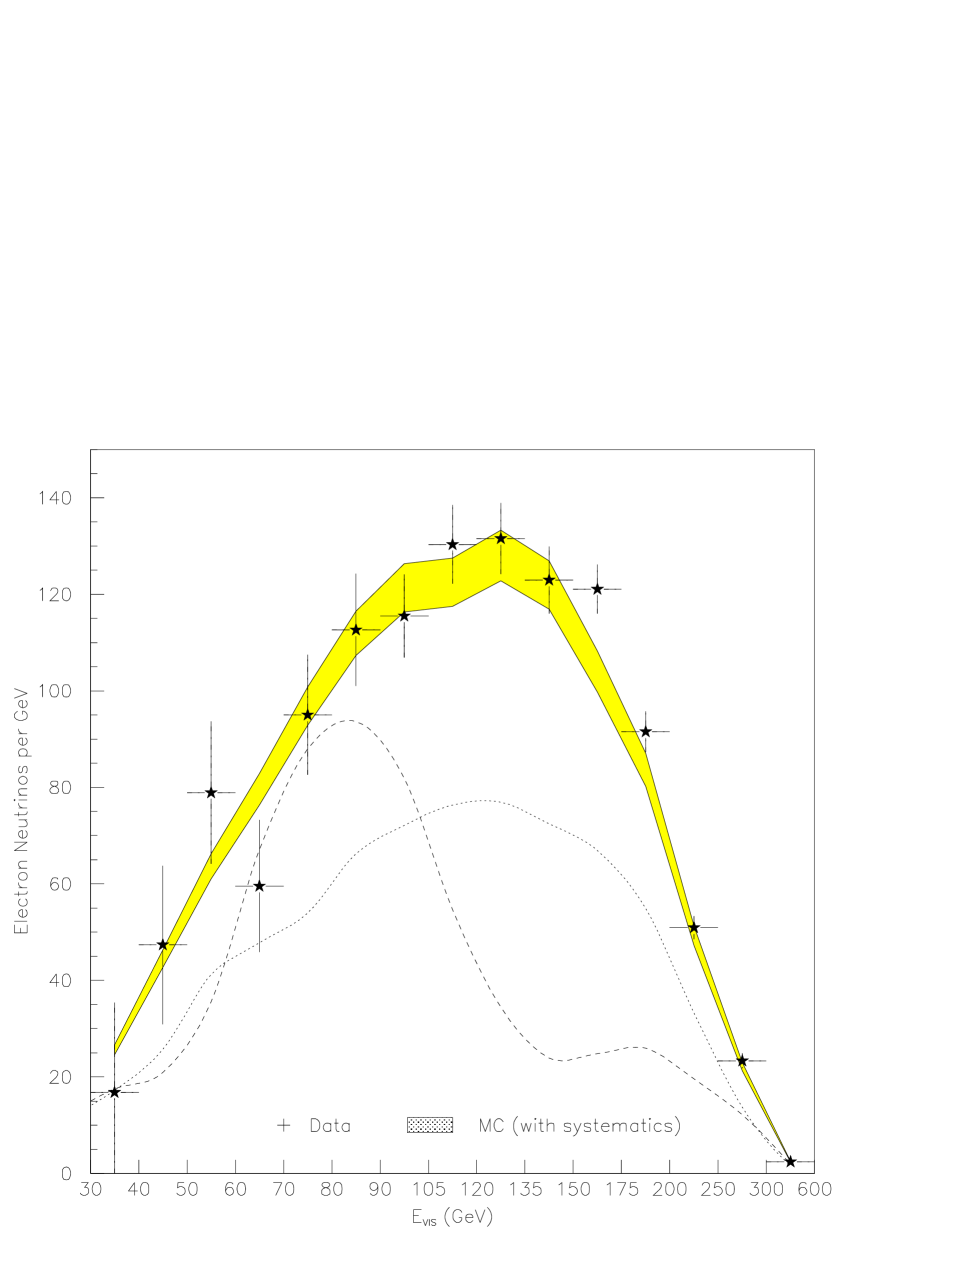
To search for oscillations the measured absolute flux of ’s at the detector was compared to the flux predicted by a detailed beamline simulation [14]. Figure 3 shows the measured number of CC’s for each energy bin compared with the predicted flux. The value with a no-oscillations assumption is DoF. We interpret a deficit in the measured flux as (or ) oscillations. ( oscillations are excluded above mixing angles of at the 90% confidence level in this range).
If oscillation occurs, some fraction, , of charged-current interactions will be observed in our data sample. These CC-like events result from interactions in which a large fraction of energy deposited by the final state is electromagnetic. To determine this fraction we simulated charged-current interactions in our detector using GEANT and a combination of LUND [11] to generate charged-current neutrino interactions and TAUOLA [12] to simulate tau lepton decays. We fit the resulting charged-current Monte Carlo sample to a linear combination of pure CC and NC generated samples. The resulting CC-like fraction of CC events is 18% for our data sample.
The effect of oscillations on the observed spectrum was determined in the following way: a beamline simulation was used to tag the creation point of a along the decay pipe giving the survival probablity for each as ()) from Eq. (1). The predicted flux was normalized to the observed charged-current muon neutrino flux at the detector which was simulated in the same beamline Monte Carlo. We also added in the number of charged-current interactions which would appear in the extracted sample at the detector. The probablity of observing a charged-current interaction in this data sample was calculated from the predicted normalized flux multiplied by the creation probability, ), and the CC-like fraction, . We took into account effects of charged-current cross section suppression by including mass suppression terms [13], kinematic suppression for massive particle production, and the altered visible energy spectrum () for charged-current events which contains visible energy from the tau decay in determining the effect of appearance.
The effect of oscillations on the spectrum depends on the creation probability of from , ). The appearance effect is calculated by multiplying ) by the CC-like fraction, and weighting by the CC cross section suppression factor. For completeness, we include a limit on from this data sample (see Figure 5).
The major sources of uncertainties in the comparison of the flux extracted from the data to that predicted by the Monte Carlo are: the statistical error from the fit in flux extraction, error in shower shape modeling (described below), uncertainty in the absolute energy calibration of the detector (1%) which affects the relative neutrino flux extracted using a data sample with low hadron energy [15], and finally the uncertainty in the predicted flux of ’s at the detector which is estimated to be [14]. This error is dominated by a 20% production uncertainty in the content of the secondary beam which produces 16% of the flux. The majority of the flux comes from decays, which are well-constrained by the observed spectrum from decays [14]. Other sources of systematic errors were also investigated and found to be small.
The uncertainty in shower shape modeling is estimated by extracting the flux using two definitions of . Analogous to the definition of given in Eq. (2), we define to be the ratio of the sum of the energy deposited outside the first four scintillation counters to the total visible energy. If the modeling of the showers were correct, the difference in the number of electron neutrinos measured by the two methods should be small, any difference is used to estimate the systematic error. Since this error was shown not to be correlated among energy bins, we add it in quadrature to the statistical error from the fit.
| (eV2) | Best fit | (eV2) | Best fit | |||||||||||||||||||||||||||||||||||||||||||||||||||||||||||||||||||||||||||||||||||||||||||||||
|---|---|---|---|---|---|---|---|---|---|---|---|---|---|---|---|---|---|---|---|---|---|---|---|---|---|---|---|---|---|---|---|---|---|---|---|---|---|---|---|---|---|---|---|---|---|---|---|---|---|---|---|---|---|---|---|---|---|---|---|---|---|---|---|---|---|---|---|---|---|---|---|---|---|---|---|---|---|---|---|---|---|---|---|---|---|---|---|---|---|---|---|---|---|---|---|---|---|---|
|
|
|
|
|
|
The data are fit by forming a which incorporates the Monte Carlo generated effect of oscillations and terms with coefficients accounting for systematic uncertainties. A best fit is determined for each by minimizing the as a function of and these systematic coefficients. At all , the data are consistent with no observed oscillations. Table I shows the best fit value of at each for oscillations. The largest statistical significance of a best-fit oscillation at any is .
The frequentist approach [16] is used to set a 90% confidence upper limit for each . The limit in corresponds to a shift of 1.64 units in from the minimum (at the best fit value in Table I). The 90% confidence upper limit is plotted in Figure 4 for and . The best limits of are is at and is at respectively. For , is excluded, and for for .

As an alternative statistical treatment of this result we present 90% confidence limits based on the unified approach of Feldman and Cousins [17] recently adopted by the PDG [18]. Figure 5 shows all CCFR limits obtained using the longitudinal shower-shape method. Our previously published limit [7] on used a one-sided confidence limit approach (as above).

In conclusion, we have used a high-statistics sample of charged-current interactions in the CCFR coarse-grained calorimetric detector to search for , and oscillations. We see a result consistent with no neutrino oscillations and find 90% confidence level excluded regions in phase space. This result improves on existing limits for in the range eV eV2.
REFERENCES
- [1] Y. Fukada et al., hep-ex/9807003.
- [2] C. Athanassopolous et al., Phys. Rev. Lett. 77, 3082 (1996), C. Athanassopolous et al., LA-UR-97-1998.
- [3] G. Zacek et al., Phys. Rev. D 34, 2621 (1986).
- [4] B. Achkar et al., Nucl. Phys. B434, 503 (1995).
- [5] O. Erriquez et al., Phys. Lett. B102, 73 (1981).
- [6] N. Ushida et al., Phys. Rev. Lett. 57, 2897 (1986).
- [7] A. Romosan et al. Phys. Rev. Lett. 78 2912 (1997), A. Romosan, PhD Thesis, Columbia University (1996), Nevis preprint 296, unpublished.
- [8] W.K. Sakumoto et al., Nucl. Instrum. Methods, A294, 179 (1990).
- [9] B.J. King et al., Nucl. Instrum. Methods, A302, 254 (1991).
- [10] CN/ASD, GEANT, detetector description and simulation tool, CERN (1995).
- [11] G. Ingelman, A. Edin, and J. Rathsman, Comput. Phys. Comm. 101 108 (1997).
- [12] S. Jadach et al., Comput. Phys. Comm. 64, 275 (1991).
- [13] C.H. Albright and C. Jarlskog, Nuc. Phys. B84, 467 (1975).
- [14] C. Arroyo et al., Phys. Rev. Lett. 72, 3452 (1994); Bruce J. King, PhD Thesis, Columbia University (1994), Nevis preprint 284, unpublished.
- [15] P.Z. Quintas, PhD Thesis, Columbia University (1992), Nevis Preprint 277, unpublished; W.C. Leung, PhD Thesis, Columbia University (1991), Nevis Preprint 276, unpublished.
- [16] Particle Data Group, Phys. Rev. D54,164 (1996).
- [17] G. Feldman and R. Cousins, Phys. Rev. D57, 3873 (1998).
- [18] Review of Particle Physics, Eur. Phys. J. C3,176 (1998).