Probing Hard Color-Singlet Exchange in Collisions
at = 630 GeV and 1800 GeV
Abstract
We present results on dijet production via hard color-singlet exchange in proton-antiproton collisions at GeV and 1800 GeV using the DØ detector. The fraction of dijet events produced via color-singlet exchange is measured as a function of jet transverse energy, separation in pseudorapidity between the two highest transverse energy jets, and proton-antiproton center-of-mass energy. The results are consistent with a color-singlet fraction that increases with an increasing fraction of quark-initiated processes and inconsistent with two-gluon models for the hard color-singlet.
The exchange of a quark or gluon between interacting partons in hadronic collisions typically results in final-state particle production over several units of rapidity. In contrast, the exchange of a color-singlet is expected to yield a rapidity gap, defined as the absence of particles in a region of rapidity (or pseudorapidity, , where is the polar angle). Rapidity gaps are most commonly observed in low momentum-transfer diffractive and elastic scattering processes, which are attributed to the exchange of a color-singlet called the pomeron. The observation of rapidity gaps between jets at both the Fermilab collider (Tevatron) [3, 4, 5, 6] and the DESY Collider (HERA) [7] implies the exchange of a hard color-singlet. The measured fraction of dijet events arising from color-singlet exchange is roughly in proton-antiproton collisions [3, 4, 5, 6] and in positron-proton collisions [7]. These rates are too large to be explained by electroweak boson exchange and indicate a strong-interaction process [5, 7].
The final-state particle multiplicity distribution between jets is used to distinguish between color exchange and color-singlet exchange. By identifying an excess of low multiplicity events using the DØ calorimeter, tracking system, or both, we measure the observable fraction of color-singlet exchange in dijet events (“color-singlet fraction”). This Letter presents new measurements by the DØ Collaboration of the color-singlet fraction as a function of jet transverse energy (), pseudorapidity separation between the two highest jets (), and proton-antiproton center-of-mass energy (). We then compare these measurements to hard color-singlet models.
The DØ detector and trigger system are described in Ref. [8]. The data samples were accumulated during the 1994–1996 Tevatron run primarily at a proton-antiproton center-of-mass energy of 1800 GeV, with a short run at 630 GeV during this period. Jets were found in the liquid-argon calorimeter (full coverage to ) using a cone algorithm with radius in space, where is the azimuthal angle. Samples of “opposite-side” (OS) jet events () and “same-side” (SS) jet events () were collected using triggers similar to those described in Ref. [5]. The triggers required both jets to have above a threshold which varied from 12 to 25 GeV depending on the trigger. All triggers required at least two jets with , and the opposite-side triggers required a dijet pseudorapidity separation of at GeV and at 630 GeV.
In the offline analysis, the vertex was required to have a longitudinal position within 50 cm of the center of the detector and the two highest transverse energy (leading) jets were required to have . The opposite-side samples were required to have between the leading two jets. Since multiple interactions (more than one proton-antiproton interaction in the same bunch crossing) may obscure the rapidity gap signal of color-singlet exchange, we retained only events with a single reconstructed vertex and additionally required the beam-beam hodoscope timing information to be consistent with a single interaction.
Table I summarizes the data samples used in this analysis, including the cut on the transverse energy of the second leading jet (), the integrated luminosity, and the approximate number of events for each trigger. At GeV, three exclusive opposite-side data samples corresponding to triggers with low, medium, and high thresholds (“low-”, “med-”, and “high-”) are used to determine the dependence of the color-singlet fraction. The dependence of the color-singlet fraction is measured using the low- and high- samples. The large statistics high- sample gives the most accurate measure of the color-singlet fraction.
Samples with the same jet threshold of 12 GeV are used to compare the GeV and 1800 GeV color-singlet fractions. This lower cut provides adequate statistics for the 630 GeV sample. Figures 1(a) and (b) show the average jet and , respectively, of the two leading jets for the 630-OS and 1800-OS samples. As expected from kinematic considerations, the jets in the GeV sample reach a higher and than the 630 GeV sample. Figure 1(c) shows the average parton () for the two samples, where we calculate using a leading order approximation (; ).
Table I also lists the same-side samples at 630 GeV and 1800 GeV. Same-side events are useful since they have similar characteristics to opposite-side events but have no observable color-singlet component [5].
| Name | (GeV) | (GeV) | Luminosity (nb-1) | Events |
|---|---|---|---|---|
| low- | 1800 | 86 | 27000 | |
| med- | 1300 | 21000 | ||
| high- | 11000 | 72000 | ||
| 1800-OS | 86 | 48000 | ||
| 1800-SS | 18 | 57000 | ||
| 630-OS | 630 | 520 | 6700 | |
| 630-SS | 350 | 6800 |

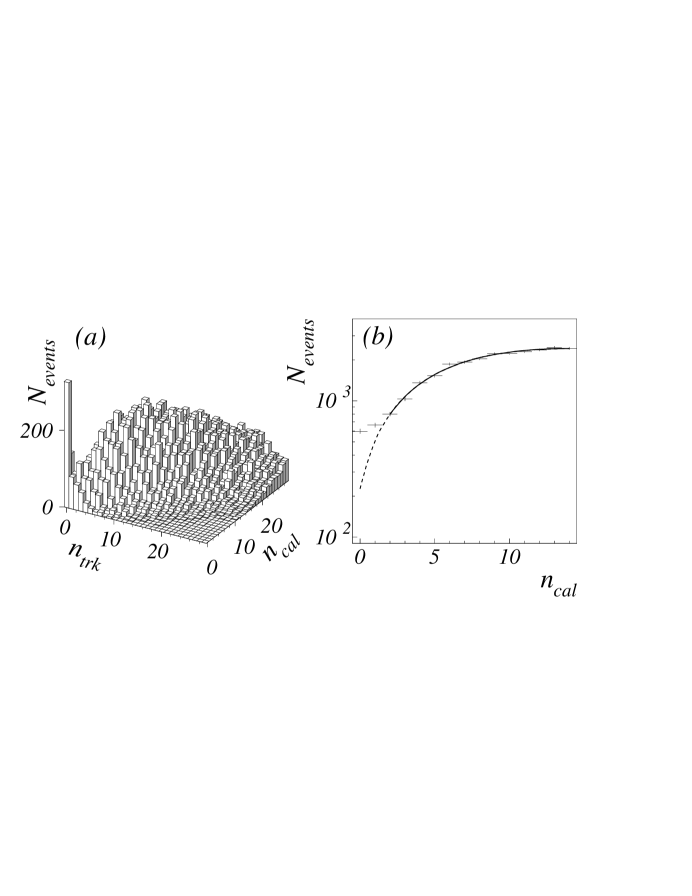
We determine the amount of color-singlet exchange in the opposite-side samples by utilizing the multiplicity distributions measured by the calorimeter and the tracking system in the pseudorapidity region . This region has little sensitivity to contamination from the leading jets, which have a minimum of 1.9. We measure the multiplicity in the electromagnetic calorimeter by counting the number of towers () with MeV (). The electromagnetic section of the calorimeter has a low level of noise and the ability to detect both charged and neutral particles. We also count the number of tracks in the central drift chamber (), which is a non-magnetic tracking system that detects charged particles to low momenta and provides an independent measure of the multiplicity.
Figure 2(a) displays the versus distribution in the central region () between the jets for the high- ( GeV) sample. A large excess of events is observed at low multiplicity, consistent with the expectations of a color-singlet exchange signal and similar to that observed previously [5, 6]. Figure 2(b) shows the distribution with a three-parameter negative binomial distribution (NBD) fit, which is used to determine the color-exchange background. NBD’s have previously been shown to provide a good description of particle multiplicity distributions in proton-antiproton collisions [5].
We measure the color-singlet fraction () by dividing the number of events above the NBD fit for by the total number of events in the sample. This quantity is insensitive to noise: after the suppression of a few known noisy calorimeter towers, less than of events taken during no-beam runs have more than one tower above threshold. In addition, the color-singlet fraction is not sensitive to jet finding and trigger efficiencies, which cancel in the ratio since the jets found in color-singlet events are indistinguishable from the jets in color-exchange events.
To minimize sensitivity to residual contamination from multiple proton-antiproton interactions, we fit to the low multiplicity region of the data. The fits start where the signal to background ratio becomes negligible () and end near the maximum of the multiplicity distribution ( at 630 GeV and at 1800 GeV). The fits are then extrapolated to zero multiplicity to determine the background. This method was tested by generating and fitting ensembles of multiplicity distributions with and without a known signal component at low multiplicity. These studies confirm that the fitting method is unbiased and also provide a measure of the systematic error [9, 10]. An additional uncertainty due to the choice of the starting multiplicity bin used for the fit is estimated by determining the background using a starting bin of ; the resulting change in background extrapolation is applied as an additional systematic error.
Corrections are applied to to account for residual multiple interaction contamination in the samples as well as for single-vertex events erroneously tagged as multiple interaction events. The extra multiplicity from secondary interactions causes color-singlet events to be erroneously measured with a large multiplicity. By studying the shape of the multiplicity distribution as a function of luminosity, a correction is determined that results in roughly a 30% increase in . The vertex correction reduces by about 10% since color-singlet events always have one vertex, but about 10% of color exchange events with one interaction have two reconstructed vertices [11].
Applying the fitting method to the GeV high- data ( GeV) shown in Fig. 2(b), we obtain (stat)(syst)]%. The systematic error is dominated by the uncertainty in the background subtraction () but also includes uncertainties in the single interaction determination (), offline cuts (), and jet energy scale and reconstruction (). This measurement is the most precise to date and is consistent with previously published measurements at the Fermilab Tevatron with similar minimum jet [3, 4, 5, 6].
The value of does not depend on the exact method used to measure particle multiplicity. We vary the calorimeter tower threshold used for determining between 150 MeV and 350 MeV (the nominal value is 200 MeV) and obtain a consistent value for the fraction. Redefining multiplicity using a “cluster” of neighboring calorimeter towers to account for possible calorimeter showering effects, or using the tracking multiplicity () instead of results in a measured color-singlet fraction within a few per cent of the nominal value.
Figure 3(a) shows the multiplicity distribution between the jets for the 1800-OS sample with GeV. Fitting the distribution and measuring the color-singlet fraction, we obtain (stat)(syst)]. This value is about smaller than the value measured for GeV, indicating a dependence of the color-singlet fraction on jet .
Figure 3(b) shows the multiplicity distribution between the jets for the 630-OS sample. For this sample we obtain (stat)(syst)]. The uncertainties in the 630-OS and 1800-OS measurements are dominated by the fit errors, which are not correlated between the two samples. We calculate the significance of the difference between the two values as in the limiting case that the uncertainties are completely uncorrelated.

The ratio of the two measurements for GeV is . We verify that the lower average multiplicity for 630 GeV does not affect the measured ratio by raising the electromagnetic tower threshold of the 1800 GeV data so that the leading edge of the distribution matches that of the 630 GeV sample. We also obtain a consistent value for the ratio when we measure it using a two-dimensional versus multiplicity method (described below).
Measuring the color-singlet fraction as a function of and requires splitting the data into several bins. The NBD fitting uncertainty becomes unacceptably large for these smaller statistics sub-samples, so a new two-dimensional multiplicity method is employed to reduce the uncertainty. For each bin of or , we first determine the fraction of events with . We then obtain the “2D” color-singlet fraction () by subtracting the appropriate color-exchange background and correcting by the acceptance relative to the NBD method.
The color-exchange background for the “2D” fraction is determined using the following procedure. The NBD fit to the calorimeter multiplicity distribution for each full sample is used to determine the total background () for that sample. This “1D” background is converted to a “2D” background by multiplying by the ratio obtained from the same-side multiplicity distribution in the same detector region. The same-side data are thus used only to account for correlations between and . The average background is roughly 25% for each sample. The dependence of the background on and is measured using a low-multiplicity control region () where the color-singlet contribution is negligible. The final background for each sample is determined by multiplying the average background with its and dependence.
The background is then subtracted from each and bin of the uncorrected “2D” fraction. The background has little dependence on and , so the dependence of the color-singlet fraction on these variables before and after background subtraction is quite similar.
Comparing the color-singlet fraction from the “2D” method to from the NBD fitting method for each sample, we determine that the “2D” method has a relative acceptance of % for color-singlet events. This acceptance has been determined to have little dependence on and , and its uncertainty (3% over the range and 6% over the range) is included in subsequent shape comparisons to different color-singlet models. We obtain the final color-singlet fractions and by correcting for the color-singlet acceptance determined from the high- sample.
Figure 4(a) shows the color-singlet fraction at 1800 GeV obtained using the low-, med-, and high- data samples. The error bars show the statistical uncertainty, while the bands show the relative normalization uncertainties between the different data samples. We bin by second leading jet () to mimic the way the dijet triggers select events. In contrast, binning by average dijet selects primarily back-to-back dijet events near the trigger threshold. Since color-singlet events are more likely to be back-to-back than color-exchange events, using an average method would bias the color-singlet fraction as a function of .
Figures 4(b) and 4(c) show the color-singlet fraction at 1800 GeV for the low- and high- samples, respectively. The error bars show the statistical uncertainty, while the bands show the relative normalization uncertainties between the different data samples.
Figures 4(a)–(c) show that the measured color-singlet fraction tends to increase with and , implying that the fraction increases with parton . Replotting Fig. 4(b)–(c) in Fig. 4(d) as a function of , with averaged over each bin, shows a rise in the measured color-singlet fraction with . In principle it is possible to measure the color-singlet fraction directly as a function of parton . However, bin-dependent acceptance effects related to the dijet trigger make it preferable to do the analysis in the observables and .

Measuring the color-singlet fraction as a function of , , and probes the nature of hard color-singlet exchange. If the color-singlet exchange process were identical to single-gluon exchange except for different coupling factors to quarks and gluons, the color-singlet fraction would depend only on parton distribution functions through the parton . Thus, for a color-singlet that couples more strongly to gluons (quarks), the color-singlet fraction would fall (rise) as a function of increasing , since the gluon distribution becomes relatively suppressed as increases. This scenario would imply a decreasing (increasing) color-singlet fraction with increasing jet and or decreasing . The observed color-singlet fraction may deviate from this simplistic behavior, however, if the dynamics of color-singlet exchange are distinct from the dynamics of single-gluon exchange. Currently QCD does not account for the existence of hard color-singlet exchange, but higher-order QCD processes have been proposed to explain this phenomenon [12, 13, 14, 15, 16, 17, 18].
The measured color-singlet fraction includes the probability that the color-singlet events are observable, and can be written as , where is the fraction of dijet events produced by color-singlet exchange, and is the survival probability (probability that the rapidity gap is not contaminated by particles from spectator interactions). This survival probability () cannot be measured independently from the color singlet, and is assumed not to depend on the or type of the initiating partons in the hard scattering [13, 19]. Although initial estimates of had a weak () dependence on center-of-mass energy [19], a recently revised estimate gives a stronger dependence [20].
We compare our color-singlet results to Monte Carlo color-singlet models using HERWIG [21], which includes parton showering and hadronization of the final state partons. Monte Carlo samples were generated using CTEQ2M [22] parton distribution functions [23]. As in the data, jets were reconstructed using a cone algorithm with a radius of . Detector effects were simulated by smearing the jet and according to measured jet resolutions. The two leading jets were required to have and as in the data samples.
For all the models the color-singlet fraction as a function of and is obtained by dividing the binned color-singlet cross section by the corresponding HERWIG QCD cross section. A rapidity gap requirement was not imposed on any of the Monte Carlo samples since identifying rapidity gaps depends on the details of hadronization and the modeling of spectator interactions. The rapidity gap survival probability is assumed to be independent of and , and its magnitude is absorbed in an overall normalization factor.
We use a Bayesian probability method to fit the color-singlet fraction predicted by the Monte Carlo models independently to the data (Fig. 4(a)) and the data (Fig. 4(b)–(c)). Although the measurements of the color-singlet fraction as a function of and are statistically correlated, they contain complementary information. The normalization, which is not well-determined for any of the models, is the only free parameter in the fits to each model, except for the “free-factor” model (discussed below).
The corrections, background, acceptance, Monte Carlo expectations, and uncertainties in these quantities are included in the Bayesian integral as prior probability distributions. Since there has been no previous comparison to color-singlet models, we assign an identical prior probability for each model and assume a flat prior probability (no preferred value) for each fit parameter. We obtain the posterior probabilities for the fit parameters by integrating the likelihood function over all prior probability distributions. For each model, we determine the fit parameter values that maximize the posterior probability for that model. The uncertainty in each fit parameter is obtained from its posterior probability distribution by determining the 68% confidence interval which has equally probable endpoints. If one of the boundaries is restricted by physical constraints then we use the smallest 68% confidence interval to determine the uncertainty. The maximum of the likelihood is taken as a measure of the relative goodness-of-fit of that model.
The Bayesian method was chosen for fitting the data since the conventional method introduces a normalization bias in the case of correlated uncertainties [24]. This bias is small when the model describes the data well, but for some of the models the fitted normalization from the method was as much as a factor of two smaller than the corresponding Bayesian value.
Figures 5–6 show fits to the measured color-singlet fraction. Even though the fraction versus and are fit separately, the fit parameters obtained from each variable do not differ appreciably for any given model. Since the distributions for the low- and high- samples are fit simultaneously, a model prediction that is above the data for one plot would be below the data for the other.
The dashed line in Fig. 5 (BFKL ) shows a parton-level color-singlet prediction of a two-gluon exchange process incorporating the BFKL dynamics of Mueller and Tang [15, 25]. The solid line is the BFKL color-singlet fraction at the jet level after hadronization. The BFKL models do not give an adequate description of the data, primarily due to their prediction of decreasing color-singlet fractions with . Assuming a survival probability of about 10%, the normalizations obtained for the BFKL models are a factor of 6–9 lower than the data.
Note that the BFKL color-singlet fraction falls with while the jet-level fraction rises. Although the BFKL cross section prediction has the same behavior with at both levels, parton showering for standard QCD processes reduces the jet separation at the jet level relative to the parton level. The resulting BFKL color-singlet fraction prediction is thus sensitive to higher-order effects in QCD processes, casting doubt on the reliability of current parton-level predictions.
Although the rate of -channel photon exchange is too small to describe DØ data [5], the photon-exchange process in HERWIG can be used to investigate two models in which the color-singlet couples only to quarks: a massless photon-like singlet and a massive U(1) gauge boson [26]. To simulate the exchange of a massive U(1) gauge boson that couples to baryon number, the photon cross section is multiplied by a kinematical factor of which accounts for the exchange of a boson with mass . The coupling of the U(1) gauge boson is absorbed in the overall normalization. The behavior of the resulting color-singlet fraction is similar to photon exchange except for a steeper rise as a function of . The lowest allowed mass of GeV [26] gives the best fit to the data. Figure 5 shows the fits to the photon (dot-dashed line) and U(1) (dotted line) models. These models do not give an adequate description of the data due to their prediction of a steep rise in the color-singlet fraction with and with for the high sample [27].

In addition to the color-singlet processes in HERWIG, we construct a set of simple “color-factor” models which explore different possibilities for the coupling of the color singlet to quarks and gluons. In this approach, the color-singlet fraction is parametrized as a weighted sum of the relative fractions of quarks and gluons from parton distribution functions. The weights represent effective “color factors” that enhance or suppress coupling to initial quarks and gluons compared to pure single-gluon exchange. This parametrization can be written as
where is a normalization factor, and and denote the relative fractions of initial quarks and gluons from hadron . , , and are the effective color factors for quark-quark, quark-gluon, and gluon-gluon processes, respectively [28], where the subscripts refer to the identity of the interacting partons from the proton and anti-proton. We apply this formalism to several color-singlet models and make quantitative comparisons to the data.
The soft-color rearrangement model, which has been used to explain rapidity gaps in positron-proton collisions [17], has recently been generalized as an alternative QCD-motivated explanation for rapidity gaps in hadron-hadron collisions [18]. In this model, color flow (via the exchange of a single gluon) can be cancelled by the exchange of soft gluons, leading to a rapidity gap and thus an effective colorless exchange. This cancellation is more likely for initial-state quark processes than for gluon processes since quark states have fewer possible color flow configurations. Based on counting arguments with three quarks and eight gluons, a reasonable choice of color factors is , and [18]. The “soft-color” model predicts a color-singlet fraction that increases with increasing parton , and thus predicts a color-singlet fraction that increases with and . As seen in Fig. 6, the soft-color model (dashed line) gives a reasonable description of the data.
The exchange of two gluons in a color-singlet state was originally proposed as a simple mechanism to produce rapidity gaps between jets [12, 13] with a predicted color-singlet fraction on the order of [13]. Within the naïve color-factor formalism, the color factors for this simple two-gluon model are , , and [13]. Since the coupling to gluons is stronger for the two-gluon singlet than for single-gluon exchange, the observed color-singlet fraction is expected to decrease with increasing due to the parton distributions, in contrast with the soft-color model. As seen in Fig. 6, the “two-gluon” model (dot-dashed line) does not give an adequate description of the data.
We also fit a “single-gluon” model in which the color singlet is indistinguishable from single-gluon exchange, except in production rate. In this model, and there is no dependence on or ( is constant). The comparison of the single-gluon model and data is shown in Fig. 6. The single-gluon model (dotted line) does not reproduce the rising trend of the data with or .

To determine the best fit within the color-factor formalism, we fit a “free-factor” model in which the three color factors are allowed to float (). We obtain the following values for the color factors: , , and . The best fit to the data, shown as the solid line in Fig. 6, thus favors a color-singlet that couples strongly to quarks with only a few per cent contribution from the quark-gluon term ( : : : : ).
Table II shows the relative likelihood for each of the color-singlet models, ordered by relative likelihood. The relative likelihood is the likelihood of each model normalized to that of the free-factor model, which provides an excellent description of the data. Table II also displays the average value of divided by the number of degrees of freedom (), which is calculated by integrating all possible values over the prior probability distributions and dividing by the number of data points minus the number of fit parameters. If the Monte Carlo expectation were identical to the observed data in each bin then by definition .
The soft-color model gives a good descriptions of both data variables, although the free-factor model has a likelihood that is several times larger than the soft-color model. The color factors for both of these models indicate that the data are consistent with a color-singlet that couples primarily to quarks. The single-gluon model does not give as good a fit to the data as the soft-color model, but a color-singlet that couples like a single gluon cannot be excluded. None of the other models adequately describes the color-singlet fraction for both variables.
| Fit to | Fit to | |||
|---|---|---|---|---|
| Model | Likelihood | Likelihood | ||
| “free-factor” | 1/5 | 6/9 | ||
| “soft-color” | 3/7 | 10/11 | ||
| “single-gluon” | 8/7 | 18/11 | ||
| BFKL | 23/7 | 15/11 | ||
| photon | 14/7 | 30/11 | ||
| “two-gluon” | 15/7 | 30/11 | ||
| BFKL | 38/7 | 51/11 | ||
| U(1) | 64/7 | 58/11 | ||
Since the free-factor and soft-color models are in good agreement with the and dependence at GeV, we use them to calculate . This results in a predicted value of , where the uncertainty includes the statistical error on the Monte Carlo samples as well as the difference between the two models. If we assume that the models are correct, then the discrepancy between the predicted value and the measured value of could be attributed to the dependence of the survival probability. With this assumption, we obtain a value of for the ratio of survival probabilities between the two energies, which is consistent with a recent estimate for this ratio of [20].
In conclusion, we have presented new information on the fraction of dijet events produced via color-singlet exchange. For our largest data sample, GeV at GeV, we measure a color-singlet fraction (stat)(syst)]%. The measured ratio of color-singlet fractions between GeV and 1800 GeV for jets with GeV is . The measured color-singlet fraction at GeV tends to increase with dijet and . Under the assumption of an -independent survival probability, the data favor soft-color rearrangement models in which the color-singlet is preferentially exchanged in processes with initial quarks. A model in which the color-singlet coupling is similar to single-gluon exchange cannot be excluded. Photon-like, U(1), and current two-gluon models do not adequately describe the data.
We thank Errol Gotsman, Francis Halzen, Hitoshi Murayama, and Dieter Zeppenfeld for their comments and useful discussions. We thank the staffs at Fermilab and collaborating institutions for their contributions to this work, and acknowledge support from the Department of Energy and National Science Foundation (U.S.A.), Commissariat à L’Energie Atomique (France), Ministry for Science and Technology and Ministry for Atomic Energy (Russia), CAPES and CNPq (Brazil), Departments of Atomic Energy and Science and Education (India), Colciencias (Colombia), CONACyT (Mexico), Ministry of Education and KOSEF (Korea), and CONICET and UBACyT (Argentina).
REFERENCES
- [1] Visitor from Universidad San Francisco de Quito, Quito, Ecuador.
- [2] Visitor from IHEP, Beijing, China.
- [3] S. Abachi et al. (DØ Collaboration), Phys. Rev. Lett. 72, 2332 (1994).
- [4] F. Abe et al. (CDF Collaboration), Phys. Rev. Lett. 74, 855 (1995).
- [5] S. Abachi et al. (DØ Collaboration), Phys. Rev. Lett. 76, 734 (1996).
- [6] F. Abe et al. (CDF Collaboration), Phys. Rev. Lett. 80, 1156 (1998).
- [7] M. Derrick et al. (ZEUS Collaboration), Phys. Lett. B 369, 55 (1996).
- [8] S. Abachi et al. (DØ Collaboration), Nucl. Instrum. Methods Phys. Res. A 338, 185 (1994).
- [9] T. Thomas, Ph.D. Dissertation, Northwestern University, 1997 (unpublished).
- [10] J. Perkins, Ph.D. Dissertation, University of Texas, Arlington, 1998 (unpublished).
- [11] The vertex algorithm was optimized for primary vertex resolution.
- [12] Yu L. Dokshitzer, V. Khoze and T. Sjostrand, Phys. Lett. B 274, 116 (1992).
- [13] J. D. Bjorken, Phys. Rev. D 47, 101 (1992).
- [14] H. Chehime et al., Phys. Lett. B 286, 397 (1992).
- [15] A.H. Mueller and W. K. Tang, Phys Lett. B 284, 123 (1992).
- [16] V. Del Duca and W. K. Tang, Phys. Lett. B 312, 225 (1993).
- [17] W. Buchmüller, Phys. Lett. B 353, 335 (1995); W. Buchmüller and A. Hebecker, Phys. Lett. B 355, 573 (1995).
- [18] O. J. P. Eboli, E. M. Gregores and F. Halzen, MAD/PH-96-965 (1997).
- [19] E. Gotsman, E.M. Levin and U. Maor, Phys. Lett. B 309, 199 (1993).
- [20] E. Gotsman, E. Levin and U. Maor, hep-ph/9804404, submitted to Phys. Lett. B.
- [21] G. Marchesini, et al., Comp. Phys. Commun. 67, 465 (1992). We used HERWIG version 5.9.
- [22] CTEQ2M was not published. See J. Botts et al., Phys. Rev. D 51, 4763 (1995).
- [23] The Monte Carlo results are relatively insensitive to the choice of parton distribution functions for the range of in the data samples ().
- [24] G. D’Agostini, Nucl. Instrum. Methods Phys. Res. A 346, 306 (1994).
- [25] We used the parameters specified in Ref. [15].
- [26] C. D. Carone and H. Murayama, Phys. Rev. Lett. 74, 3122 (1995); C. D. Carone and H. Murayama, Phys. Rev. D 52, 484 (1995).
- [27] Photon exchange processes in HERWIG are subject to similar higher-order effects to those seen in the BFKL color-singlet fraction as a function of .
- [28] Although this approach is similar to one found in Ref. [18], we developed it independently to complement the existing color-singlet models in HERWIG.