The Search for Neutrino Oscillations with KARMEN
Abstract
The neutrino experiment KARMEN is situated at the beam stop neutrino source ISIS. It provides ’s, ’s and ’s in equal intensities from the ––decay at rest (DAR). The oscillation channel is investigated in the appearance mode with a 56 t liquid scintillation calorimeter at a mean distance of m from the –source looking for p ( , e+ ) n reactions. The cosmic induced background for this oscillation search could be reduced by a factor of 40 due to an additional veto counter installed in 1996. In the data collected through 1997 and 1998 no potential oscillation event was observed. Using a unified approach to small signals this leads to an upper limit for the mixing angle of (90% CL) at large . The excluded area in (,) covers almost entirely the favored region defined by the LSND evidence.
1 INTRODUCTION
The search for neutrino oscillations and hence massive neutrinos is one of the most fascinating fields of modern particle physics. The Karlsruhe Rutherford Medium Energy Neutrino experiment KARMEN searches for neutrino oscillations in different appearance ( [2] and ) and disappearance modes ( [3]). The physics program of KARMEN also includes the investigation of –nucleus interactions [4] as well as the search for lepton number violating decays of pions and muons and the test of the V–A structure of decay [5].
Here, we present results of the oscillation search in the appearance channel on the basis of data taken from February 1997 to April 1998 with the upgraded experimental configuration (KARMEN2). As will be shown in the following, no potential oscillation signal was observed. Therefore, special emphasis is given to the KARMEN2 capability of measuring induced events, the determination of the evaluation cuts and the identification and measurement of the background expectation.
2 NEUTRINO PRODUCTION AND
EXPERIMENT CONFIGURATION
The KARMEN experiment is performed at the neutron spallation facility ISIS of the Rutherford Appleton Laboratory, Chilton, UK. The neutrinos are produced by stopping 800 MeV protons in a beam stop target of Ta-. In addition to spallation neutrons, there is the production of charged pions. The are absorbed by the target nuclei whereas the decay at rest. Muon neutrinos therefore emerge from the decay + . The produced are also stopped within the massive target and decay via e+ + + . Because of this --decay chain at rest ISIS represents a -source with identical intensities for , and emitted isotropically ( /s per flavor for a proton beam current A). There is a minor fraction of decaying in flight (DIF) with the following DAR in the target station which again is suppressed by muon capture of the high material of the spallation target. This decay chain leads to a very small contamination of [6], which is even further reduced by the final evaluation cuts.
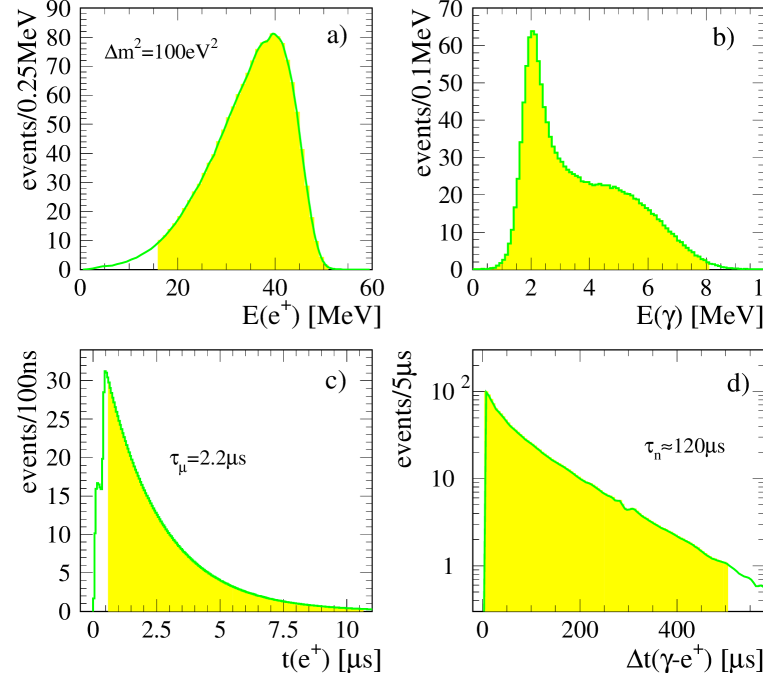
The energy spectra of the ’s are well defined due to the DAR of both the and (Figure 1a). The ’s from –decay are monoenergetic with E()=29.8 MeV, the continuous energy distributions of and up to MeV can be calculated using the V–A theory and show the typical Michel shape. Two parabolic proton pulses of 100 ns base width and a gap of 225 ns are produced with a repetition frequency of 50 Hz. The different lifetimes of pions ( = 26 ns) and muons ( = 2.2 s) allow a clear separation in time of the -burst (Figure 1b) from the following ’s and ’s (Figure 1c). Furthermore the accelerator’s duty cycle of allows effective suppression of any beam uncorrelated background.
The neutrinos are detected in a rectangular tank filled with 56 t of a liquid scintillator. This central scintillation calorimeter is segmented by double acrylic walls with an air gap allowing efficient light transport via total internal reflection of the scintillation light at the module walls. The event position is determined by the individual module and the time difference of the PM signals at each end of this module. Due to the optimized optical properties of the organic liquid scintillator and an active volume of 96% for the calorimeter, an energy resolution of is achieved. In addition, Gd2O3 coated paper within the module walls provides efficient detection of thermal neutrons due to the very high capture cross section of the Gd ( n, ) reaction ( barn). The KARMEN electronics is synchronized to the ISIS proton pulses to an accuracy of better than ns, so that the time structure of the neutrinos can be exploited in full detail.
A massive blockhouse of 7000 t of steel in combination with a system of two layers of active veto counters provides shielding against beam correlated spallation neutron background, suppression of the hadronic component of cosmic radiation as well as reduction of the flux of cosmic muons. On the other hand, this shielding is a source of energetic muon induced neutrons produced by deep inelastic muon nucleon scattering and the nuclear capture of . These neutrons produced in the steel can penetrate the anti counter systems undetected and simulate a detection sequence. The prompt signal is caused e.g. by a scattering followed by the delayed capture of the thermalized neutron.These neutrons were the major background source in the KARMEN1 experiment. In 1996 an additional third anti counter system with a total area of 300 m2 was installed within the 3 m thick roof and the 2–3 m thick walls of the iron shielding [7]. By detecting the muons in the steel at a distance of 1 m from the main detector and vetoing the successive events this background has been reduced by a factor 40 compared to the KARMEN1 data.
3 SEARCH FOR OSCILLATIONS
The probability for –oscillations can be written in a simplified 2 flavor description as
| (1) |
where L and are given in meters and MeV, denotes the difference of the squared mass eigenvalues in eV2/c4. With m and MeV, KARMEN is sensitive to small mixings for oscillation parameters eV2/c4, essentially.
The signature for the detection of ’s is a spatially correlated delayed coincidence of positrons from p ( , e+ ) n with energies up to MeV (Figure 2a) and emission of either of the two neutron capture processes p ( n, ) d with one of MeV or Gd ( n, ) Gd with 3 –quanta in average and a sum energy of MeV (Figure 2b). The positrons are expected in a time window of several s after beam–on–target (Figure 2c) with a 2.2 s exponential decrease due to the decay. The time difference between the e+ and the capture is given by the thermalization, diffusion and capture of neutrons.
The raw data investigated for this oscillation search was recorded in the measuring period of February 1997 to February 1998 which corresponds to 2897 C protons on target or produced in the ISIS target. A positron candidate is accepted only if there is no activity in the central detector, the inner anti or outer shield up to 24 s before. If only the outermost veto counter was hit, a dead time of 14 s is applied. These conditions reduce significantly background induced by cosmic muons: penetrating , decay products of stopped muons and neutrons from deep inelastic muon scattering. Further cuts select sequences of events correlated in space and time. To extract a possible induced signal these cuts were obtained from an optimization procedure to get highest sensitivity for a possible small (e+,n) signal from oscillations. This procedure described in more detail in section 5 results in the following cuts on the observed values of the prompt event: s, . The cuts on the delayed event are applied as follows: s, MeV and a spatial coincidence volume of 0.97 m3.
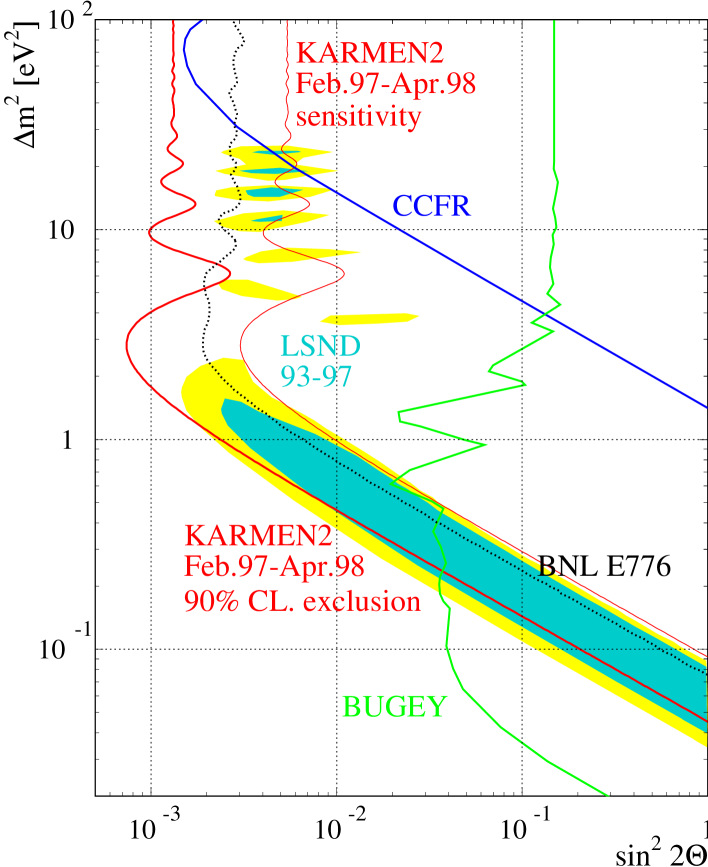
In the investigated data, no sequential structure fulfilled all the required properties for a (e+,n) sequence. After all cuts, the remaining background amounts to only events caused by sequential cosmic background and induced sequences. These background sources are described in detail in the following section. The probability of measuring zero events with an expected number of background events is 5.6%. Applying a unified approach [8], we deduce an upper limit of (90% CL) for a potential oscillation signal. With an expectation of for and large this corresponds to a limit of
| (2) |
for eV2/c4. Fig 3 shows the KARMEN2 exclusion curve in comparison with other experiments.
4 BACKGROUND SOURCES
There are in total four background sources contributing to the expected number of background events: cosmic muon induced background, induced background dominated by the charged current reaction 12C ( , e- ) 12Ng.s. with subsequent early decays of the produced , random coincidences of single prong neutrino reactions (e.g. neutral current events) with low energy background events and the intrinsic contamination of the neutrino source ISIS with from and decays. All background sources except the intrinsic contamination can be measured online and with high precision parallel to the search for neutrino oscillations.
4.1 Cosmic muon induced background
The KARMEN experiment is surrounded by a massive 7000 t iron shielding. Energetic muon induced neutrons produced in the steel can penetrate the anti counter systems of the detector undetected. By detecting the muons in the steel with the new veto counter at a distance of 1 m from the main detector and vetoing the successive events the background can be strongly suppressed. This background is well described by a detailed three–dimensional Monte Carlo simulation and therefore well understood. Moreover this background can be precisely measured online due to the ISIS duty factor of for ’s from decay. The extrapolation of the number of events recorded in a large time window outside the beam pulses to the actual measuring time interval of s is straight forward resulting in a precise cosmic background expectation of events.
4.2 induced background
The for the search for are produced by the DAR e+ + + . Therefore there is an equal amount of produced in the very same decay reaction. The can be detected via a sequence of a prompt electron from the inverse beta decay 12C ( , e- ) 12Ng.s. and the subsequent detection of a delayed positron from the decay 12Ng.s. 12C + e+ + . The lifetime of 12N is 15.9 ms and the –decay endpoint is 16.3 MeV. About 500 sequences of this type have been clearly identified with a signal to noise ratio of 35 during the KARMEN1 data taking allowing a rich analysis of the nuclear physics involved [4].
The 1.7% fraction of 12N decaying within the first 270 s contributes to the expected background level. Once again this background can be recorded online and with high statistics. The extrapolation of the measured number of charged current sequences to the smaller time differences and the lower energies of delayed ’s of the oscillation search is straight forward. Looking for events with larger time differences ( s) and energies appropriate for () sequences from 12C ( , e- ) 12Ng.s. and 12Ng.s. 12C + e+ + one obtains a number of charged current events compatible with the KARMEN1 data.
4.3 Neutrino random coincidences
Due to the relative high rate of low energy radioactive background events in the KARMEN detector there is a small probability that such a low background event occurs randomly correlated in space and time to a prompt neutrino event with an energy above 20 MeV. The rate of such random coincidences is strongly suppressed by the tight spatial and time coincidence cuts. The rate of the radioactive background events is constant in time and thus the energy and position distributions of these events can be recorded with high precision and extrapolated to the actual measuring time window. The probability of finding such a low energy background event in the vicinity of a prompt neutrino event can be obtained by generating pseudo neutrino events with a Monte Carlo method and looking for correlated delayed events. The absolute number of random coincidences is obtained by multiplying this probability with the measured number of single prong neutrino reactions. Hence the amount of this background can also be monitored online and is determined from the very same dataset scanned for neutrino oscillations.
4.4 Intrinsic contamination
The only background source which can not be directly extracted from the data is the contamination of the neutrino source with produced in the – decay chain. Detailed Monte Carlo simulations [6] including a three–dimensional model of the ISIS target are used to obtain the fraction of and decaying before they are captured by the nuclei of the target materials. The lifetimes of the depend on the target materials and are generally shorter than the decay time. This effect as well as the shape of the energy spectrum has been included into the calculation of the expected number of e+ events generated by the contamination.
In Table 1 the individual contributions of the above described background sources are summarized.
| background contribution | events |
|---|---|
| cosmic induced sequences | 0.640.06 |
| ISIS contamination | 0.560.09 |
| induced random coincidences | 0.720.04 |
| (e-,e+) from 12C ( , e- ) 12Ng.s. | 0.960.05 |
| total background | 2.880.13 |
| signal for | 81189 |
Note that the absolute number of expected background events is very precise. With these reliable background contributions including the detailed knowledge of the spectral distributions it is possible to optimize the cuts applied to the data without using any information about the actually measured result.
5 OPTIMIZATION OF EVALUATION CUTS
This section shows how we obtained optimal cuts for the search for oscillations independently from the measured result. Second, we show that if we ignore the information of the new veto counter, which corresponds to the KARMEN1 experimental situation, and loose the optimized evaluation cuts we find background events in the neutrino window in good agreement with the measured background expectation.
As the true values of the oscillation parameters and are not known we chose to maximize the sensitivity of the experiment, i.e. we optimized the experiment to deliver the most stringent upper limit on assuming that there are no neutrino oscillations in the sensitive range of KARMEN. Therefore the maximum sensitivity is equivalent to a minimal upper limit on for a fixed . Thus we calculated for every possible evaluation interval the ratio of the expected number of oscillation events for maximal mixing and the upper limit with confidence level on the number of oscillation events that one would get for the measuring interval :
| (3) |
The optimal measuring interval is the one with maximal . In order to make this procedure independent of the result of the measurement the upper limit was chosen to be the mean expected upper limit obtained by summing up all possible upper limits weighted with the poisson probability of such a result:
| (4) |
Here is the upper limit for measured events with expected background events (a zero oscillation signal was assumed). The mean upper limit does not only depend on but also on the absolute number of expected oscillation events and therefore on the measuring time. We varied the cuts with respect to the following observables: the energy of the prompt event , the time of the prompt event , the energy of the delayed event and the time difference between delayed and prompt event .
All cuts show a rather strong dependence on and change with the expected number of oscillation events, i.e. with increasing measuring time. Motivated by the result of the LSND experiment [12] we chose to be most sensitive to value of resulting in the cuts given in section 3.
To test the ability of KARMEN2 to measure events with a signature similar to that of the expected induced events within the appropriate time window we ignored the information provided by the additional third layer of veto counters. If one accepts events with an additional veto hit one obtains a background situation similar to that of KARMEN1 dominated by cosmic ray induced neutron background. Moreover somewhat looser cuts on the prompt energy MeV, prompt time s, energy of the delayed event MeV and difference between time of delayed and prompt event s were used. These cuts provide a good efficiency for muon induced neutron background. The number of measured events in the very same dataset used for the neutrino oscillation evaluation is 39. The expected background of events is dominated by cosmic induced background sequences. Fig. 4 shows energy and time distributions of the measured events compared to the expected background. The very good agreement demonstrates once again the precise knowledge of the background sources and the ability of KARMEN2 to detect events with a signature similar to that of the expected oscillation events.
6 CONCLUSION AND OUTLOOK
We have detected no –like sequence in the KARMEN2 data so far. The knowledge of the significantly reduced background situation after the upgrade in KARMEN2 is precise and reliable. This is important because in the unified approach the upper limit for an oscillation signal depends on the number of expected background events even in the case of a zero result.
Our result is obtained by a frequentist approach providing full coverage which was recently adopted by the Partice Data Group [13]. Of course one has to keep in mind the true meaning of 90% confidence intervals and that the obtained upper limit is due to change (it can even become less stringent) during the ongoing measuring time of KARMEN2. This is an unavoidable feature of an analysis based on such small event samples. However, the result obtained can indeed be used to infer physical implications concerning the result of the LSND collaboration which in fact shows only a ’favoured region’ but not a detailed 90% confidence level area.
References
-
[1]
KARMEN collaboration:
B. Armbruster, M. Becker, G. Drexlin, V. Eberhard, K. Eitel, H. Gemmeke, T. Jannakos, M. Kleifges, J. Kleinfeller, C. Oehler, P. Plischke, J. Rapp, M. Steidl, J. Wolf, B. Zeitnitz: Institut für Kernphysik I, Forschungszentrum Karlsruhe, Institut für experimentelle Kernphysik, Universität Karlsruhe, Postfach 3640, D-76021 Karlsruhe, Germany;
B.A. Bodmann, E. Finckh, S. Haug, J. Hößl, P. Jünger, W. Kretschmer, I. Stucken: Physikalisches Institut, Universität Erlangen-Nürnberg, Erwin Rommel Straße 1, D-91058 Erlangen, Germany;
C. Eichner, R. Maschuw, C. Ruf: Institut für Strahlen- und Kernphysik, Universität Bonn, Nußallee 14-16, D-53115 Bonn, Germany;
I.M. Blair, J.A. Edgington: Physics Department, Queen Mary and Westfield College, Mile End Road, London E1 4NS, United Kingdom;
N.E. Booth: Department of Physics, University of Oxford, Keble Road, Oxford OX1 3RH, United Kingdom - [2] B. Zeitnitz et al., Prog. Part. Nucl. Physics 40, 169 (1998).
- [3] B. Armbruster et al., Phys. Rev. C 57, 3414 (1998).
- [4] R. Maschuw et al., Prog. Part. Nucl. Physics 40, 183 (1998).
- [5] B. Armbruster et al., Phys. Rev. Lett. 81, 520 (1998).
- [6] R.L. Burman et al., Nucl. Instr. Meth. A 368, 416 (1996).
- [7] G. Drexlin et al., Prog. Part. Nucl. Physics 40, 193 (1998).
- [8] G.J. Feldman and R.D. Cousins, Phys. Rev. D 57, 3873 (1998).
- [9] L. Borodovsky et al., Phys. Rev. Lett. 68, 274 (1992).
- [10] A. Romosan et al., Phys. Rev. Lett. 78, 2912 (1997)
- [11] B. Achkar et al., Nucl. Phys. B 434, 503 (1995).
- [12] C. Athanassopoulos et al., Phys. Rev. C 54, 2685 (1996); D.H. White, these proceedings
- [13] C. Caso et al. (PDG), The European Physical Journal C3, 1 (1998)