Vulcano Workshop 1998
May 25-30, Vulcano, Italy
MEASUREMENT OF THE ATMOSPHERIC NEUTRINO
INDUCED MUON FLUX WITH THE MACRO DETECTOR
PAOLO BERNARDINI for the MACRO Collaboration 111 The complete collaboration list is given in the paper by G. Battistoni in these Proceedings.
DIPARTIMENTO di FISICA dell’UNIVERSITÀ and INFN
via per Arnesano, 73100 Lecce, Italy
Abstract
The flux of neutrino-induced muons has been measured with the MACRO detector. Different event topologies have been detected, due to neutrino interactions in the apparatus and in the rock below it. The upward-throughgoing muon sample is the larger one and is generated by neutrinos with an average energy of . The observed upward-throughgoing muons are fewer than expected and the zenith angle distribution does not fit with the expected one. Assuming neutrino oscillations, both measurements suggest maximum mixing and of a few times . The other event categories due to interactions of low-energy neutrinos (average energy ) have been recently studied and the results of these new analyses are presented for the first time at this workshop. These data show a regular deficit of observed events in each angular bin, as expected assuming neutrino oscillations with maximum mixing, in agreement with the analysis of the upward-throughgoing muon sample.
1 Introduction
The interest in precise measurements of the flux of neutrinos produced in cosmic ray cascades in the atmosphere has been growing over the last years due to the anomaly in the ratio of contained muon neutrino to electron neutrino interactions. The observations of Kamiokande (Hirata et al., 1992), IMB (Casper et al., 1991; Becker-Szendy et al., 1992) and Soudan 2 (Allison et al., 1997) are now confirmed by those of SuperKamiokande (Fukuda et al., 1998) and the anomaly finds explanation in the scenario of neutrino oscillation.
The effects of neutrino oscillation have to appear also in the higher energy ranges, as reported by MACRO. The flux of muon neutrinos in the energy region from a few up to hundreds of can be inferred from measurements of upgoing muons (Ahlen et al., 1995, Ambrosio et al., 1998, 2nd reference). As a consequence of oscillation, the flux of upgoing muons should be affected both in the absolute number of events and in the shape of the zenith angle distribution, with relatively fewer observed events near the vertical than near the horizontal due to the longer pathlength of neutrinos from production to observation near the zenith.
Furthermore the flux of atmospheric muon neutrinos in the region of a few can be studied looking at muons produced inside the detector and muons externally produced and stopping inside it. If the atmospheric neutrino anomalies are the result of neutrino oscillations, it is expected a reduction in the flux of upward-going low-energy atmospheric neutrinos of about a factor of two, but without any distortion in the shape of the angular distribution.
Here the measurement about high energy muon neutrino flux is presented, together with first results on low-energy neutrino events in MACRO.
2 The MACRO detector
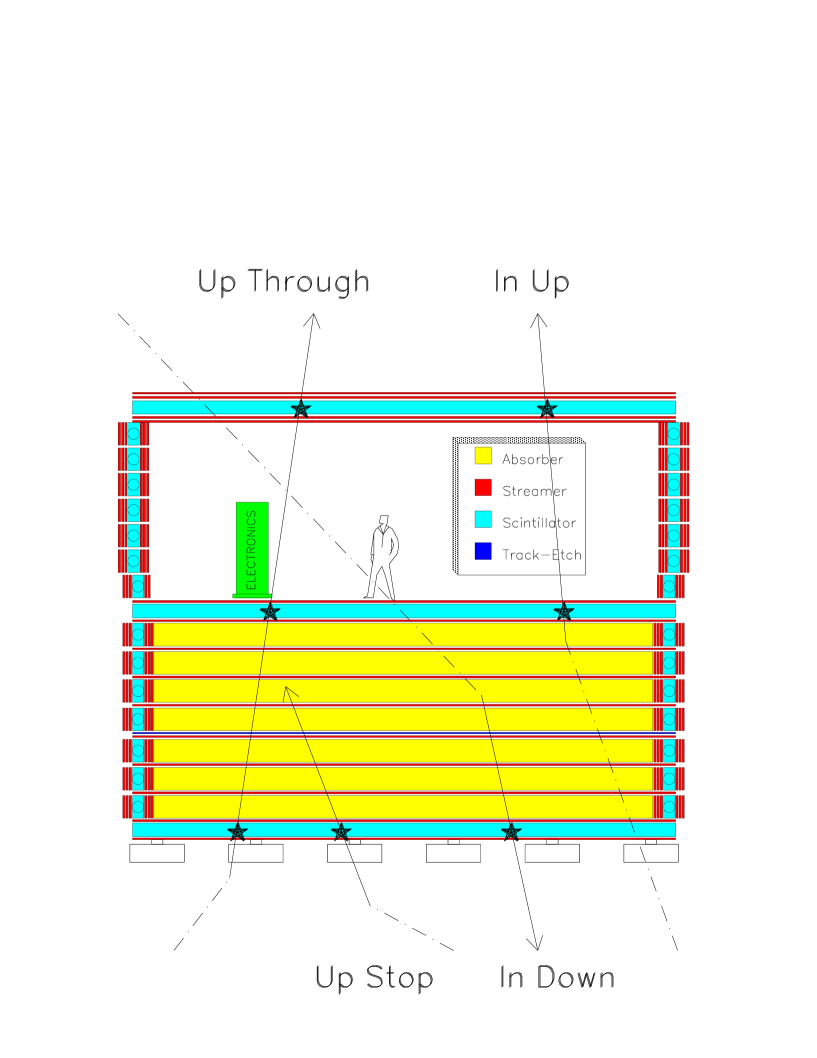
The MACRO detector (Ahlen et al., 1993) is located in the Gran Sasso Laboratory, with a minimum rock overburden of . It is a large rectangular box () divided longitudinally in supermodules and vertically in a lower and an upper part, called attico. The active elements (see Fig. 1) are liquid scintillator counters for time measurement and streamer tubes for tracking, with stereo strip readouts. The lower half of the detector is filled with trays of crushed rock absorber alternating with streamer tube planes, while the attico is hollow and contains the electronics racks and work areas. The intrinsic angular resolution for muons typically ranges from to depending on the track length. This resolution is lower than the angular spread due to multiple scattering of muons in the rock. The scintillator system consists of horizontal and vertical layers. Time and position resolution for muons in a scintillator box are about and , respectively.
Thanks to its large area, fine tracking granularity and electronics symmetry with respect to upgoing and downgoing flight direction, the MACRO detector is a proper tool for the study of upward-travelling muons, generated by external interactions. Its mass permits also to collect a statistically significant number of neutrino events due to internal interactions.
3 Neutrino events in MACRO
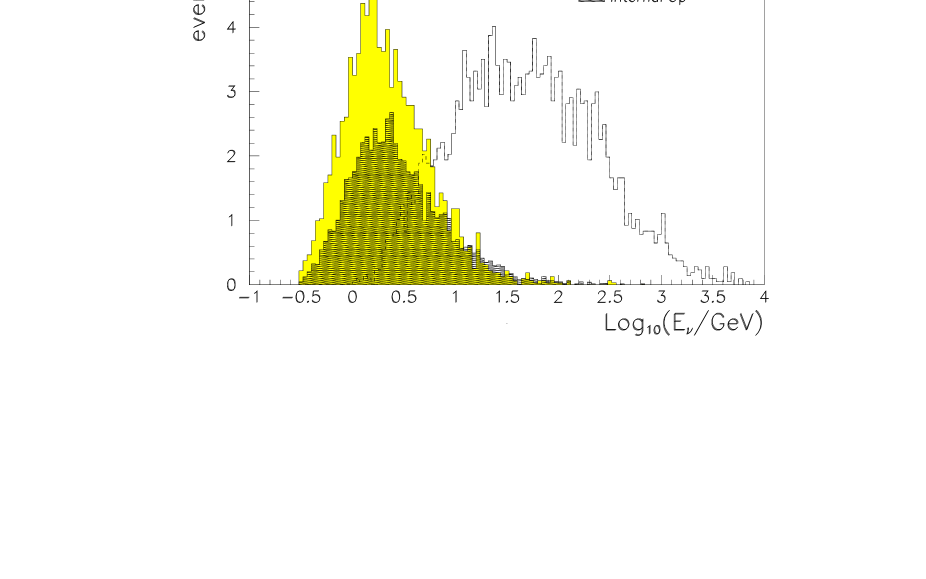
Fig. 1 displays the different kinds of neutrino events here analyzed. Most of the detected particles are muons generated in Charged Current interactions. Figure 2 shows the parent neutrino energy distribution for the different event topologies :
-
1.
Up Through - These tracks come from interactions in the rock below MACRO and cross the whole detector (). The time information provided by scintillator counters permits to know the flight direction (time-of-flight method). The data have been collected in three periods, with different detector configurations. In the first two periods (March 1989 – November 1991, December 1992 – June 1993) only lower parts of MACRO were working (Ahlen et al., 1995). In the last period (April 1994 – November 1997) also the attico was in acquisition.
-
2.
In Up - These partially contained events come from interactions inside the apparatus. Also in this case the time-of-flight method is applied to identify the events, thanks to the attico scintillator layers. Hence only the data collected with the attico (live-time years) have been used in this analysis. About of events are estimated to be induced by Neutral Currents or CC interactions.
-
3.
Up Stop + In Down - This sample is composed by two subsamples : external interactions with upward-going track stopping in the detector (Up Stop), neutrino-induced downgoing tracks with vertex in lower part of MACRO (In Down). These events are identified by means of topological criteria. The lack of time information prevents to distinguish the two subsamples. Anyway an almost equal number of Up Stop and In Down is expected if neutrinos do not oscillate. Neutral Currents and CC interactions constitute of the sample. The analyzed data have been collected with the whole detector with an effective live-time of years.
4 Analysis procedure and results
The time-of-flight method uses the formula
| (1) |
where and are the times measured in lower and higher scintillator planes, respectively, and is the path between the two scintillators. Therefore results roughly for downgoing tracks and for upgoing tracks. Several cuts are imposed to remove backgrounds from radioactivity and showering events which may cause failure in time reconstruction. Another cut is applied to the Up Through sample requiring the crossing of at least of material in the apparatus in order to reduce the background due to low-energy charged upgoing particles produced at large angles by downgoing muons (Ambrosio et al., 1998). After all analysis cuts the signal peaks with are well isolated for the first two samples (see Fig. 3).


The Up Stop + In Down events are identified via topological constraints. The main requirement is the presence of a reconstructed track crossing the bottom scintillator layer. All the track hits must be at least far from the supermodule walls. The criteria used to verify that the event vertex (or stop point) is inside the detector are similar to those used for the In Up search. The probability that an atmospheric muon produces a background event is negligible. To reject ambiguous and/or wrongly tracked events which survived automated analysis cuts, real and simulated events were randomly merged and directly scanned with the MACRO Event Display.
Expected rates and angular distributions have been estimated assuming the atmospheric flux calculated by the Bartol group (Gaisser and Stanev, 1995, Agrawal et al., 1996). The estimate of cross-section was based on parton set from (Morfin and Tung, 1991), taking into account also low-energy effects (Lipari et al., 1995) for In Up and Up Stop + In Down samples. The propagation of muons through the rock was taken from (Lohmann et al., 1985). The uncertainty on the expected muon flux is estimated for Up Through events and for the other events. The apparatus and the data acquisition are fully reproduced in a GEANT (Brun et al., 1992) based Monte Carlo program and the simulated data are processed by means of the same analysis chain used for real data. Particular care has been taken to minimize the systematic uncertainty in the detector acceptance simulation. For the Up Through sample, several different analyses and acceptance calculations, including separate electronic and data acquisition systems, have been compared. For each sample, trigger and streamer tube efficiency, background subtraction, effects of analysis cuts have been in detail studied. The systematic error on the total number of events due to the acceptance has been estimated for Up Through sample. The uncertainty is higher () for low-energy samples because it depends strongly on data taking conditions, analysis algorithm efficiency and mass of the detector.
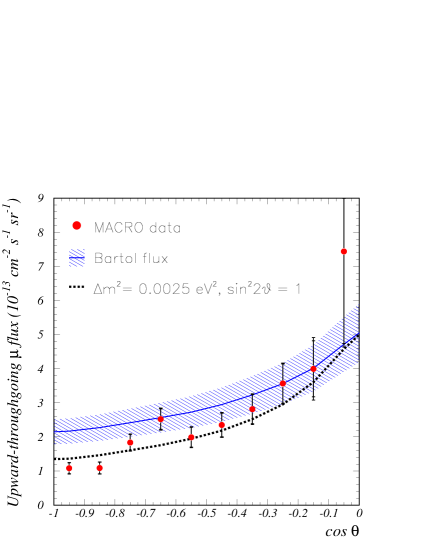
In the Up Through sample 479 events are in the signal range ( around ). After the subtraction of the estimated backgrounds, the observed number of events becomes . For this sample events are expected and the ratio observation/expectation is reported in Table 1. Fig. 4 shows the zenith angle distribution of the measured flux compared with the expectation. The error bars on the data show the statistical errors with an extension due to the systematic errors, added in quadrature. The observed zenith distribution does not fit well with the expectation, giving a maximum probability of only . The observed number of events and the shape of the zenith distribution can be explained in the scenario of oscillation with a best fit point in the unphysical range (). Both measurements independently yield very close mixing parameter values. The second plot in Fig. 4 shows the best fit point in the physical region ( and ) obtained combining event number and angular shape analysis. The probability associated to this point is not so high () because the probability of the zenith distribution is still low (), due to the relatively few events in the region compared with the number of events in . In the second plot of Fig. 4 the solid lines show the contours for and of the best fit probability. The dashed lines show the allowed regions at and c.l. evaluated according to the prescription by (Feldman and Cousins, 1998). The dotted line shows the sensitivity which is the c.l. contour which would result from the preceding prescription if the data and the M.C. prediction happened to be in perfect agreement at the best fit point.
| Topology | Ratio | Statist. | Syst. | Theor. | Ratio with |
|---|---|---|---|---|---|
| error | error | error | oscillation | ||
| Up Through | 0.74 | 0.036 | 0.046 | 0.13 | 1.05 |
| In Up | 0.59 | 0.06 | 0.06 | 0.15 | 1.02 |
| Up Stop + In Down | 0.75 | 0.07 | 0.08 | 0.19 | 0.98 |
The ratios of the observed number of events to the expectation and the angular distributions of the In Up and Up Stop + In Down data samples are reported in Table 1 and in Fig. 5. The low-energy samples show an uniform deficit of the measured number of events over the whole angular distribution with respect to the predictions based on the absence of neutrino oscillations. We note a good agreement between the results for low-energy and Up Through events. Assuming the oscillation parameters suggested by higher energy sample, it is expected a disappearance of in In Up and Up Stop samples because of the neutrino path (thousands of kilometres). No flux reduction is instead expected for In Down events whose neutrino path is of the order of tens of kilometres. The ratios and the angular distributions estimated assuming the oscillation are also reported in Table 1 and in Fig. 5.


5 Conclusions
The Up Through sample shows a deficit of the measured number of events with respect to the predictions based on the Bartol flux in absence of neutrino oscillations. The deficit is higher near the vertical direction. Hence the previous results of the MACRO experiment (Ahlen et al., 1995) are confirmed. A new paper about this item has been submitted for pubblication (Ambrosio et al., 1998, 2nd reference).
Also the low-energy neutrino events are fewer than expected and the deficit is quite uniform over the whole angular range. The three data samples are in agreement with a model of oscillation with maximum mixing and of a few times . The combined analysis of the three different data sets is in progress.
6 References
Agrawal, V., Gaisser, T.K., Lipari, P., Stanev, T.: 1996, Phys.Rev. D53, p. 1314.
Ahlen, S., et al. (MACRO Collaboration): 1993, Nucl. Instr. and Methods A324, p. 337.
Ahlen, S., et al. (MACRO Collaboration): 1995, Phys. Lett. B357, p. 481.
Allison, W.W.M., et al. (Soudan Collaboration): 1997, Phys. Lett. B391, p. 491.
Ambrosio, M., et al. (MACRO Collaboration): 1998, Astroparticle Physics 9, p. 105.
Ambrosio, M., et al. (MACRO Collaboration): 1998, hep-ex/9807005.
Becker-Szendy, R., et al. (IMB Collaboration): 1992, Phys. Rev. D46, p. 3720.
Brun, R., et al.: 1992, CERN GEANT User’s Guide DD/EE 84-1.
Casper, D., et al. (IMB Collaboration): 1991, Phys. Rev. Lett. 66, p. 2561.
Feldman, G.J., Cousins, R.D.: 1998, Phys. Rev. D57, p. 3873.
Fukuda, Y., et al. (SuperKamiokande Collaboration): 1998, hep-ex/9807003
Gaisser, T.K., Stanev, T.: 1995, Proceedings of the 24th ICRC (Rome), vol. 1, p. 694.
Hirata, K.S., et al. (Kamiokande Collaboration): 1992, Phys. Lett. B280, p. 2.
Lipari, P., Lusignoli, M., Sartogo, F.: 1995, Phys. Rev. Lett. 74, p. 4384.
Lohmann, W., Kopp, R., Voss, R.: 1985, CERN-EP 85-03.
Morfin, J. G., Tung, W. K.: 1991, Z. Phys. C52, p. 13.