UTEXAS-HEP-98-13
A Compact Beam Stop for a Rare Kaon Decay Experiment
J. Belza,1, M. Diwanb,2, M. Eckhausec, C.M. Gussa,3, A.D. Hancockc, A.P. Heinsond,4, V.L. Highlanda,5, G.W. Hoffmanne, G.M. Irwinb, J.R. Kanec, S.H. Kettella,2, Y. Kuangc,6, K. Lange, J. McDonoughe,7, W.K. McFarlanea,8, W.R. Molzond, P.J. Rileye, J.L. Ritchiee, A.J. Schwartzb,9, B. Waree,10, R.E. Welshc, R.G. Winterc,5, M. Witkowskic,11, S.G. Wojcickib S.D. Worm∗,e,12, and A. Yamashitae,13
aTemple University, Philadelphia, Pennsylvania 19122
bStanford University, Stanford, California 94309
cCollege of William and Mary, Williamsburg, Virginia 23187
dUniversity of California, Irvine, California 92717
eUniversity of Texas, Austin, Texas 78712
Abstract
We describe the development and testing of a novel beam stop for use in a rare kaon decay experiment at the Brookhaven Alternating Gradient Synchrotron. The beam stop is located inside a dipole spectrometer magnet in close proximity to straw drift chambers and intercepts a high-intensity neutral hadron beam. The design process, involving both Monte Carlo simulations and beam tests of alternative beam-stop shielding arrangements, had the goal of minimizing the leakage of particles from the beam stop and the resulting hit rates in detectors, while preserving maximum acceptance for events of interest. The beam tests consisted of measurements of rates in drift chambers, scintillation counter hodoscopes, a gas threshold Cherenkov counter, and a lead glass array. Measurements were also made with a set of specialized detectors which were sensitive to low-energy neutrons, photons, and charged particles. Comparisons are made between these measurements and a detailed Monte Carlo simulation.
∗Corresponding author.
Email: worm@fnal.gov.
Phone: (630)840-5011.
1Present address: Rutgers University, Piscataway, NJ 08855.
2Present address: Brookhaven National Laboratory,
Upton, NY 11973.
3Present address: Cornell University, Ithaca, NY 14853.
4Present address: University of California,
Riverside, CA 92521.
5Deceased.
6Present address: Lucent Technologies, Naperville, IL 60566.
7Present address: University of Pennsylvania
Medical Center, Philadelphia, PA 19104.
8Present address: Norfolk State University, Norfolk, VA 23504.
9Present address: University of Cincinnati, Cincinnati,
OH 45221-0011.
10Present address: Caltech, Pasadena, CA 91125.
11Present address: Rensselaer Polytechnic Institute, Troy,
NY 12180.
12Present address: Univerisity of New Mexico, Albuquerque,
NM 87131.
13Present address: Spring-8, Hyogo 678-12, Japan.
Submitted to Nuclear Instruments and Methods.
1 Introduction
Hadronic interactions create difficult shielding problems in a variety of experimental environments. Absorbers, ranging from calorimeters to passive beam dumps, may be located close to detectors whose performance can be degraded by leakage of charged particles, neutrons, or photons. Obtaining reliable a priori estimates of the leakage can be important in the design of an experiment. Minimizing leakage under circumstances where the size, shape, and position of the absorber are imposed by other considerations may be a goal in the design of the absorber.
In the rare decay Experiment 871 [1] at the Alternating Gradient Synchrotron (AGS) of the Brookhaven National Laboratory (BNL), we have addressed the problem of designing a beam stop for a high intensity multi-GeV neutral hadron beam. The location of the beam stop inside the E871 spectrometer within a few centimeters of tracking chambers, combined with the fact that the transverse dimensions of the beam stop were tightly constrained by the requirement of maintaining good geometrical acceptance for decays, made this a challenging task.
The beam stop design proceeded in three basic steps: (1) a preliminary design was arrived at based on general features of hadronic cascades and on rudimentary simulations of different shielding options [2]; (2) extensive beam tests were performed to evaluate various trade-offs in the design; and (3) detailed simulations were performed and compared to the beam test measurements [3], and were used to further optimize the beam stop design. The resulting design relies on a dense core of tungsten alloy (“heavimet”) surrounded by multiple layers of different materials to degrade, thermalize, and capture neutrons, and then to absorb the resulting photons. A re-entrant tunnel reduces the backwards-going leakage. BNL E871 has subsequently completed successful physics runs in 1995 and 1996.
This paper describes the design process, beam tests, and Monte Carlo simulations that produced a satisfactory beam stop design. Section 2 describes BNL E871 in more detail and explains the motivation for placing a beam stop inside the spectrometer. Section 3 discusses the general considerations leading to the basic features of the beam stop design. Section 4 describes the beam tests performed to study the leakage from the beam stop and its effect on nearby particle detectors (including drift chambers, scintillation counters, a gas threshold Cherenkov counter, and a lead glass calorimeter). Section 5 describes the Monte Carlo simulations performed to study the beam stop and Section 6 compares the Monte Carlo results to data. Section 7 summarizes the lessons from this work.
2 BNL E871
The goal of BNL E871 is to search for the dilepton decay modes of the long-lived neutral kaon , such as , , and , with single event sensitivity near 10-12. Our earlier experiment, BNL E791 [4], achieved a single event sensitivity close to for these modes, observed over 700 events, and set upper bounds on the other two modes. In order to design an experiment with an order of magnitude improvement in sensitivity, we had to sample a much larger number of decays and at the same time improve background rejection.
A larger sample of decays was made possible by using a more intense primary proton beam (which became available with the construction of the AGS Booster), by increasing the length of the decay volume, and by increasing the aperture of the spectrometer. However, operating under these more challenging conditions required a more efficient trigger to relieve the load on the data acquisition system. A classical way to make a selective trigger for two-body decays exploits the two-body kinematics by arranging the magnetic field(s) in the spectrometer so the two charged daughters exit the field region with trajectories approximately parallel to the direction of the parent. We adopted this general concept owing to its simplicity.
Excellent background rejection requires excellent resolution for the reconstructed invariant mass of the observed dilepton pair, which in turn requires relatively strong magnetic fields to achieve the required momentum resolution. In addition, rejecting the background from where the pion decays to a muon inside a spectrometer magnet is greatly improved by using two spectrometer magnets in sequence (to allow comparison of two independently measured momenta). Since a transverse momentum () kick of only 220 MeV/c is required to produce the desired parallelism, two magnets of the same polarity in sequence would each need -kicks of 110 MeV to achieve this condition, but would operate with rather low fields and fail to satisfy our resolution requirement. Therefore, a configuration with two magnets of opposite polarity is more desirable. In view of the magnets available at the time we were planning E871, a configuration with a MeV/c -kick followed by a MeV/c kick seemed attractive. This configuration, for those events which exit parallel, deflects the charged daughters inward (toward the beam) in the first magnet and outward (to parallel) in the second magnet, making a so-called “in-bend” event. The alternative configuration with the smaller -kick first would result in parallel events which were “out-bends”. This was less attractive because the size of the detector downstream of the magnets would have had to be larger and the mass resolution would have been poorer (accepted events would have had smaller opening angles between the decay products than in the in-bend case, resulting in larger relative uncertainty in the opening angle).
A potential drawback of this preferred configuration is that downstream of the magnets a significant fraction of the daughter particles wind up close to the beam volume or even inside it, making their detection problematical. A salient feature of these events is that the particles pass through the first magnet well outside the beam, leaving a zone through which no particles of interest pass. Because of this feature, a compact beam stop placed in this zone can, in principle, clean up the downstream environment with only small loss of acceptance. Consequently, a constraint on the width of the beam stop (about 40 cm) is imposed by the need to maintain good acceptance. By eliminating the neutral beam, it not only becomes possible to detect the particles in that region, but additional improvement in background rejection can result from the more reliable particle identification which is possible in the lower rate environment created downstream of the beam stop. The reduced rates come about because there are no longer decays along the entire length of the experiment, nor the inevitable scraping of tails of the neutral beam on detector frames.
Thus we were led to consider a compact beam stop in the neutral beam inside the first spectrometer magnet in E871. However, it was clear that a penalty would result in the form of higher rates in nearby detectors, owing to leakage from the beam stop. A priori it was not clear whether the penalty would be prohibitive. A first attempt to address this was made at the end of the 1990 run of E791 in a short beam test using a beam stop composed of lead bricks surrounded by polyethylene. This naive design generated unacceptably high rates, but did not discourage us from an effort to build an optimal beam stop. The effort spanned two years and involved both beam tests and Monte Carlo simulations.
E871 resides in the B5 neutral beam at the AGS. The neutral beam is produced by 24 GeV/c protons in a 12 cm long platinum target with mm2 transverse dimensions. A series of magnets, lead foils, and collimators convert photons and sweep away the resulting charged particles, leaving a neutral beam with a solid angle of mrad2 (the larger dimension is the vertical). The centerline of the neutral beam is oriented at 3.75 degrees relative to the proton beam. The design intensity for E871 is protons on target over a one second spill, which provides a flux of about per spill. Hereafter we will adopt the unit Tp for incident proton flux, where 1 Tp = protons on target, so that our design intensity was 15 Tp.
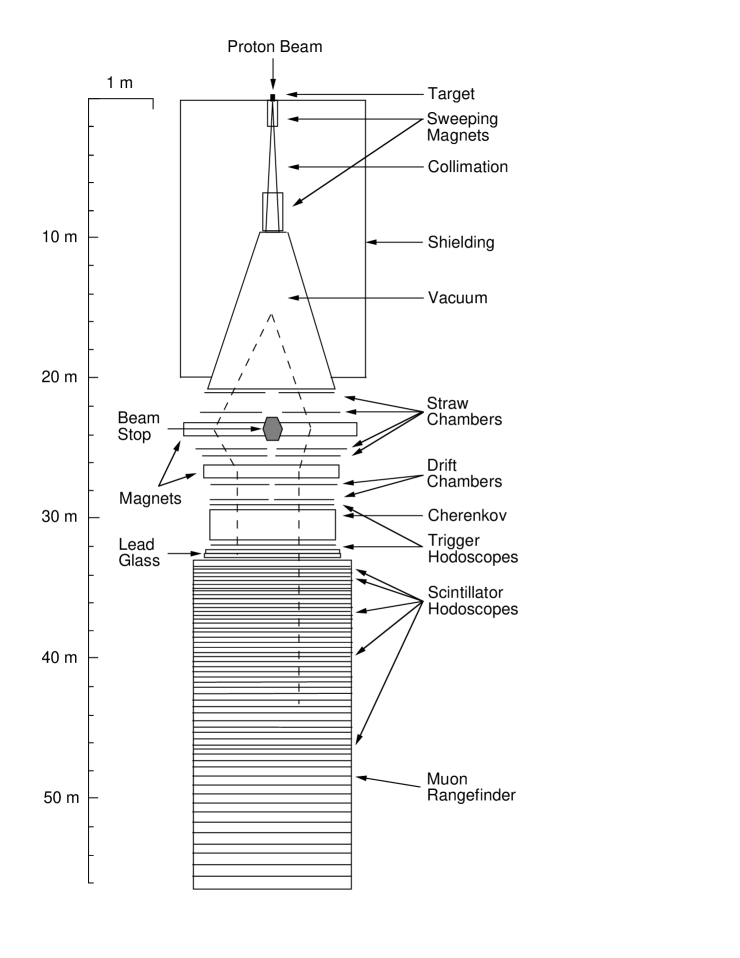
The E871 spectrometer, shown in Fig. 1, consists of a tracking section followed by scintillator hodoscopes and particle identification detectors. The tracking section consists of two consecutive dipole magnets and six planes of tracking chambers. The beam stop is located in the more upstream of the two dipole magnets. The four tracking chamber planes nearest the beam stop consist of 5 mm diameter straw drift chambers [5] (two pairs of straw chambers precede the beam stop and two pairs follow it), operated with a fast CF4-based drift gas [6]. Two planes of conventional drift chambers with 1 cm pitch follow the second dipole magnet. The magnets are run with opposite polarities tuned to provide a net kick of about 220 MeV, as described earlier. A pair of scintillation counter hodoscopes, separated by 2.8 m, follow the tracking section and are the basis for a first level hardware trigger which requires the two-track parallelism described earlier. Particle identification is provided by an atmospheric hydrogen threshold Cherenkov counter located between the trigger hodoscopes, a lead glass array following the final trigger hodoscope, and finally an instrumented absorber to track muons and measure their range. Data from detectors are digitized in custom high speed front-end electronics modules before being fed through a massively parallel readout system into a farm of eight RISC processors, where events were selected in software for permanent storage.
We are aware of one other fixed-target detector, that of Fermilab experiment 605 [7], which utilized a beam stop in a somewhat similar arrangement. E605 searched for high-mass dimuon pairs and high hadrons in proton-nucleus collisions. In that experiment a beam dump inside a large dipole magnet was well separated from active detectors. More recently, Fermilab experiments 772 and 866 have carried forward substantially the same arrangement.
3 General Considerations for the Beam Stop Design
A preliminary design for the beam stop was based on general considerations, supplemented by Monte Carlo simulations. Placing the beam stop inside the first spectrometer magnet limits its length to 260 cm. Because it is located inside a magnet, it should be constructed of nonmagnetic materials in order to avoid distorting the magnetic field. Also, the forces on magnetic materials would have required a more complicated mechanical design. The width of the beam stop is limited by the need to maximize acceptance for two-body decays.
The beam stop needs a central high-density core with a short hadronic interaction length in order to concentrate the major fraction of the hadronic cascade in a small volume. This assures that most of the particles produced in the development of the hadronic cascade will either interact or be ranged out before reaching the periphery of the beam stop. In addition, such material helps to minimize the number of decays of secondary pions to muons. The inelastic collisions that are required to stop the incident neutrons produce a large number of low energy protons, neutrons, and photons as the target nuclei release the energy absorbed in the collisions. Protons and photons have short ranges in the dense hadronic absorber, but the low energy neutrons, with energies around 1 MeV, can have long interaction lengths and tend to lose little energy in each interaction.
Candidate materials for the dense core were tungsten and depleted uranium because of their short nuclear interaction lengths. Tungsten has a nuclear interaction length of 9.6 cm and the added benefit of a large inelastic neutron cross section down to 1 MeV. Depleted uranium has a slightly longer nuclear interaction length, 10.5 cm, but is less expensive. It also has a large inelastic neutron cross section, although much of this is due to fission processes which produce additional low energy neutrons. A study of neutron leakage using the HETC hadronic cascade Monte Carlo and MORSE neutron transport code, which are part of the CALOR89 [8] package, indicated that approximately a factor of three more low-energy neutrons would escape from a beam stop consisting of a uranium core surrounded by two inches of polyethylene than from a beam stop consisting of a tungsten core equivalently shielded. Tungsten was chosen for the core material. Because tungsten is expensive, it was supplemented with copper in some regions to provide additional attentuation of the hadronic shower at a lower cost.
It is necessary to thermalize and capture the neutrons which escape from the core material. The most effective method to thermalize low energy neutrons is elastic scattering on free protons (for example, in a hydrogen-dense material such as polyethylene). Once thermalized, the neutrons are usually captured by a nucleus, a process that often results in the production of a photon with energy in the MeV range. For example, neutron capture on hydrogen produces a 2.2 MeV photon through the process 1H()2H (i.e., ). Photons with this energy are difficult to stop; the attenuation length in lead is approximately 2 cm. By doping the hydrogen-dense thermalizing material with boron or lithium, one can cause the neutron to be captured in a reaction that produces a lower energy photon, such as 10B()7Li∗, or no photon, such as 6Li()3H. The boron reaction 10B()7Li∗ emits a 0.477 MeV photon, which has an attenuation length of about 0.5 cm in lead, making its absorption more practical. In both cases the range of the -particle is very short so it does not escape the beam stop.
Several materials were considered for the parts of the beam stop that moderate the secondary neutrons. Pure polyethylene has a very high hydrogen concentration but generates many 2.2 MeV photons, as discussed above. Borated polyethylene retains most of the hydrogen density while generating photons that are easier to attenuate. Lithium-doped polyethylene generates no photons but has a much lower hydrogen density, so it is less effective at thermalizing neutrons. We attempted to optimize the design by utilizing different types of polyethylene in different locations. For instance, in our design the polyethylene along the sides of the heavimet core was only slightly borated (0.5%), in order to maintain high hydrogen density. Thin sheets of a highly borated material surrounded this type of polyethylene. To absorb the photons from neutron capture reactions, a layer of lead lined the outside of the beam stop.
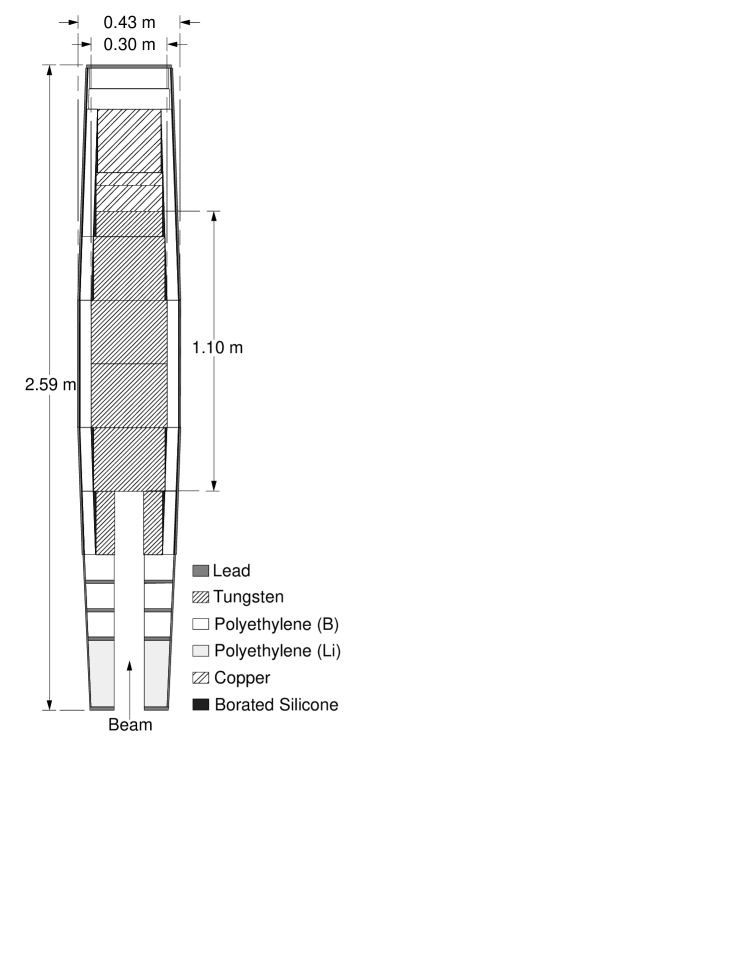
The preliminary beam stop design is shown in Fig. 2. It consisted of a nonmagnetic heavimet core (94% tungsten, 10.1 cm interaction length), 30.3 cm wide at its widest point and 110 cm long. The heavimet core was 70 cm high and had 7.8 cm of copper plus 12.7 cm of polyethylene above and below it. The heavimet consisted of about 200 machined bricks, in a range of sizes, that were manually stacked into place. Downstream of the heavimet was 41 cm of copper and 20 cm of polyethylene. At the upstream end, there was a tunnel that the neutral beam entered before striking the tungsten core. Heavimet formed a 25 cm long portion of the tunnel. The tunnel was extended further upstream by a 12 cm wide 50 cm high 50 cm long section made of 5% borated polyethylene with layers of 1.3 cm thick lead and a section of lithium-doped polyethylene. The sides of the heavimet core were covered with 4.5 cm thick 0.5% borated polyethylene. On both sides of the polyethylene were 3 mm sheets of FLEX/BORON [9], a highly borated (25%) silicone material. Finally, 0.64 cm of lead formed the outer layer of the beam stop. The compositions of the materials used in the beam stop, which in the final design also included borated zirconium hydride polyethylene, are given in Table 1.
| Material | Density | Elemental | |
| (g/cm3) | Composition | (%) | |
| Tungsten Heavimet | 17.95 | Tungsten | 94.20 |
| Nickel | 4.35 | ||
| Iron | 0.85 | ||
| Cobalt | 0.50 | ||
| Copper | 0.10 | ||
| ‘Stiff’ Lead | 11.4 | Lead | 97. |
| Antimony | 3. | ||
| Copper | 8.96 | Copper | 99.9 |
| Borated Zirconium | 3.67 | Zirconium | 85.0 |
| Hydride Polyethylene | Carbon | 8.9 | |
| Hydrogen | 3.4 | ||
| Oxygen | 2.2 | ||
| Boron | 0.5 | ||
| FLEX/BORON | 1.64 | Silicon | 26.9 |
| Boron | 25.4 | ||
| Oxygen | 24.2 | ||
| Carbon | 20.1 | ||
| Hydrogen | 2.8 | ||
| Lithiated Poly | 1.06 | Carbon | 83.7 |
| Hydrogen | 8.8 | ||
| Lithium | 7.5 | ||
| Borated Poly, 0.5% | 0.84 | Carbon | 83.1 |
| Hydrogen | 14.2 | ||
| Oxygen | 2.2 | ||
| Boron | 0.5 | ||
| Borated Poly, 5.0% | 0.93 | Carbon | 61.2 |
| Oxygen | 22.2 | ||
| Hydrogen | 11.6 | ||
| Boron | 5.0 |
4 Beam Tests
A series of beam tests were performed during both the 1991 and 1992 AGS running periods to study various trade-offs in the beam stop design and ultimately to assess the viability of this aspect of E871. The tests were conducted in the actual neutral beamline planned for the experiment (AGS B5), which was the same beamline used by our previous experiment E791. At that time the full E791 spectrometer was still intact. During the 1991 run, when the most extensive tests were performed (including those for which data are reported here), the proton beam was incident on a copper target at a 2.75 degree production angle rather than the final E871 configuration (a platinum target at 3.75 degrees).
The increase in targeting angle reduced the total hadron flux (mostly neutrons), while preserving most of the kaon flux. While this effect is expected, it was also clearly visible in our data. We were able to study the angular distribution of hadrons in the beam by studying the position of interactions of beam hadrons in the vacuum window at the end of the decay volume. These interactions were identified by reconstructing the emerging tracks using our drift chambers. The -coordinate of the interaction in the window provided a direct measurement of the production angle, owing to the fact that our beam was formed by dumping the primary protons with a (downward) vertical deflection and because our collimators accepted a narrow horizontal slice but a large vertical range (effectively about 12 mrad centered at 2.75 degrees). Over this 12 mrad range we observed a drop of 36% in the number of window interactions from the bottom (smaller angle) to the top (larger angle). Similarly, we studied the production angle of kaons by reconstructing the vertex position of kaon decays upstream of the vacuum window. Kaon flux was almost flat over this angular range.
Earlier E791 measurements made with the copper target at the 2.75 degree production angle indicated there were roughly neutrons in the beam for every incident protons, with neutral kaons comprising four to eight percent of the hadrons in the beam. The neutron flux estimate [10] was based on foil activation studies and a series of measurements which counted interactions in different thickness absorbers of a few different absorber materials.
The beam stop studies proceeded in several stages. In particular, after the beam stop was partially assembled, hit rates in various detectors were measured. Then, as increments in the assembly were made, the measurements were repeated. Also, in reaction to data analysis that was going on in parallel, additional variations to the beam stop configuration were often tested. In all, measurements were made for about 95 configurations, although many of these amounted to small variations on others. Some preliminary results of these tests have been described previously [11].
During the tests, proton intensities ranged from 0.3 to 2.0 Tp/spill. Three types of measurements were made:
-
•
For all beam stop configurations, we measured the rates in the E791 detectors since those detectors were a reasonably good approximation to the detectors planned for E871. We used a pseudo-random trigger, provided by a pulse generator running at a fixed rate (1 kHz), to collect data from the detector. These triggers, by being independent of the time structure of the beam, provided a means of effectively randomly sampling detector activity. The hit rates in all detectors except the lead glass were calculated from TDC information. The hit rates and the radiation dose in the lead glass were calculated from ADC information.
-
•
For a reduced set of beam stop configurations, we made measurements of the neutron, photon, and charged particle leakage from the beam stop using Bonner spheres, 3He counters, liquid scintillators, and a high purity germanium detector. These detectors used a separate data acquisition system to read out pulse height and timing information for each event. Triggers were generated from signals provided by the detectors themselves. A sample of the events was analyzed in real time to monitor the performance and stability of these detectors. The events were written to tape for offline analysis.
-
•
For the same reduced set of beam stop configurations, we measured rates in a small test drift chamber and four Cherenkov photomultiplier tubes (from the E791 Cherenkov counter), that were shielded with lead and polyethylene. These detectors were read out for the same pseudo-random triggers described above using the E791 data acquisition system.
In the following discussion, we will present results from measurements made in a small selected subset of the tested beam stop configurations. The configurations upon which we focus were chosen primarily because they have significant differences from each other and exhibit the effects of different shielding configurations upon the leakage. A complicating factor in interpreting the results is that interactions of neutral beam particles in air upstream of the beam stop were a significant source of detector rate. The interactions in air were significantly reduced in some configurations by the use of helium bags. As a result, in addition to changes in the beam stop, it was also necessary to pay attention to whether the helium bags were present or absent for a particular configuration. Because of the requirement of practical access to the beam stop, the helium bags were absent for most configurations for which data was taken. For completeness, we include below a configuration which differs from another only with respect to the use of the helium bags, so that the magnitude of the effect of interactions in air can be seen.
The configurations discussed in the remainder of this paper are:
-
1.
A baseline configuration with no beam stop. In particular, this configuration is the normal data-taking configuration of BNL E791 and included the placement of helium bags in all beam regions downstream of the vacuum decay region and between all drift chambers.
-
2.
A purely metallic beam stop. In this configuration, both the tungsten heavimet and copper were installed, but no polyethylene or other neutron degrader or absorber was present. For this configuration, helium bags were not in place.
-
3.
The full preliminary beam stop, as described in the previous section and shown in Fig. 2. Helium bags were not in place.
-
4.
Extra shielding. In this configuration, an additional 2.5 cm of polyethylene was added to the sides of the beam stop and an extra 0.64 cm of lead was added to the outer layer, as compared to the configuration shown in Fig. 2. Helium bags were not in place.
-
5.
Extra shielding with helium bags in place. For this configuration, the beam stop was the same as in configuration 4.
Data in each of these configurations was taken with and without a magnetic field in the region of the beam stop. That is, the dipole magnet in which the beam stop was located was on for about half of the data in each configuration and off for the other half. The magnetic field value was limited to 0.85 T by the power supply available at the time. An additional power supply was added later making it possible to achieve the desired field for E871, which was 1.4 T.
4.1 Beam Flux Monitoring
While it was not necessary to measure the flux in the neutral beam absolutely, it was important to have a relative normalization so that data taken at different times and with different beam stop configurations could be compared. The results described here used two independent normalization methods to compare the rates between different beam stop configurations. The first was based on counting decays in the vacuum decay region, which to an excellent approximation should track the total neutral flux in the beam. This was accomplished by reconstructing two tracks emerging from a common vertex in the data taken with the pseudo-random trigger. Tracks were reconstructed separately in the horizontal (-view) and vertical (-view) planes from the hits in the upstream-most two drift chambers. A vertex, or “V”, was counted if the -position (position along the beam direction) of the vertices calculated independently using the -view and -view tracks coincided within 7 cm. In addition, the coordinates of the intersection point were required to be within the neutral beam volume. The limitation of this normalization method was statistics since typically only about 600 V’s were found in the data for each configuration.
The second normalization method used a triple-coincidence scintillator telescope that viewed the production target at a 90 degree angle. The telescope normalization had small statistical uncertainties, but did not measure the number of secondary particles that were accepted into the solid angle of the experiment. The telescope normalization had a systematic uncertainty of about 20% because of variations in beam steering onto the target.
The V normalization could be used only for data taken with the E791 data acquisition system. Therefore, the specialized neutron and photon detectors had to rely on the telescope normalization. Comparisons of the rates between the two detector systems necessarily used the telescope normalization.
4.2 E791 detectors
While the BNL E791 spectrometer differed in many details from the planned E871 spectrometer, it was nonetheless similar in many respects and provided a powerful tool in studying the effects of the beam stop on particle detectors. The E791 apparatus is shown in Fig. 3. It has been described in more detail elsewhere [4]. The tracking section consisted of two consecutive dipole magnets and five conventional drift chamber planes (two pairs of chambers upstream of the first magnet, one pair between the magnets, and two pairs of chambers downstream of the second magnet). Downstream of the final drift chamber, a finely segmented scintillator hodoscope, a gas threshold Cherenkov counter, another hodoscope, and a lead glass array followed in sequence. A meter of steel was then followed by a scintillator hodoscope for muon identification and an instrumented range stack for muon range measurement. The detector was fully operational during the beam tests of the beam stop. However, in order to permit frequent accesses to both sides of the beam stop, one member of each pair of chambers immediately upstream and downstream of the beam stop were removed, as indicated in Fig. 3 by the dashed lines. In particular, the right-side chamber immediately upstream of the the beam stop and the left-side chamber immediately downstream of the beam stop were not in place for most of our tests.

For all the tests, the upstream E791 dipole magnet was off (i.e., zero field), since it was to be removed for E871. The beam stop was located in the second dipole magnet in the E791 setup. The same magnet in the same location houses the beam stop in E871.
The hit rates in the E791 detectors for the five previously defined beam stop configurations are given in Table 2 for data with the downstream spectrometer magnet both at 0 T (magnet off) and at 0.85 T. Hit rates are given in units of “hits per V”, the number of detector hits normalized to the number of kaon-decay vertices observed in the same data sample. This unit takes into account variations in the incident beam flux and is natural for comparing hit rates between different data sets and beam stop configurations. The conversion to hits per unit time per proton on target can be made by multiplying the hit rate per V by the factor 25,000 Hz/Tp. That is, one hit per V corresponds to approximately 25 kHz per protons on target. However, since the size and number of channels is not the same for each detector shown in Table 2, only comparisons of rates in the same detector for different beam stop configurations are meaningful.
| Beam Stop Configuration | |||||||||||
| Detector | 1 | 2 | 3 | 4 | 5 | 1 | 2 | 3 | 4 | 5 | |
| Magnet Off | Magnet at 0.85 T | ||||||||||
| DC1 | 120 | 180 | 160 | 140 | 140 | 110 | 180 | 160 | 150 | 130 | |
| DC2 | 160 | 370 | 280 | 250 | 170 | 120 | 370 | 280 | 260 | 160 | |
| DC3-left | 220 | 2800 | 1100 | 720 | 520 | 250 | 2600 | 1000 | 800 | 520 | |
| (Beam Stop location) | |||||||||||
| DC4-right | 280 | 2000 | 900 | 600 | 520 | 150 | 1700 | 620 | 490 | 420 | |
| DC5 | 300 | 920 | 430 | 290 | 260 | 190 | 850 | 430 | 300 | 260 | |
| TSC1 | 140 | 820 | 300 | 210 | 190 | 95 | 850 | 310 | 230 | 180 | |
| Cherenkov-right | 33 | 58 | 24 | 18 | 16 | 26 | 56 | 23 | 17 | 13 | |
| TSC2 | 170 | 290 | 120 | 87 | 77 | 140 | 290 | 120 | 89 | 69 | |
| Lead Glass | 140 | 83 | 65 | 65 | 49 | 130 | 72 | 54 | 52 | 37 | |
| MHO | 110 | 84 | 67 | 74 | 53 | 110 | 77 | 59 | 62 | 45 | |
A comparison of hit rates in configuration 2 to configuration 1 shows that the rates in the drift chambers rose sharply after the beam stop was installed, especially in the closest chambers (DC3 and DC4). The increase for the chamber immediately upstream of the beam stop (DC3-left) was more than an order of magnitude. However, in some of the configurations with shielding, hit rates in that chamber are reduced to roughly double the rate with no beam stop. In other detectors, the effects of shielding are even more favorable. The hit rates in the detectors well downstream of the beam stop are quite low compared to the rates with no beam stop. For example, the hit rate in the downstream trigger hodoscope (TSC2) is about half the rate with no beam stop. The effects observed are similar for both magnet-on and magnet-off data. Of course, the magnet-on situation corresponds more closely to the E871 setup.
4.3 Neutron and photon detectors
We used an additional set of detectors to investigate the leakage of neutrons, photons, and charged particles from the beam stop. The neutron detectors were Bonner spheres, 3He counters, and liquid scintillators. The liquid scintillators were also used to measure the photon flux and a high purity germanium detector was used to identify photons from neutron capture. Charged particles were identified by requiring a coincidence between a liquid scintillator and thin plastic scintillators. Owing to physical constraints imposed by the E791 spectrometer, these special detectors could only be located in certain positions. For the results reported here, the detectors were in one of two positions: (a) upstream of the beam stop near the position normally occupied by DC3-right (i.e., the beam-right drift chamber immediately upstream of the beam stop; note that in Table 2 rates are given only for the left-side chamber, DC3-left, since the right-side chamber was removed for most of these tests); and (b) downstream of the beam stop approximately halfway between drift chambers 4 and 5 (DC4 and DC5) on the beam-left side. These positions are indicated in Fig. 3 by the circled letters and for the upstream and downstream positions, respectively.
Bonner spheres [12] were used to measure the total neutron flux over a large energy range. Six polyethylene spheres of different sizes were placed around a 4 mm diameter, 4 mm long LiI crystal that detected the recoiling and triton produced when slow neutrons were captured on 6Li (i.e., ). Each sphere (with diameters of 5.1, 7.6, 12.7, 20.3, 25.4, and 30.5 cm) had a known efficiency as a function of neutron energy. Measurements with the six spheres along with measurements made with (i) the 5.1 cm sphere covered with cadmium to absorb thermal neutrons, (ii) the LiI detector covered with cadmium (to absorb thermal neutrons) but no polyethylene sphere, and (iii) the LiI detector with no covering at all, provided a total of nine points that were used as the input to the unfolding code BUNKI [13]. The output of the unfolding included the neutron flux (neutrons/cm2) for 30 energy bins spanning a range from 231 MeV down to thermal neutran energies.
The pulse height spectra from the LiI scintillator shown in Fig. 4 indicate that the measurements had very little background. These spectra represent the test conditions with the highest and lowest rates in the LiI scintillator. The highest rate was recorded when the scintillator was covered with a 12.7 cm diameter polyethylene sphere and the lowest rate occurred when the scintillator was covered with cadmium but no polyethylene. The small difference in the peak positions was caused by a DC-offset due to the factor of ten difference in rate. The long tail below the peak seen in the measurement with the polyethylene sphere was caused by events in which neutron capture occurred so near the edge of the scintillator that the full energies of the recoiling nuclei were not measured. The negative slope in the tail below the peak seen in the low rate measurement was due to charged particles. To provide meaningful numbers as input to the unfolding code, the counts due to minimum ionizing particles were subtracted from each measurement.

The results of the unfolding for four different beam stop configurations are shown in Fig. 5 for positions upstream and downstream of the beam stop. One noticeable feature of all the neutron spectra with the beam stop in place was the low flux around 100 eV. We interpret this feature as an artifact of the unfolding procedure, rather than as a physically meaningful. This feature has previously been observed by others [13] in different situations and is probably due to the fact that no Bonner sphere had a response function that peaked in this energy range, and thus no measurement strongly constrained the unfolding results. The unfolding procedure had several degrees-of-freedom since it produced the neutron flux in 30 energy bins with only 9 points of input data.

The two 3He counters [14], which detected only low energy neutrons, provided a check of the Bonner sphere results. The 3He counters had an active volume 2.5 cm in diameter and 15 cm long, and were filled to a pressure of 4 atmospheres. These gas counters detected slow neutrons via 3He()3H and were used in pairs; one was covered with 0.05 cm cadmium (which stopped neutrons with energies below about 0.1 eV) and the other was left unshielded. The flux calculated from the Bonner sphere measurements was used as input to calculate the rates expected in the unshielded 3He counter and in the 3He counter covered with cadmium. The ratios of measured 3He counter rates to those predicted by the Bonner sphere results are shown in Table 3. They exhibit variations larger than the 20% uncertainty in the normalization, but typically agree at the factor of two level.
| Configuration | 1 | 2 | 3 | 4 |
|---|---|---|---|---|
| No beam | Tungsten | Shielded | Extra | |
| stop | only | beam stop | poly, Pb | |
| upstream position | ||||
| 3He without Cd | 0.6 | 0.9 | 0.9 | 1.9 |
| 3He with Cd | 0.8 | 0.6 | 0.8 | 1.1 |
| downstream position | ||||
| 3He without Cd | 2.1 | 0.9 | 0.8 | 1.0 |
| 3He with Cd | 2.2 | 0.3 | 0.5 | 0.9 |
For neutron energies between 1 and 10 MeV, the neutron flux measured by the Bonner spheres was checked using the liquid scintillators. The 5 cm diameter and 5 cm long liquid scintillator detected neutrons via () elastic scattering and could identify the neutron-induced counts by using a pulse shape discrimination method [15]. The scintillation produced by neutron interactions had longer decay times than that from minimum ionizing particles due to the highly ionizing nature of the recoiling protons. Pulse shape discrimination from the liquid scintillators, as shown in Fig. 6 and Fig. 7, separates neutrons and photons above an equivalent electron energy of about 350 keV, which corresponds to ADC channel 50 in Fig. 6. Between 150 keV and 350 keV the discrimination between photons and neutrons was less clear, and below 150 keV there was no separation at all. A 900 keV proton, from () scattering for example, produces approximately the same amount of scintillation light as a 150 keV electron and therefore the liquid scintillators identified only those incident neutrons with energies above 900 keV.


Once neutron events were identified in the liquid scintillator, the pulse height spectrum was unfolded to give the neutron energy spectrum using the program FERD [16]. That spectrum, from 1 to 10 MeV, is compared with the spectrum measured by the Bonner spheres over the same energy range in Fig. 8 for beam stop configuration 3. Table 4 gives a comparison of these spectra for four beam stop configurations. They show variations similar to those seen with the 3He counters in Table 3, again suggesting consistency at the factor of two level.

| Configuration | 1 | 2 | 3 | 4 |
|---|---|---|---|---|
| No beam | Tungsten | Shielded | Extra | |
| stop | only | beam stop | poly, Pb | |
| Upstream position | 0.4 | 0.5 | 0.6 | 1.9 |
| Downstream position | 1.7 | 0.9 | 0.9 | 1.0 |
The liquid scintillator was also used to measure the photon flux and energy spectrum. Events with pulse shapes consistent with minimum ionizing particles were assumed to be originated by photons if there was no signal within 10 ns in the 10.2 cm 10.2 cm 0.32 cm plastic scintillators located 9 cm upstream and downstream from the center of the liquid scintillator. The number of counts due to photons was approximately five times greater than that due to neutrons, as shown in Fig. 9. The neutron spectrum showed no structure, but there were two Compton edges visible in the photon spectrum, one near 35 counts and the other near 250 counts. These are the result of photons with energies near 0.5 MeV and 2 MeV, respectively, and correspond to a combination of photons from the capture of neutrons on boron (0.477 MeV) and positron-electron annihilation (0.511 MeV), which are too close in energy to be resolved by this detector, and the 1H()2H reaction (2.2 MeV). The photons from these sources were a fairly small fraction of the total photon rate. The liquid scintillator was not sensitive to photons with energies below about 100 keV. The discriminator threshold was set near that level because the pulse shape discrimination method does not work at lower energies.

An intrinsic germanium detector was used to identify photons that were produced from neutron capture. The germanium detector results are consistent with those from the liquid scintillator. For illustration, two spectra taken with the germanium detector are shown in Figs. 10(a) and 10(b). For the spectrum in Fig. 10(a), the gain of the amplifier was set low to collect data on high energy photons. For the spectrum shown in Fig. 10(b), the gain was raised to be sensitive to low energy photons. Several photon lines are visible, but they did not constitute a large fraction of the overall rate. Some of the visible lines are: the 7.4 MeV line from neutron capture on Pb; the 2.2 MeV line from radiative capture on hydrogen; the positron-electron annihilation line at 511 keV; the Doppler broadened peak at 477 keV from the decay of an excited 7Li that is produced along with an by neutron capture on 10B; and several lines (59, 78, 146, and 201 keV) from capture on 186W. The tungsten lines in Fig. 10(b) are visible because for this data the beam stop did not have its full complement of outer lead shielding. With full lead shielding the tungsten lines disappear.

Charged particles were identified using a coincidence between the liquid scintillator and the plastic scintillators. The pulse shape from the liquid scintillator was required to be consistent with a minimum ionizing particle. Signals from the plastic scintillators were required to satisfy one of two conditions: either both plastic scintillators had signals with measured times within ns of the liquid scintillator pulse, or one of the signals had a measured time within ns of the liquid scintillator and also had pulse height consistent with a minimum-ionizing charged particle.
The relative fluxes of neutrons, photons, and charged particles determined from the liquid scintillator and of neutrons determined from the Bonner spheres are collected in Table 5 for four beam stop configurations. The shielding added to the metallic beam stop reduced the flux of neutrons and photons, as measured by the liquid scintillators, by approximately a factor of three when compared to the unshielded beam stop. The effect of the shielding on the neutron flux as measured by the Bonner spheres was much greater since that detector was sensitive to lower energy neutrons. The shielding was not very effective in stopping the charged particle leakage.
| 1 | 2 | 3 | 4 | ||
| No beam | Tungsten | Shielded | Extra | ||
| Particle | Detector | stop | only | beam stop | poly, Pb |
| upstream position | |||||
| neutrons | Bonner spheres | 1.0 | 430 | 80 | 19 |
| neutrons | liquid scintillator | 1.0 | 85 | 29 | 16 |
| photons | liquid scintillator | 1.0 | 19 | 7.6 | 4.6 |
| charged particles | liquid scintillator | 1.0 | 2.1 | 1.5 | 1.4 |
| downstream position | |||||
| neutrons | Bonner spheres | 1.0 | 623 | 131 | 46 |
| neutrons | liquid scintillator | 1.0 | 63 | 28 | 19 |
| photons | liquid scintillator | 1.0 | 17 | 7.5 | 5.3 |
| charged particles | liquid scintillator | 1.0 | 2.4 | 2.4 | 2.5 |
4.4 Drift Chamber Shielding Tests
Drift chambers, because of their close proximity to the beam stop, were of special concern during the beam tests. To investigate the types of particles causing drift chamber hits, we operated a small test drift chamber that could be locally shielded with polyethylene and lead. The test drift chamber was an early prototype of the E791 drift chambers and had the same wire size and cell geometry, but had only a few wires that were 17 cm long. It had an aluminum frame with Mylar windows on two sides. On four sides of the test chamber (outside any shielding materials), we mounted plastic scintillators to tag charged particles. Coincidences between pairs of wires or between wire and scintillators were formed using commercial logic units and were counted using CAMAC scalers read out by the E791 data acquisition system.
While the test chamber measurements do not lend themselves to precise quantitative conclusions, they provide general indications of the major sources of drift chamber hits. Sample results are given in Table 6 from data taken in two different locations of the test drift chamber with the shielded beam stop (configuration 3). One location was immediately upstream of the beam stop and occupied part of the space normally occupied by the right-side DC3 chamber. The other location was immediately downstream of the beam stop and occupied part of the space normally occupied by the left-side DC4 chamber. In other words, the test chamber was placed at the locations of the E791 drift chambers which had been removed for the purpose of allowing access to the beam stop. The information displayed in Table 6 is in the form of hit rates in various local shielding scenarios normalized to the hit rate in the same chamber in the same location with no local shielding. Table 6 also shows the fraction of wire hits accompanied by signals in the surrounding scintillators. It should be recalled that the charged decay products of kaon decays in the beam constituted a significant source of hits. This source would not be significantly affected by locally shielding the test chamber.
| Upstream position | Downstream position | |||
| Local Shielding | Chamber | Fraction with | Chamber | Fraction with |
| description | rate | scintillator | rate | scintillator |
| No local shielding | 1.00 | 0.38 | 1.00 | 0.69 |
| 0.32 cm lead | 0.81 | 0.38 | 0.89 | 0.71 |
| 1.27 cm lead | 0.64 | 0.37 | 0.87 | 0.81 |
| 5 cm lead | 0.47 | 0.37 | 0.59 | 0.80 |
| 5 cm borated (5%) polyethylene | 0.83 | – | 0.92 | – |
One important conclusion can be drawn from the fact that the test chamber rates decreased by only 17% in the upstream position, and decreased by even less (only 8%) in the downstream location, when 5 cm of borated polyethylene was placed around the test chamber. This suggests that neutron interactions in the chamber gas comprise a small fraction of the drift chamber rates in configuration 3. In other words, our shielding of the beam stop succeeded in removing low energy neutrons as a major source of hits in the drift chambers nearby.
Another conclusion from these measurements is that in the location immediately downstream of the beam stop chamber rates are caused mainly by fairly energetic charged particles. This is indicated by the large fraction of chamber hits accompanied by scintillator hits and the fact that 5 cm of lead shielding (between the chamber and the scintillator) reduced this hit rate by only 41% while at the same time the fraction of hits accompanied by scintillator hits increased. Unfortunately, whether a large fraction of these penetrating charged particles originated in the beam stop, as opposed to in decays of beamline ’s, cannot be inferred from these measurements. In contrast, in the location upstream of the beam stop, chamber rates decreased more steeply as lead shielding was added (reaching a 53% drop at 5 cm) while the fraction of chamber hits accompanied by scintillator hits did not increase. Evidently, some mixture of soft charged particles and photons account for a large fraction of the chamber hits in the location immediately upstream of the beam stop.
4.5 Cherenkov Phototube Shielding Tests
A series of tests were performed to investigate the Cherenkov counter rates in the presence of the beam stop. We accumulated data using four Cherenkov photomultiplier tubes (PMT’s), which had been removed from the E791 Cherenkov counter so they could be shielded locally with polyethylene and lead. For these tests, the beam-left Cherenkov counter was removed from the area, making room for the special PMT test setup. The location of the test setup is indicated in Fig. 3 by the circled letter . The location of the test PMT’s was approximately the same as when attached to the Cherenkov counter gas volume in E791. On the other side of the beam, the beam-right Cherenkov counter was operated normally. The tests reported here were done with the beam stop in configurations close to configuration 3. Small changes in beam stop shielding did not affect Cherenkov PMT rates, so that some small variations in shielding were made in parallel with these tests.
The Cherenkov PMT’s were RCA/Burle model 8854 photomultiplier tubes, which have high gain and are capable of detecting single photoelectrons. Discriminator thresholds were set low, so that they were sensitive to single photoelectron pulses for the tests. One PMT was connected to a clear Lucite hollow cylindrical support that served in E791 to connect the PMT to the window of the Cherenkov box. The PMT and Lucite support were surrounded by a 0.64 cm thick iron cylinder to reduce the fringe field from the downstream spectrometer magnet. The second PMT was identical to the first except that the clear Lucite support was replaced by a black nylon support to test whether light was generated in the Lucite. The third PMT had an iron cylinder surrounding it that was twice as thick as normal. The fourth PMT was set up to permit shielding on all sides with lead, polyethylene, and FLEX/BORON. The rates in each of these PMT’s were measured using the standard E791 data acquisition system and the same pseudo-random trigger described previously.
The test PMT’s had hit rates only 30% lower than the PMT’s which viewed the gas volume. It is likely that the hits in the isolated PMT’s were due mainly to low energy photons and thermal neutrons. Electrons from photons interacting in the glass (or from nearby material if the electrons subsequently pass through the glass) could generate the pulse height required to trigger the Cherenkov discriminators. Thermal neutrons could be captured by the 10B in the borosilicate glass from which the photomultiplier tube was constructed. Presumably the rates on the PMT’s on the Cherenkov counter were derived from the same sources, plus the light generated by kaon decay products above Cherenkov threshold. Results of the tests of the fourth PMT with different types of local shielding are given in Table 7. Shielding the photomultiplier tube with a thin layer of FLEX/BORON, which stopped only slow neutrons, reduced the rate by 24%. Surrounding the PMT with 5 cm of lead and 5 cm of borated (5%) polyethylene eliminated two-thirds of the rate. These results indicate that most of the Cherenkov hits induced by the beam stop can be attributed to low energy photons and neutrons, which can be substantially suppressed by locally shielding the PMT’s.
| Shielding description | Normalized rate |
|---|---|
| No shielding | 1.00 |
| 0.64 cm FLEX/BORON | 0.76 |
| 0.64 cm lead | 0.79 |
| 5 cm lead | 0.58 |
| 5 cm lead surrounded by | |
| 5 cm borated (5%) polyethylene | 0.33 |
5 Monte Carlo Simulations
We performed Monte Carlo simulations to assist in the design of the beam stop and to supplement the beam test measurements. The initial series of Monte Carlo simulations, using the HETC hadronic cascade Monte Carlo and MORSE low-energy neutron transport code (part of the CALOR89 [8] package), were performed prior to the beam tests to provide input to the initial beam stop design. Subsequently, a version of the CALOR89 program [17] coupled to GEANT [18] became available and was used for a much more extensive series of simulations [3]. Consistent results were obtained in both cases. The more recent simulations are described in this paper.
The GEANT-CALOR Monte Carlo package consists of several different transport programs:
-
•
The Nucleon-Meson Transport Code (NMTC) [19] transports nucleons, charged pions, and muons. The program transports protons in the energy range 1–3500 MeV; the range for neutrons is 20–3500 MeV. For charged pions and muons the energy range covered is 0.1– 2500 MeV.
-
•
Monte Carlo Ionization Chamber Analysis Package (MICAP) [20] transports neutrons below 20 MeV.
-
•
GEANT, which includes FLUKA [21], transports everything, including photons, that is not transported by NMTC or MICAP. For nucleons and pions between the NMTC cutoff and 10 GeV, a combination of FLUKA and NMTC is used.
The neutral beam used for these tests consisted primarily of neutrons with an average energy of about 8 GeV. Neutral kaons comprise about 4–8% of the beam and there is also some contamination from photons. In the simulations discussed here, only the neutron component of the beam was treated. The neutron momentum spectrum which was used as input for the GCALOR simulation of interactions in the beam stop was generated using GHEISHA [22], normalized at a total flux of n/Tp. Charged particles from the decays of ’s in the beam account for a large fraction of rates in the detectors, of course, but that contribution does not depend on the beam stop configuration. Consequently, when comparisons of Monte Carlo predictions were made to data, the comparisons were made to the difference of measured rates between running configurations with a beam stop and no beam stop. In other words, contributions to rates from decays were subtracted out using data taken without the beam stop in place. Photons in the beam could be neglected because they do not contribute significantly to leakage from the beam stop.
The beam stop materials, spectrometer magnets, and shielding-block walls of the experimental cave were included in detail using the GEANT geometry package. In all, 65 unique volumes consisting of up to 20 different materials were included in the simulation geometry. Neutron propagation was followed down to thermal energy. Neutrinos were ignored, but all other particles were tracked down to 10 keV. However, it was necessary to make some assumptions to simplify the simulations. Since the probabilities of neutrons and photons interacting in drift chambers is very small, it would have been very inefficient to simulate these interactions. Instead we estimated the interaction probability for neutrons and photons using the particle energy and the amount and type of material traversed. Then neutron and photon interaction rates in the drift chambers were calculated based on the Monte Carlo generated neutron and photon fluxes. The neutrons were assumed to interact with the hydrogen, carbon, and argon atoms in the drift chamber gas (a 50-50 mixture of argon-ethane). The () cross section was taken to be 20 barns for neutrons with energies below 75 keV and (5.5 barns)/ for neutrons with energies above 75 keV [23]. We did not include the interactions of neutrons with energies below 10 eV since they could not cause ionization and the capture cross section is small. The interaction of photons in the drift chambers was approximated by parameterizing the interaction probability as the thickness (22 mg/cm2 per view) divided by the attenuation length. The attenuation length for low-Z materials (except hydrogen) was approximated as 14.4 g/cm in the energy range 0.01–5 MeV [24].
6 Comparisons of Data and Monte Carlo
Comparisons between Monte Carlo predictions and our measurements are possible. For the specialized detectors which measured neutrons and photons, it is possible to make a direct comparision. For E791 detectors, such as the drift chambers, it is possible to compare only total rates, which requires summing Monte Carlo generated predictions from neutrons, photons, and charged particles. A third type of comparision is something of a hybrid of these two. It is possible to use the specialized detector measurements of neutron, photon, and charged particle fluxes, supplemented by Monte Carlo, to predict drift chamber rates. This comparision depends on the Monte Carlo because the specialized detectors were not in the same locations as the drift chambers and because the different energy response of the drift chambers must be taken into account. Another complication which applies to comparisions of predictions with measured drift chamber rates is that a single particle may have caused several adjacent hits. For example, a charged particle may be incident at a large angle so that it traverses more than one cell or a neutron may create (through the interaction with a proton in the gas) extremely large ionization, which might result in multiple hits via cross talk in the electronics. We have attempted to account for these complications in the comparisions which follow, but in these cases some extra uncertainty appertains.
The data obtained with the Bonner spheres provided neutron energy spectra that are directly compared to the spectra from the GCALOR simulations in Figs. 11 and 12. Fig. 11 shows spectra obtained both upstream and downstream of the beam stop for the metallic beam stop of configuration 2. Fig. 12 shows the spectra obtained both upstream and downstream of the beam stop for the fully shielded configuration 3. In both Figs. 11 and 12, two sets of Monte Carlo generated neutron spectra are shown. The solid dots show the predicted neutron spectra for simulations that include the full experimental geometry (i.e., includes the effects of scattering on walls), while the open circles show only neutrons emerging directly from the beam stop without further scattering. Several features of these comparisons are evident:


-
1.
For the bare metallic beam stop (configuration 2), both Monte Carlo predictions and the Bonner sphere neutron spectra peak in the energy range between 0.1 and 1 MeV. The Bonner sphere fluxes are higher by a factor of two to three. In the range between 1 MeV and 7 MeV where Bonner sphere results overlap the liquid scintillator measurement, the liquid scintillator indicated the lower neutron flux.
-
2.
For the bare metallic beam stop (configuration 2), most neutrons with energies below 0.01 MeV are the result of rescattering after leaving the beam stop, as can be seen from comparing the solid dots to open circles in Fig. 11. While neutron leakage from the shielded configuration (configuration 3 in Fig. 12) is significant at energies below 0.01 MeV, the fraction of neutrons below about 1 MeV which have rescattered is at least one-half and increases significantly for lower energies. Rescattered neutrons dominate at thermal energies. These results emphasize the importance of including the external geometry in the simulation for a practical situation.
-
3.
In the energy range of 0.1 to 1 MeV where the neutron leakage from the beam stop is the most severe, both the Monte Carlo and the measured spectra indicate that the shielding added to the beam stop for configuration 3 reduced the leakage by roughly an order of magnitude.
-
4.
The dip in the Bonner sphere spectra between about 1 eV and 1 keV is not reproduced in the Monte Carlo. As noted earlier, this feature is probably an artifact of the unfolding method used to obtain the neutron energy spectrum from the Bonner sphere measurements.
A similar comparison with the Monte Carlo was made for the photon spectrum measured by the liquid scintillator. The photon spectrum was calculated from the measured pulse height assuming all photon interactions were due to Compton scattering. The comparison, shown in Fig. 13 for configuration 3, indicates a similar energy spectrum, but the measurement gives about a 30% higher photon flux.
Ultimately, our goal is to understand the cause of the hit rates in detectors located near the beam stop, particularly the drift chambers since they are the closest. If the hit rates were excessive, this understanding would help to further optimize the beam stop to reduce them. To that end, we have compared drift chamber hit rates to the Monte Carlo predictions, and to predictions based on the specialized detector measurements supplemented by Monte Carlo. As noted earlier, several complications must be taken into account in making such comparisons:

-
1.
Some of the drift chamber rate was due to cases in which a single particle caused hits in many adjacent cells. To account for this, the drift chamber rates were recalculated in units of “clusters”, defined as a group of hit adjacent wires consistent with the interaction of a single particle.
-
2.
The cluster rates due to particles from decays upstream of the beam stop were subtracted using data taken with no beam stop in place.
-
3.
The results from the liquid scintillator and Bonner sphere measurements were adjusted to account for the angle at which the neutrons and photons traversed the drift chambers. No angular information was available from these detectors so a scale factor was used based on the Monte Carlo calculations.
-
4.
The neutron and photon detectors did not occupy the same location as the drift chambers so a correction was calculated from the Monte Carlo to account for the position dependence of particle-induced rates. In particular, for the downstream setup, the neutron and photon detectors were between DC4 and DC5. A correction was calculated to effectively relocate the detectors to the position of DC4 (i.e., to move the detectors upstream by about 92 cm).
-
5.
A correction was applied to account for the energy thresholds in the liquid scintillator. The liquid scintillator did not detect photons with energies below 200 keV or charged particles that could not penetrate the 1.2 g/cm2 of material surrounding it. Both corrections were calculated using the Monte Carlo.
The correction factors for items 3, 4, and 5 were estimated separately for charged particles, neutrons, and photons. When combined, the magnitudes of the corrections for the upstream detectors were about 50% for neutron-induced rates, 70% for photon-induced rates, and 120% for charged particles. In the downstream position, the magnitudes were roughly doubled because of the position correction. Table 8 shows the beam stop induced drift chamber rates (for chambers DC3 and DC4) for three beam stop configurations after the corrections are applied. The normalization to the telescope at the target has been used since it is the only normalization available for the liquid scintillators and Bonner sphere measurements. The rates are given in terms of clusters, as defined above, per telescope hit. There were approximately telescope hits/Tp on target.
| Configuration | 2 | 3 | 4 |
|---|---|---|---|
| Tungsten | shielded | extra | |
| only | beam stop | poly, Pb | |
| upstream position | |||
| Drift chamber rate (DC3) | 3320 | 770 | 550 |
| Monte Carlo | |||
| charged particles | 2000 | 440 | 300 |
| neutrons | 380 | 70 | 26 |
| photons | 840 | 86 | 120 |
| Sum | 3200 | 600 | 450 |
| Estimates based on specialized detector measurements | |||
| charged particles | 1340 | 380 | 240 |
| neutrons | 370 | 80 | 16 |
| photons | 270 | 110 | 63 |
| Sum | 1980 | 570 | 320 |
| downstream position | |||
| Drift chamber rate (DC4) | 2540 | 654 | 624 |
| Monte Carlo | |||
| charged particles | 860 | 380 | 240 |
| neutrons | 210 | 39 | 16 |
| photons | 170 | 73 | 87 |
| Sum | 1240 | 490 | 340 |
| Estimates based on specialized detector measurements | |||
| charged particles | 1040 | 750 | 850 |
| neutrons | 270 | 46 | 16 |
| photons | 280 | 110 | 91 |
| Sum | 1590 | 910 | 960 |
The results in Table 8 indicate:
-
•
Absolute predictions of drift chamber rates from both the Monte Carlo and estimates of particle fluxes from the specialized detectors agree with the measured rates, and each other, typically to within a factor of two.
-
•
Both the Monte Carlo simulations and the specialized neutron and photon detector measurements indicate that drift chamber rates are dominated by charged particles, rather than neutrons or photons, for all configurations of the beam stop. This is an interesting result, and consistent with the indications from the test drift chamber studies (section 4.4). It should be recalled that the choice of tungsten for the core material was based partly on the fact that tungsten has a large inelastic neutron cross section down to 1 MeV. Neutron leakage would be a larger problem with other core materials.
The fractional variation of actual drift chamber rates between different beam stop configurations tends to be approximately reproduced in both the Monte Carlo predictions and the estimates based on the neutron and photon detectors. The exception was the downstream measurement after additional shielding was added (configuration 4). The Monte Carlo rates dropped with the extra shielding while the drift chamber rate and the rate calculated from the neutron and photon detector measurements stayed about the same. Also, the special detector measurements indicated too high a rate from charged particles downstream of the shielded beam stops. These detectors, however, were intended for neutron and photon measurements. The importance of charged particles became clear as a result of these measurements, but were not a focus initially.
Other indications that charged particles were a major source of detector rates were present in both the data and simulations. In one of the many variations of the beam stop configuration that were tested, we added copper plates to the outside surface on one side. We found a roughly 25% drop in rates in the nearby drift chamber with the addition of 5 cm of copper. Also, left–right asymmetries appeared in the hit rates for the drift chambers downstream of the beam stop when magnetic fields were present. The GCALOR simulation exhibited qualitatively similar asymmetries which were due to protons escaping the beam stop. These protons originated in collisions with tungsten nuclei and usually escaped with momenta in the range of about 200 MeV up to 1 GeV.
7 Discussion
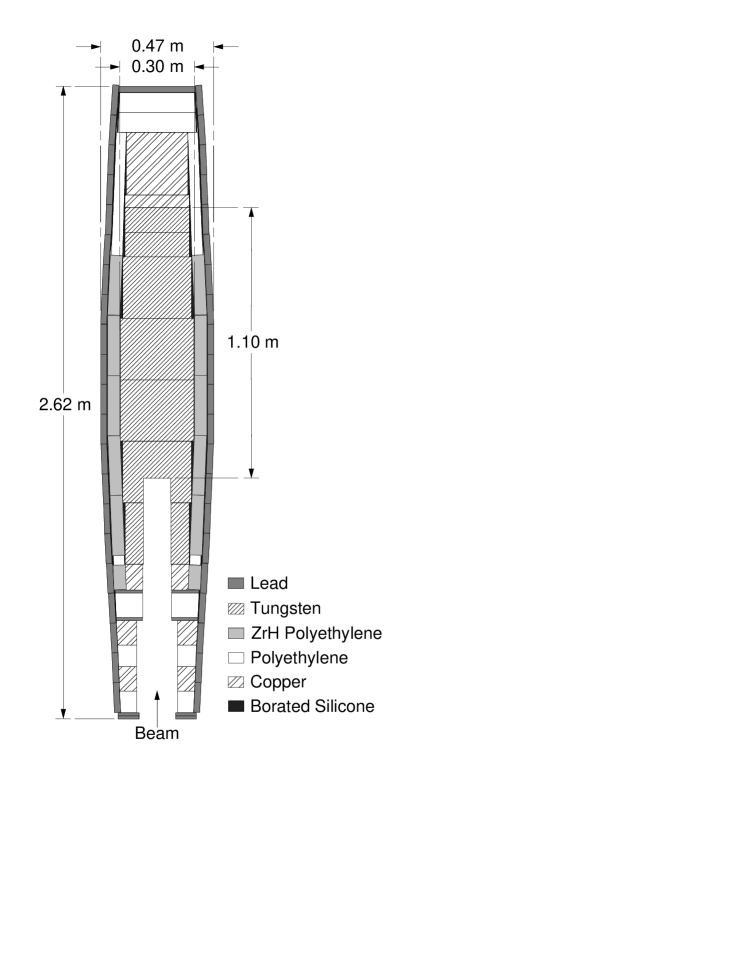
Subsequent to the tests described here, a number of changes were made to the beam stop design. For the most part they were intended to reduce the leakage of charged particles, since our studies indicated that charged particles were the main source of drift chamber rates near the beam stop. In particular, more high-mass material was used in a number of locations. Most of the borated (0.5%) polyethylene (density 0.84 g/cm3) on the sides of the beam stop was replaced with borated (0.5%) zirconium hydride polyethylene [9] with a density of 3.6 g/cm3. This material has the attractive features of borated polyethylene, good hydrogen density along with boron to capture thermal neutrons, but is much more dense and has more stopping power for charged particles. Also, three of the polyethylene sections in the tunnel were replaced by copper and the thickness of the outer lead layer was quadrupled. The final beam stop as used in E871 is shown in Fig. 14.
In addition to modifications to the beam stop, we decided for E871 to run with a platinum target at a 3.75 degree production angle. This change from the initial E791 configuration of the beam (a copper target with a 2.75 degree production angle) was motivated by a number of considerations. The larger angle results in a more favorable ratio. The average neutron energy is also reduced, leading to less energy per neutron deposited in the beam stop. The platinum target is shorter (for the same number of interaction lengths) than the copper target, which benefits background rejection in the search. This improvement results from the fact that the target is oriented at an angle with respect to the neutral beam and a shorter target presents a smaller (i.e., more pointlike) kaon source as viewed by the spectrometer. For the purpose of studying target issues, a small amount of test data was taken with a platinum target at 3.75 degrees near the end of the 1992 run in one beam stop configuration, but that data was not useful for beam stop studies.
With the installation of E871 we replaced the drift chambers used during the beam tests with straw chambers, making a direct comparision between chamber rates with the final beam stop design and the earlier design impossible. Having reached what we believed was a satisfactory design, we did not undertake further beam tests. E871 had successful physics runs in 1995 and 1996. While we did not conduct further beam tests, we can estimate the contribution of the beam stop to straw chamber rates by comparing the distribution of chamber hits measured with our pseudo-random (pulser) trigger to that expected from decay products from Monte Carlo. This estimate is straightforward because our measurements showed that hits associated with the beam stop tend to be distributed almost flat across the chambers. In the worst-case straw chambers — those immediately upstream of the beam stop, our conclusion is that decays account for about half of the rate averaged across the chamber. In the wires with the highest singles rate, about 600 kHz near inner (beam-side) edge under typical data-taking conditions, decays account for about 70% of the hits.
The plan to put a beam stop near active detectors in BNL E871 was initially greeted with skepticism based on the conventional wisdom that leakage, particularly of neutrons, would cause untenably high hit rates in the nearby detectors. However, with the final beam stop in place, E871 has run at beam intensities up to 20 Tp/spill (above our design goal of 15 Tp/spill) without adverse rate effects in the chambers nearest the beam stop. Whether the successful beam stop development will have importance for other experiments is not clear, but it at least indicates that a hadron absorber can probably be integrated into many experimental setups if appropriate care is taken in the design and testing.
Our program of design and testing involved significant beam tests conducted over a two year period at the AGS and was supplemented by extensive Monte Carlo simulations using state-of-the-art hadronic shower and neutron transport codes. While ultimately successful, it is clear in retrospect that many parts of this program could have been improved. For example, the largest uncertainty in our measurements came from our relatively poor monitoring of the neutral beam flux incident on the beam stop. It is difficult to monitor a neutral beam, but in order to reliably compare different beam stop configurations it is essential to know the incident flux and spectrum. Our comparisons were never reliable to better than 20% owing to beam flux uncertainties, so that our optimization of the beam stop may have been compromised by an inability to recognize improvements between alternative configurations when they were smaller than 20%.
Another limitation clear in retrospect was our marginal ability to detect and identify charged particles. Our efforts in preparing specialized detectors were motivated by concerns over neutron leakage from the beam stop and over photons which we expected to arise as by-products of neutron capture. Ultimately our conclusion is that the increase in hit rates in drift chambers caused by the fully shielded beam stop is dominated by charged particles, which we were ill-equipped to measure.
While in practice we used Monte Carlo simulations in a limited way to optimize the beam stop design, primarily by comparing the leakage from slightly different configurations when it was not practical to make measurements, one can ask what our measurements show regarding the validity of the Monte Carlo programs used. It is important to remember that our measurements were not planned with the goal of validating or testing Monte Carlo programs, and if that had been the goal, very different measurements would have been made. Nonetheless, some general conclusions can be drawn with respect to the simulation of a complex shielding geometry.
The GCALOR Monte Carlo predictions seem to generally agree with our measurements within a factor of two. The differences are larger than the uncertainties in the incoming beam fluxes can account for, although those uncertainties are significant on this scale. Where there are disagreements in absolute numbers, the shapes of spectra tend to agree reasonably well. In view of the number and complexity of the processes being simulated, which span the energy range from above 10 GeV down to below 1 eV, this level of agreement seems rather good. While our measurements cannot distinguish between particles coming directly from the beam stop and those which have rescattered on other material, it is clear that including the surrounding material in the Monte Carlo geometry was very important. The Monte Carlo programs are clearly powerful tools for evaluating the efficacy of alternative absorber configurations, but should be used in concert with actual measurements whenever possible.
Acknowledgments
We are grateful to T.A. Gabriel, B.L. Bishop, K. Furuno, T. Jenkins, and W.R. Nelson for their help with running the CALOR Monte Carlo, and C. Zeitnitz for his help with GCALOR. We thank R. Brown, J. Scaduto, and the staff at the AGS for their assistance during the beam stop construction. We appreciate the contributions of R. Erbacher, C. Hoff, N. Mar, R. Martin, and M. Pommot-Maia in collecting our data. Most of the Monte Carlo simulations reported here were run on the Physics Detector Simulation Facility (PDSF) at the SSC Laboratory. This work was supported in part by the U.S. Department of Energy, the National Science Foundation, and the Robert A. Welch Foundation.
References
- [1] A.P. Heinson et al., BNL Proposal 871 (1990).
- [2] S. G. Wojcicki, BNL E791 technical note KL-290 (1990);
- [3] S.D. Worm, Design and Evaluation of a Beam Stop in the Spectrometer of a Rare Kaon Decay Experiment, Ph. D. thesis, University of Texas at Austin (1995).
- [4] A.P. Heinson et al., Phys. Rev. D 51 (1995) 985.
- [5] S. Graessle et al., Nucl. Instr. and Meth. A 367 (1995) 138.
- [6] A.P. Heinson and D. Rowe, Nucl. Instr. and Meth. A 321 (1992) 165.
- [7] Y. Hsiung et al., Phys. Rev. Lett. 55 (1985) 457; J. Crittenden et al., Phys. Rev. D 34 (1986) 2584.
- [8] T.A. Gabriel et al., ORNL Report TM-11185 (1990).
- [9] FLEX/BORON, borated zirconium hydride polyethylene, and most other neutron shielding materials were obtained from Reactor Experiments, Inc., 1275 Hammerwood Avenue, Sunnyvale CA 94089.
- [10] E.C. Milner, BNL E791 technical note KL-256 (1989); P. Buchholz and W.K. McFarlane, BNL E791 technical note KL-268 (1989).
- [11] J. McDonough, Proceedings of DPF 92 (Fermilab, 1992), World Scientific, p. 1708; M. Diwan, SSCL-Preprint-192 (1993).
- [12] R.L. Bramblett, R.I. Ewing, and T.W. Bonner, Nucl. Instr. and Meth. 9 (1960) 1.
- [13] K.A. Lowry and T.L. Johnson, NRL Memorandum Report 5340 (1984).
- [14] K.-H. Beimer, G. Nyman, and O. Tengblad, Nucl. Instr. and Meth. A 245 (1986) 402.
- [15] C.L. Morris et al., Nucl. Instr. and Meth. 137 (1976) 397.
- [16] B.W. Rust, D.T. Ingersoll, and W.R. Burrus, ORNL/TM-8720 (1983).
- [17] C. Zeitnitz and T.A. Gabriel, Nucl. Instr. and Meth. A 349 (1994) 106.
- [18] R. Brun, F. Bruyant, M. Maire, A.C. McPherson, P. Zanarini, CERN DD/EE/84-1 (1987).
- [19] W.A. Coleman and T.W. Armstrong, ORNL-4606 (1970); R.G. Alsmiller, Jr., F.S. Alsmiller and O.W. Hermann, Nucl. Instr. and Meth. A 295 (1990) 337.
- [20] J.O. Johnson and T.A. Gabriel, ORNL/TM-10196 (1987).
- [21] P.A. Aarnio et al., CERN Report TIS-RP/190 (1987).
- [22] H. Fesefeldt, Aachen Technical Report PITHA 85-02, (September,1985).
- [23] Cross Section Evaluation Working Group, ENDF/B-VI Summary Documentation, Report BNL-NCS-17541 (ENDF-201) (1991), edited by P.F. Rose, National Nuclear Data Center, Brookhaven National Laboratory, Upton, NY, USA.
- [24] R.M. Barnett et al., Review of Particle Physics, Phys. Rev. D 54 (1996) 140.